A comprehensive analysis on preservation patterns of gene co-expression networks during Alzheimer’s disease progression
Bạn đang xem bản rút gọn của tài liệu. Xem và tải ngay bản đầy đủ của tài liệu tại đây (2.75 MB, 21 trang )
Ray et al. BMC Bioinformatics (2017) 18:579
DOI 10.1186/s12859-017-1946-8
METHODOLOGY ARTICLE
Open Access
A comprehensive analysis on preservation
patterns of gene co-expression networks
during Alzheimer’s disease progression
Sumanta Ray1† , Sk Md Mosaddek Hossain1*†
, Lutfunnesa Khatun1 and Anirban Mukhopadhyay2
Abstract
Background: Alzheimer’s disease (AD) is a chronic neuro-degenerative disruption of the brain which involves in
large scale transcriptomic variation. The disease does not impact every regions of the brain at the same time, instead it
progresses slowly involving somewhat sequential interaction with different regions. Analysis of the expression
patterns of the genes in different regions of the brain influenced in AD surely contribute for a enhanced
comprehension of AD pathogenesis and shed light on the early characterization of the disease.
Results: Here, we have proposed a framework to identify perturbation and preservation characteristics of gene
expression patterns across six distinct regions of the brain (“EC”, “HIP”, “PC”, “MTG”, “SFG”, and “VCX”) affected in AD.
Co-expression modules were discovered considering a couple of regions at once. These are then analyzed to know
the preservation and perturbation characteristics. Different module preservation statistics and a rank aggregation
mechanism have been adopted to detect the changes of expression patterns across brain regions. Gene ontology
(GO) and pathway based analysis were also carried out to know the biological meaning of preserved and perturbed
modules.
Conclusions: In this article, we have extensively studied the preservation patterns of co-expressed modules in six
distinct brain regions affected in AD. Some modules are emerged as the most preserved while some others are
detected as perturbed between a pair of brain regions. Further investigation on the topological properties of
preserved and non-preserved modules reveals a substantial association amongst “betweenness centrality” and
”degree” of the involved genes. Our findings may render a deeper realization of the preservation characteristics of
gene expression patterns in discrete brain regions affected by AD.
Keywords: Module preservation measures, Gene co-expression networks, Hierarchical clustering, Rank aggregation
Background
Alzheimer’s disease (AD) has been characterized as an
irreversible, progressive neuro-degenerative incoherence
in the brain and the major reason of dementia [1]. In
AD, connections between cells in the brain are destroyed
and eventually these cells die, which affects how the brain
works. On its early onset, it is classified as short-term loss
of memory. As the disease progresses, people suffers from
issues with dialect, disorientation (letting in easily getting
*Correspondence:
† Equal contributors
1
Department of Computer Science and Engineering, Aliah University, West
Bengal, 700156 Kolkata, India
Full list of author information is available at the end of the article
lost), loss of inspiration, mood swings, behavioral problems, not accomplishing self-care, and thus they are often
kept isolated from family and the society. Its progression
can be summarized in three stages: Early (“mild”), Middle
(“moderate”) and Late (“severe”) [1, 2].
Typically, Alzheimer’s disease starts with very insignificant effects on the individuals capabilities or behavior.
Initially it is characterized by memory loss, especially
memory of more recent events which more often mistakenly classified as issues due to stress or mourning or
in elderly persons, as the ordinary consequence of ageing (“mild stage”). As the disease advances (“moderate
stage”), patient’s professional and social functioning continues to deteriorate because of increasing problems with
© The Author(s). 2017 Open Access This article is distributed under the terms of the Creative Commons Attribution 4.0
International License ( which permits unrestricted use, distribution, and
reproduction in any medium, provided you give appropriate credit to the original author(s) and the source, provide a link to the
Creative Commons license, and indicate if changes were made. The Creative Commons Public Domain Dedication waiver
( applies to the data made available in this article, unless otherwise stated.
Ray et al. BMC Bioinformatics (2017) 18:579
memory, logic, speech, and initiative and the affected individual become incapable of performing natural activities
of every day living [3]. In this stage, the most regions
of the brain undergo severe impairment and drastically
shrinks because of extensive cell death. During the final
(“severe”) stage, patients become completely dependent
upon caregivers [3, 4] and their dialect is lessened to
basic expressions or many a time single words, finally
prompting complete loss of discourse.
There are certain brain regions which are more susceptible to AD than others in terms of pathological
and metabolic characteristics, although it does not affect
all brain regions simultaneously [5–9]. It begins in the
“entorhinal cortex” (EC) and “hippocampus” (HIP) [10].
Other brain regions such as the “middle temporal gyrus”
(MTG) and the “posterior cingulate cortex” (PC) get
affected later during progression of the disease [10, 11].
Thus, it is more significant to know the co-expression
changes during the progression of AD from EC or HIP
region to other brain regions. Dr. Alois Alzheimer characterized the symptoms of the disease in 1906. But the
genesis of AD has continued to be elusive since then.
Merely the “APOE” gene was observed to be related to AD
in 1993. Thereafter, numerous analysis have been carried
out to detect the genes which are expressed differentially in the Alzheimer’s disease influenced brain regions
[12, 13]. In [14] Ray et al. differentiated 18-protein signatures in peripheral blood plasma which can be utilized
to forecast the clinical syndromes of AD in advance well
before the symptoms are apparent. Liang et al. [5] carried
out a comprehensive analysis and discovered that “APOE”,
“BACE1”, “FYN”, “GGA1”, “SORL1” and “STUB1 (CHIP)”
genes are expressed differentially in postmortem gene
expression dataset of six distinct brain regions. Moreover,
they have indicated the genes which observed substantial changes in their expression patterns due to AD. Ray
et al. [13] analyzed microarray data across four discrete
brain regions (EC, HIP, PC, MTG) by constructing gene
co-expression network for each region using differentially
expressed genes amongst AD affected and normal control
samples. They have identified the genes associated with
“zero topological overlap” between a pair of regions specific networks to characterize the differences between the
two brain regions.
A network-based systems biology methodology was
proposed to analyze the Alzheimer’s disease associated
pathways and their disfunctions among six discrete brain
regions by Liu et al. in [15]. They have discovered the
most pertinent AD associated pathways over the brain
regions. Bertram et al. [16] executed an Alzheimer’s disease “genetic association” meta-analysis and discovered 20
polymorphisms in 13 genes which are strongly associated
with AD. In [17], Puthiyedth et al. performed an comprehensive investigation with gene expression datasets
Page 2 of 21
of five distinct brain regions to get more insights into
the mechanisms of AD. In this study they have discovered that “INFAR2” and “PTMA” were up-regulated
whereas “FGF”, “GPHN”, “PSMD14” and “RAB2A” genes
were down-regulated.
Langfelder et al. [18] established an unprecedented
framework to unveil the relationship among the coexpressed modules using eigengene networks. To discover
the resemblances and divergence within the network
structures using co-expressed modules, considerable
amount of computational mechanisms have been proposed [19–23]. To analyze the gene expression data of
three different Hepatitis C related prognosis datasets, a
biclustering based approach has been proposed in [24].
A novel computational approach has been introduced
in [25] to discover the co-relation of gene expression
levels in co-expressed modules among human blood
and brain. Oldham et al. examined the evolutionary
relationship within the chimpanzee and human brains
using “gene co-expression networks” (GCN) in [19].
Hossain et al. unfolded the preservation affinity and
changes of expression patterns in consensus (or shared)
modules observed within distinct phases of evolvement
in HIV-1 disease utilizing an eigengene network based
approach [26].
This article presents a methodology to detect preservation pattern of gene co-expression network across six
brain regions affected in AD. Here, we have adopted module preservation statistics introduced by Langfelder et al.
[27] to detect the preserved patterns of gene expression. Initially, differentially expressed genes (DEGs) were
extracted from the expression data of six different brain
regions affected with AD. Next, we processed the data
by taking common genes of a pair of regions at a time
and built co-expression networks. Here, we have utilized
the “Weighted Gene Co-Expression Network Analysis”
(WGCNA) [28] framework to extract the co-expression
modules from the networks. We have analyzed the preservation statistics of co-expression modules obtained from
a pair of brain regions at a time. Moreover, we have
employed a rank aggregation based method described in
[29] to detect the overall changes of co-expression patterns among the brain regions in modular level. Here,
we have used 12 measures to rank each co-expressed
module and adopted a rank aggregation mechanism for
combining those ranks. Every module gets an aggregated
rank which describes its preservation characteristics in
two brain regions. We have also identified “gene ontology” (GO) terms and the most significant KEGG pathways
for the preserved and perturbed co-expressed modules
corresponding to each pair of brain regions. Additionally, to investigate whether there exists any topological
characteristics that distinguishes preserved module from
non-preserved ones, we have analyzed the ‘degree’ and
Ray et al. BMC Bioinformatics (2017) 18:579
‘betweenness centrality’ of all the proteins belonging to
each preserved and non preserved module. In our present
work, we have performed the whole analysis by taking EC
and HIP regions as references and investigate the preservation patterns of gene expression inside other brain
regions disrupted by AD.
Methods
This section describes our proposed framework for carrying out the present analysis. Figure 1 portrays the overall
framework of this article. Initially, we have identified differentially expressed (DE) genes for all six brain regions
and selected common DE genes between two regions
at a time, as described in “Dataset preparation” section.
Thereafter, for all the pairs of regions the common (or
intersection) genes were used to construct co-expression
modules using WGCNA framework mentioned in
“Identification of gene co-expression modules” section.
Next, we have employed the module preservation statistics introduced by Langfelder et al. in [27] to analyze the
preservation and perturbation patterns of the identified
co-expressed modules across a pair of regions [“Module
preservation” section] and utilized a rank aggregation tech-
Page 3 of 21
nique to rank the identified preserved and non-preserved
modules [“Rank aggregation” section]. Moreover, we
have identified the GO terms and the most significant
KEGG pathways which are linked with the modules
[“GO and pathway analysis of preserved and non-preserved modules” section]. Additionally, we have studied
the topological characteristics of genes belonging to those
modules in the “Topological insights into the preserved
and perturbed modules” section.
Dataset used
In this analysis we have used a publicly available microarray (“Affymetrix Human Genome U133 Plus 2.0”) expression dataset for six distinct brain regions (“EC”, “HIP”,
“PC”, “MTG”, “SFG”, and “VCX”) which are either metabolically or histopathologically associated to Alzheimer’s
disease [5]. Gene expression data was obtained from six
functionally and anatomically discrete normal aged brain
regions via laser capture microdissected neurons. The
dataset is available in the “Gene Expression Omnibus”
(GEO) with the series accession number “GSE5281”. Overall, the dataset contains 161 samples, among which 74
are normal or controls samples whereas 87 samples are
Fig. 1 Schematic diagram describing the overall analysis carried out in the present article
Ray et al. BMC Bioinformatics (2017) 18:579
Page 4 of 21
affected by Alzheimer’s disease, with an average age
of “79.8 ± 9.1” years. Each sample consists of 54675
genes. The samples were obtained from “clinically” and
“neuro-pathologically” categorized Alzheimer’s impacted
persons at three distinct AD centers (having an average post-mortem interval (PMI) of 2.5 h). We have
used the data collected from “entorhinal cortex” [EC;
“Brodmann area (BA) 28 and 34”], “hippocampus” [HIP;
“CA1 region”], “posterior cingulate cortex” [PC; “BA 23
and 31”], “medial temporal gyrus” [MTG; “BA 21 and
37”], “superior frontal gyrus” [SFG; “BA 10 and 11”], and
“primary visual cortex” [VCX; “BA 17”]. AD involved
samples were associated with a Braak stage varying from
III to VI [10, 30]. Expression data for every sample was
acquired from roughly around 500 number of pyramidal neurons. Entire dataset is comprised of AD affected
and control samples of six distinct brain regions. These
are EC region (10 AD and 13 control), HIP region (10
AD and 13 control), MTG region (16 AD and 12 control), PC region (9 AD and 13 control), SFG region (23
AD and 11 control) and VCX region (19 AD and 12
control).
Dataset preparation
First of all, as a preprocessing step, we have performed
log2 transformation of the gene expression data in order
to have equivalent effect on the two-fold increase or
decrease in gene expression data in log-scale. Then,
the gene expression data is normalized with the help
of ‘manorm()’ Matlab function to eliminate the inconstancies in microarray experimentation that influenced
the observed gene expressions as a consequence of
deviation in the experimental process, experimenter
biasness, samples acquisition-processing or additional
machine specifications. The manorm() function scales
the values in each sample (column) of the gene expression matrix with dividing them by the mean sample
intensity.
Next, to evaluate the differential expression of genes, we
processed the datasets of all six brain regions using a standard two-tailed and two-sample t-test taking control and
affected samples of a single region at a time. For discovering the patterns how gene expressions are mutated within
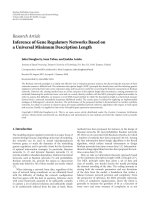
control and affected samples, six volcano plots were generated, one per brain region [Fig. 2]. We have employed
a
b
c
d
e
f
Fig. 2 Volcano plots of gene expressions of control and affected samples corresponding to all six brain regions in AD. Panel (a) EC (b) HIP (c) MTG
(d) PC (e) SFG (f) VCX. In each volcano plot, a scatter plot is shown plotting significance (− log10 (p-value)) versus fold change of gene expression
ratio (log2 (ratio)) of microarray data
Ray et al. BMC Bioinformatics (2017) 18:579
Page 5 of 21
“two samples t-test” for detecting differential expression
of genes and the statistical significance was measured
through p-value. Corresponding to every brain region fold
changes for expression value of every gene within control and affected samples was also computed. The cut off
threshold at significance level of 0.05 (indicated with ‘horizontal red dashed’ lines) and fold change at 2 (indicated
with ‘vertical red dashed’ lines) was set. The plots shown
in Fig. 2 indicates the genes which are expressed differentially among control and affected samples for all brain
regions at the chosen level of significance. Table 1 dictates
the count of the selected DEGs for the six distinct brain
regions.
Following the identification of six sets of DEGs, one
for each brain region, the mutual DEGs within a pair of
regions was computed at a time. The numbers of common DEGs among the six brain regions while considering
EC and HIP regions as reference datasets are shown in
Table 2.
The common genes (or ‘intersection genes’) were utilized for constructing a pair of gene co-expression networks, each of which corresponds to one region. For
producing gene co-expression networks and detecting
modules the popular WGCNA framework [28] have been
availed here.
Identification of gene co-expression modules
In the present section, we have described the step by step
procedure for constructing gene co-expression modules
for our present work.
Constructing gene co-expression networks through
adjacency matrix
Network may easily be expressed using an “adjacency
matrix” Adj =[ Muv ] that reflects the levels of interconnectedness of nodes within themselves. With a symmetric
adjacency matrix comprising of [ m × m] components a
gene co-expression network (GCN) can be constructed in
which every node represents a gene [31].
To represent an unweighted network, we assign a weight
1 if a pair of nodes u and v are connected (adjacent) to each
other, or a value 0 if nodes are not adjacent to each other
Table 1 Number of differentially expressed (DE) genes in the six
brain regions
Sl No.
Region
No. of DE genes
1
EC
12629
2
HIP
13534
3
MTG
14090
4
PC
17712
5
SFG
11963
6
VCX
14126
Table 2 Number of differentially expressed common genes
(intersection genes) among the six brain regions taking two
regions of interest at a time. Here, we have chosen EC and HIP
region as reference datasets
Sl No.
Regions compared
No. of intersection genes
1
EC-HIP
4083
2
EC-MTG
4175
3
EC-PC
4527
4
EC-SFG
3288
5
EC-VCX
3325
6
HIP-MTG
5204
7
HIP-PC
7156
8
HIP-SFG
4719
9
HIP-VCX
4216
to every individual element Muv in the adjacency matrix.
For a weighted network, the intensity level of connection
among the nodes u and v is denoted by 0 ≤ Muv ≤ 1.
0 ≤ Muv ≤ 1,
Muv = Mvu ,
Muu = 1.
(1)
For notational convenience, we have utilized the
“vectorizeMatrix()” function of the WGCNA package [28]
which accepts a symmetric matrix Adj ∈ Rm×m and a vector consisting of m(m − 1)/2 non-redundant elements is
returned as output [27].
vectorizeMatrix(Adj) =
{M21 , M31 , M32 , M41 , M42 , M43 , . . . , Mmm−1 } .
(2)
Here, for each pair of regions two separate GCNs were
created by calculating the ‘Spearman correlation’ between
expression profiles of intersection genes. Thus, we construct ten pairs of co-expression networks, among them 5
pairs are built by taking EC region as reference and other
5 pairs are constructed by taking HIP region as reference.
Scale free network transformation
We have adopted the “scale free” transformation principles introduced by Zhang et al. [28] to give emphasis upon
the high adjacency values sacrificing insignificant ones
and to fulfill the “scale free topology” criteria. Thus the
correlation coefficients for the entire gene co-expression
matrix were elevated to a constant power λ.
λ
.
Poweruv (Adj, λ) = Muv
(3)
We have discovered that the gene expression dataset of
intersection genes of the EC region (when compared to
HIP region) conforms to the “scale free topology” criterion
roughly at soft threshold power λ = 8 since the “scale-free
Ray et al. BMC Bioinformatics (2017) 18:579
Page 6 of 21
topology model fitting index”: R2 , attains a high thresholds value (0.95) [Fig. 3a and b]. Thereafter, utilizing λ as
an argument we have executed the “softConnectivity()”
function of the WGCNA package to compute the connectivities among the intersection genes and drawn the
scale free plot [Fig. 3c]. Let p(k) be the probability of
the nodes with connectivity k. A linear association among
4
3
2
1
0
5
10
15
20
Soft Threshold (power)
25
30
In network analysis field a primary goal is the discovery
of the modules or groups of strongly correlated genes. It
can be achieved by inspecting the resemblance in connection intensities or significant “topological overlap” within
the genes. In this article, for discovering modules in the
GCNs, we have utilized the “Topological Overlap Matrix”
(TOM) similarity measure [32–34] that represents the
extent of similarity between a pair of genes in respect of
commonality among the genes they are associated with.
TOM is represented as
TOMuv (Adj) =
z=u,v Muz Mzv
min(
z=u Muz ,
+ Muv
z=v Mzv ) + 1 − Muv
.
(4)
TOM dissimilarity matrix may readily be obtained by
employing the expression indicated below:
2
Duv = Dissimuv (TOM(Adj))
= 1 − TOMuv (Adj).
3
4
0
5
0
c
Topological overlap matrix based similarity-dissimilarity
measures
1
Mean Connectivity
500
1000
b
12 14 16 18 20 22 24 26 28 30
7 8 9 1011
5 6
1500
Scale Free Topology Model Fit, Signed R^2
−0.2
0.2 0.4 0.6 0.8 1.0
a
log(p(k)) and log(k) has been noticed in Fig. 3c which further affirms that scale free transformation of the EC gene
co-expression networks attains approximately at λ = 8 .
Similarly, we have utilized the procedure described
above to convert all other gene co-expression networks
into scale free networks.
6 7
8 9 1011
12 14 16 18 20 22 24 26 28 30
5
10
15
20
Soft Threshold (power)
25
30
log10(p(k))
−1.4
−1.0
−0.6
Soft Threshold, power= 8 scale R^2= 0.95 , slope= −1.18
(5)
Module discovery through hierarchical clustering
In this article, we have discovered the co-expressed network modules with the application of average linkage hierarchical clustering. Here we have applied the “dynamic
tree cut” algorithm [35] by utilizing the pairwise node dissimilarity Duv as input argument and the resultant stems
on the dendrogram are marked as modules.
−1.8
Module preservation
1.4
1.6
1.8
2.0
log10(k)
2.2
2.4
2.6
Fig. 3 Scale free transformation plots for EC region gene
co-expression network using differentially expressed intersection
genes with HIP region. The plots shows the network properties of
gene co-expression network of EC region for different soft thresholds.
For different soft thresholds, the plots visualize the scale free topology
fitting index (panel -a), the mean connectivity (panel -b). Panel c
shows the scale free topology plot of the EC region co-expression
network that is constructed with the power adjacency function
power (λ = 8). This scatter plot between log10 (p(k)) and log10 (k)
shows that the network satisfies a scale free topology approximately
(a straight line is indicative of scale-free topology)
In the present article, we have exerted the module preservation statistics introduced by Langfelder et al. in [27] to
discover the preservation and perturbation patterns of the
identified co-expressed modules across a pair of independent networks. We have adopted 12 preservation statistics
to investigate whether an identified module presents in a
“reference network” (having adjacency matrix Adj[r] ) may
be observed within an independent disjoint “test network”
(having adjacency Adj[t] ). Based on the values of each of
the preservation measures, all the identified modules in
the reference network were assigned 12 different ranks.
Table 3 presents the list of module preservation statistics we have utilized in our present work to discover a
module that exist in a given network may be detected
within a completely uncorrelated network and to rank
the identified modules based on those measures. In
Ray et al. BMC Bioinformatics (2017) 18:579
Page 7 of 21
Table 3 List of the preservation measures utilized to rank
identified modules
Sl No.
Preservation measures
Type
1
meanAdj
Density
2
meanMAR
Density
3
medianRankDensity
Density
4
propVarExplained
Density
5
corr.kIM
Connectivity
6
corr.kME
Connectivity
7
corr.kMEall
Connectivity
8
corr.corr
Connectivity
9
corr.MAR
Connectivity
10
medianRankConnectivity
Connectivity
11
meanKME
Density + Connectivity
12
meanCorr
Density + Connectivity
section [“Module preservation measures”], we have briefly
described about those measures.
The ranking measures adopted here are associated
with various density, connectivity and eigengene based
statistics which are elongation of different fundamental
measures that operates on nodes. We have utlized the following fundamental measures: Density, Maximum Adjacency Ratio, Module Membership (kME), Clustering
Coefficient and Intramodular Connectivity (kIM).
• Density [31, 36]: Module density within a network represents the average connection (association) strengths
among every couple of nodes in that module. Here, the
connection strength is defined as the correlation coefficient among the expression profiles of every couple
of genes (or nodes) within that module. Thus, the density of a module represents the mean adjacency and is
expressed as:
density
(p)
= mean(vectorizeMatrix(Adj
(p)
)), (6)
where Adj(p) represents the adjacency matrix for all
nodes present within the module p. Intuitively, higher
module-density indicates a module with strongly
interconnected nodes.
• Maximum Adjacency Ratio (MAR) [36]: With reference to a weighted network the MAR of a node u is
expressed as
MARu =
u=v w(u, v)
2
u=v w(u, v)
,
(7)
where w(u, v) corresponds to the connection strength
associated with the nodes u and v.
MAR is characterized exclusively for weighted networks, since it is constant (= 1) in an unweighted
network. The MAR statistics can easily employed in
connection with a module by computing the average
MAR score of every node present in the module.
To compare the MAR scores among two independent networks, we have computed the mean MAR
scores of all the modules of those two networks and
obtained their correlation scores (corr.MAR). The
MAR measure may also be exploited for discovering
whether a hub gene accomplishes mild associations
with a large number of genes or apparently firm associations with comparatively small number of genes.
• Module Membership (kME) [27]: There exists a
plenty of module discovery techniques that results
in co-expressed network modules comprising of
significantly correlated nodes. Such modules can be
summarized with the first principal component of the
associated module expression matrix which is designated as the module eigengene (ME) [18]. Module
Membership (kME) of a gene (or node) u with respect
to module p represents the correlation among the
expression profile of the node and the expression profile of the module eigengene. In an abstract view it
specifies how adjacent the node u is to the module p
and its values ranges within [ −1, 1].
p
kMEu = corr(expru , MEp ),
(8)
where, expru denotes the expression profile of gene (or
node) u and MEp represents the module eigengene for
the module p.
• Clustering Coefficient [28]: Within a network the clustering coefficient of a node is a measure of the degree
of interconnectedness with its adjacent nodes. Let eu
be the total number of direct links (edges) with the
nodes associated with node u and nu be the number
of nodes directly connected to node u. Then the clustering coefficient (CC) for a node u is computed as:
2eu
.
(9)
nu (nu − 1)
By definition, the clustering coefficient of a node
ranges from 0 to 1. The average clustering coefficient
can be utilized to assess whether the network exhibits
a modular organization [32]. Among numerous alternatives available, in this article we have utilized the
weighted generalization of clustering coefficient for
co-expression network established in [28].
Here the CC measure quantifies the magnitude of
connection strength observed in the neighborhood of
a node (u ) and expressed as:
CCu =
CCWu =
z=v,u w(u, v)w(v, z)w(z, u)
,
2
2
v=u w(u, v)) −
v=u w(u, v)
v=u
(
(10)
where w(p, q) is the weight of each edge coming out
from node p. Here, the connection strength of the
Ray et al. BMC Bioinformatics (2017) 18:579
Page 8 of 21
edges (weights) are normalized to the highest weight
in the network. Average clustering coefficient of a
module within a network has been computed by finding the mean weighted clustering coefficient of all
nodes in that module.
• Intramodular Connectivity (kIM) [27]: The intramodular connectivity of a node represents the sum of
connection strengths of that node to every other nodes
in a specified module. Thus if a node is strongly connected with all other nodes in a module then it has a
high intramodular connectivity. In this article, we have
utilized this measure to obtain the similarity scores
for alikeness of hub nodes within two independent
networks.
The intramodular connectivity for a node u in a
module p is defined as
p
w(u, v)p .
kIMu =
(11)
v∈Mp ,v=u
expressed as:
[t](p) 2
propVarExplained = meanu∈Mp kMEu
(15)
[t](p)
kMEu
where,
indicates module membership score
of node u in the module p in the network t.
5. corr.kIM: It represents the association among
intramodular connectivities of every nodes inside a
module between a pair of networks. It is expressed by:
corr.kIM = corr(kIM[r](p) , kIM[t](p) ),
[r](p)
Following is the brief description about the 12 different
preservation measures that have been employed in our
present work.
1. meanAdj: meanAdj for a module provides the density
of that module. Intuitively, a module p in a reference
network is said to be conserved provided the module
has a satisfactory density (adjacency) inside the test
network. It is expressed as:
p
meanAdj = mean(vectorizeMatrix(Adj )). (12)
2. meanMAR: meanMAR of a module provides the
mean of the maximum adjacency ratios (MARs) of
every node (u ) inside the module (p ) and is expressed
as:
p
where, MARu =
2
u=v w(u, v)
.
(13)
3. medianRankDensity: This represents the median rank
of a module p based on all density statistics measures.
It is expressed as:
medianRankDensity =
p
mediana DensityStatistics ranka ,
(14)
p
[t](p)
, kMEu
where, ranka represents rank of a module p based on
a density statistics measure a.
4. propVarExplained: propVarExplained (‘proportion of
variance explained’) is computed by finding the mean
from the square of the module membership (kME)
scores of every nodes inside a module (p ). It is
,
(17)
[k](p)
represents the module membership
where, kMEu
of node u in the module p in network k.
7. corr.kMEall: corr.kMEall of a module, signifies the
association among the module membership (kME)
scores of every nodes between a pair of networks. It is
expressed as:
[r](p)
corr.kMEall = corr(kMEu
[t](p)
, kMEu
),
(18)
[k](p)
indicates the module membership
where, kMEu
score of a node u inside the module p in network k.
8. corr.corr: It represents the correlation between connectivity patterns inside a module (p ) among two
networks. It is expressed as:
corr.corr(p) = corr vectorizeMatrix(C [r](p) ,
mean MARu ,
u=v w(u, v)
(16)
where, kIM[k](p) represents the intramodular connectivity of module p in network k.
6. corr.kME: corr.kME for a module indicates the association among the module membership (kME) scores
of every node inside the module between a pair of
networks. It is expressed as:
corr.kME = corru∈Mp kMEu
Module preservation measures
,
vectorizeMatrix(C [t](p) )),
(19)
where, C [k](p) represents the correlation matrix (C =
[ cuv ]) for all pair of nodes (u, v ) within the module p
in the network k whose elements are expressed as:
cuv = corr(expru , exprv ).
(20)
9. corr.MAR: It signifies the association among maximum adjacency ratios (MARs) of every node inside a
module among a pair of networks. It is expressed as:
corr.MAR(p) = corr(MAR[r](p) , MAR[t](p) ), (21)
where, MAR[k](p) indicates the maximum adjacency
ratio (MAR) of the module p in the network k.
10. medianRankConnectivity: This represents the
median rank of a module p based on all connectivity
Ray et al. BMC Bioinformatics (2017) 18:579
Page 9 of 21
statistics measures. It is expressed as:
composite Z statistics Zdensity , Zconnectivity and Zsummary as
given below [27]:
medianRankConnectivity(p)
= mediana
p
ConnectivityStatistics ranka ,
Zdensity = median(ZmeanCorr , ZmeanAdj , ZpropVarExpl , ZmeankME ).
(22)
p
ranka
where,
represents rank of a module p based on
a connectivity statistics measure a.
11. meanKME (or meanSignAwareKME): Mean signaware module membership (meanKME) of a module
p within a test network (t ) is determined by computing the average of the module membership (kME)
scores of all nodes in the module inside the test network multiplied by the corresponding score on the
reference network. It can be expressed by:
[r](p)
meanKME[t](p) = meanu∈Mp sign kMEu
[t](p)
kMEu
,
(23)
[k](p)
kMEu
indicates the module membership
where,
(kME) score of the node u within the module p in the
network k.
12. meanCorr (or meanSignAwareCorrDat): Mean signaware correlation of a module p within a test network
(t ) is defined as the average correlation values of every
pair of nodes in that test network multiplied by sign of
the corresponding scores on the reference network. It
is expressed as:
[r](p)
meanCorr[t](p) = mean vectorizeMatrix sign cuv
[t](p)
cuv
,
(24)
[k](p)
cuv
indicates the correlation score among
where,
the expression profiles of genes (or nodes) u and v
inside the module p in the network k which has been
expressed in the Eq. [20].
The outcomes of the module preservation measures are
generally dependent on several factors like the size of the
network, size of the modules, number of measurements,
etc. Hence, to assess whether a preservation statistics
is significant or not, we have performed permutation
tests. The module labels were randomly permuted in the
test network and results of preservation statistics were
obtained repeatedly for thirty times. Then, we have computed the mean (μi ) and standard deviation (σi ) of the
permuted values for each statistics (i) and approximation
of that statistics (Zi ) was obtained [27]:
Obsi − μi
σi
Zconnectivity = median(Zcorr.kIM , Zcorr.kME , Zcorr.corr ).
Zdensity + Zconnectivity
Zsummary =
.
2
(27)
(28)
Rank aggregation
Based on the values of the 12 preservation measures listed
in Table 3, all the identified modules in the reference
network were assigned 12 different ranks which signifies their preservation patterns in comparison to a test
network.
Then, we have employed the rank aggregation technique
proposed in [29] to obtain an optimum consolidated rank
for each of the identified modules. This weighted rank
aggregation method utilizes Monte Carlo cross-entropy
approach that optimizes a distance criterion to combine the 12 different ranks of an identified co-expressed
preserved module in a reference network based on 12
different preservation measures.
Low ranks of a module signify that the module is highly
preserved inside the test network whereas high rank indicates its preservation characteristics is low in the test
network.
Results and discussion
This section provides the outcomes of our analysis to
reveal the intramodular and topological changes in the
modular architecture in each pair of brain regions perturbed with Alzheimer’s disease.
Identification of co-expressed modules
Evaluating significance of observed statistics
Zi =
(26)
(25)
where, Obsi denotes the observed value for the statistics i.
Moreover, all of the density and connectivity based
preservation measures were summarized using three
We have identified co-expressed modules within the
gene co-expression networks for each brain region using
gene expression data of differentially expressed intersection genes with all other brain regions. Here, we have
employed the dissimilarity measure expressed in [Eq. 4]
with average linkage hierarchical clustering algorithm to
detect such co-expressed modules. All the genes within
the identified modules have been assigned same color
code. Minimum module size we have considered in this
work is 30. The genes those are allotted to none of the
co-expressed modules are labelled in grey color. Figure 4
shows the hierarchical clustering dendrogram for gene
co-expression network of EC brain region using the differentially expressed intersection genes with HIP region.
From Table 4, it can be observed that the ‘brown’ module consists of 134 genes and it is associated with the GO
term “microtubule cytoskeleton organization” (p-Value
Ray et al. BMC Bioinformatics (2017) 18:579
Page 10 of 21
Fig. 4 Hierarchical clustering dendrogram for gene co-expression network of EC brain region using the differentially expressed intersection genes
with HIP region
of 0.0092) and “Sphingolipid signaling” KEGG pathway
(p-Value = 0.008). It is established in different literatures that cytoskeleton is progressively disrupted in
the Alzheimer’s disease [37, 38]. Major component of
cytoskeleton is microtubules which is regarded as critical
structure for neuronal morphology. In AD affected neurons breakdown of microtubules is also an well established
phenomenon [38].
Sphingolipids play an important roles in signal transduction. In [39], it is reported that the perturbation
of “sphingomyelin metabolism” is the main event in
neurons degeneration that occurs in AD. Similarly, the
‘black’ module contains of 97 genes and it is associated with the GO term “membrane depolarization”
(p-Value of 0.0051) and “Estrogen signaling” KEGG pathway (p-Value = 0.001). By and large, most of the identified
modules are significantly enriched with known and relevant gene ontology terms and associated with KEGG
pathways.
Preserved modules in each pair of regions
After obtaining module preservation statistics for each
module, we have analyzed the preservation and perturbation structure of co-expression pattern of these modules. In particular, we have assumed coexpression network
resulting from EC or HIP regions as reference dataset
and the co-expression network of other regions as test
datasets. For example, at a time we have computed the
preservation statistics of co-expression modules belonging to one among the EC or HIP regions as reference
dataset while the modules of one of the rest five other
regions as test dataset. The aim is to study the preser-
vation pattern of co-expression modules of EC and HIP
regions in other affected brain regions. So, we have computed the preservation statistics of the co-expression
modules for the following pair of regions, EC-HIP, EC-PC,
EC-SFG, EC-VCX and EC-MTG by taking EC region as
reference and HIP-EC, HIP-PC, HIP-SFG, HIP-VCX and
HIP-MTG by taking HIP region as reference. In Fig. 5a
and b, we have shown the Zsummary values of all the coexpression modules with module size for EC and HIP
regions, respectively. Each row of the Fig. 5 represents
scatter plot of Zsummary values with the module size for
each pair of regions. Following the convention of [27]
the value of Zsummary higher than ten or less than two
generally represent preserved modules or non-preserved
module, respectively, whereas the value within 2 to 10
represents moderately preserved module. We have displayed the Zsummary values with module size in three
columns in Fig. 5. Column 1 represents moderately preserved module, while column 2 and column 3 represent
non-preserved and preserved modules of each region pair
by considering EC as reference dataset. It emerges from
the analysis that the number of strongly preserved module for EC-MTG region (26 out of 64 : 40%) is more than
the other pair of regions (for EC-HIP: 13 out of 62 : 21%,
EC-PC : 10 out of 79 : 12.65%, EC-SFG : 16 out of 49 :
32.65%, and EC-VCX: 20 out of 52 : 38.46%)). For coexpression modules of HIP region, it can also be seen that
for HIP-MTG region number of strongly preserved module is higher (19 out of 31) than the other pair of regions:
for HIP-EC : 15 out of 40, for HIP-PC : 28 out of 60
for HIP-SFG : 11 out of 24, and for HIP-VCX : 15 out
of 25.
Salmon4
Sienna3
Skyblue
Thistle2
Yellowgreen
18
19
20
Lightpink4
15
17
Lavenderblush3
14
16
Honeydew1
13
8
Darkgreen
Ivory
7
Brown4
Darkolivegreen
6
12
Darkmagenta
5
11
Brown
4
Lightsteelblue1
Blue
3
Royalblue
Black
2
10
Bisque4
1
9
Module name
Antiquewhite4
Sl No
59
57
52
54
60
53
61
56
58
55
6
1
2
7
5
4
8
3
10
9
Aggregated rank
56
43
63
57
41
36
32
32
74
48
77
54
52
58
57
134
134
97
47
32
Module size
Positive regulation of apoptotic process
Regulation of autophagosome assembly
Protein transport
Adult walking behavior
Sphingolipid metabolic process
Skeletal muscle acetylcholine-gated channel
clustering
Mitochondrial ATP synthesis coupled proton
transport
Termination of RNA polymerase II transcription
Negative regulation of transcription: DNAtemplated
Positive regulation of apoptotic process
Transport
Mucosal immune response
Cell migration
Negative regulation of mitochondrial membrane potential
Positive regulation of GTPase activity
Microtubule cytoskeleton organization
Protein stabilization
Membrane depolarization
Phosphatidic acid biosynthetic process
Positive regulation of organ growth
GO term
Table 4 Significant GO Terms and KEGG Pathways for EC-HIP regions pair
GO ID
GO:0043065
GO:2000785
GO:0015031
GO:0007628
GO:0006665
GO:0071340
GO:0042776
GO:0006369
GO:0045892
GO:0043065
GO:0006810
GO:0002385
GO:0016477
GO:0010917
GO:0043547
GO:0000226
GO:0050821
GO:0051899
GO:0006654
GO:0046622
p-Value
4.40E-03
2.80E-02
1.10E-04
7.80E-02
2.70E-02
1.30E-02
2.70E-02
7.70E-02
5.00E-02
2.30E-02
3.40E-03
1.00E-02
5.20E-02
8.30E-03
9.10E-04
9.20E-03
8.70E-03
5.10E-03
5.50E-02
1.60E-02
Pathway
Insulin resistance
Not found
Not found
Not found
Proximal tubule bicarbonate reclamation
Fatty acid degradation
Gastric acid secretion
Not found
Not found
Not found
Not found
Measles
Not found
Not found
Spliceosome
Sphingolipid signaling pathway
Oxytocin signaling pathway
Estrogen signaling pathway
Fat digestion and absorption
Oxidative phosphorylation
p-Value
6.40E-03
NA
NA
NA
6.40E-02
8.60E-02
8.10E-02
NA
NA
NA
NA
6.10E-02
NA
NA
7.20E-02
8.00E-03
5.70E-04
1.00E-03
6.60E-02
2.50E-02
Ray et al. BMC Bioinformatics (2017) 18:579
Page 11 of 21
Ray et al. BMC Bioinformatics (2017) 18:579
Page 12 of 21
a
b
Fig. 5 Figure shows plots of Zsummary with module size of co-expression modules for each pair of brain region. a EC region as reference data. b HIP
region as reference data. First column shows the modules having Zsummary value within 2 to 10, while second third columns shows the scatter plot
of modules having Zsummary values less than 2 and greater than 10 respectively
seen from the Fig. 6b that module ‘blue’ and ‘steelblue’
achieve Zsummary value higher than other. The Zsummary ,
Zconnectivity and Zdensity of preserved modules (Zsummary
value 10) for HIP-EC and HIP-MTG regions pairs are
provided in Additional file 1: Figure S1.
We have also compared the module preservation statistic MedianRank [27] of all co-expressed modules for each
pair of regions taking EC and HIP as references. Z statistics generally depends on the module size, and in our
case, the obtained co-expression modules are of different
For more detail investigation, we have generated a bar
diagram in the Fig. 6 showing the values of Zsummary ,
Zconnectivity and Zdensity of preserved modules (Zsummary
value ≥ 10) of HIP and MTG region taking EC region as
reference. It can be seen from the Fig. 6a that ‘white’ and
‘red’ module have higher Zsummary value thereby treated
as the most preserved module between two regions EC
and HIP. For MTG region 25 modules have Zsummary
value more than 10. Figure 6b shows the bar plot for
MTG region taking EC as reference region. It can be
a
b
Fig. 6 Bar plot showing Zdensity , Zconnectivity and Zsummary values of co-expression modules having Zsummary greater than ten. Panel (a) shows the
results for modules in HIP region and panel (b) shows the same for MTG region. Both results are calculated by taking EC region as reference
Ray et al. BMC Bioinformatics (2017) 18:579
size, so it is better to focus on composite preservation
statistics MedianRank which is defined as follows:
MedianRank =
medianRankDensity + medianRankConnectivity
.
2
(29)
In Fig. 7, we have shown a scatter plot for the MedianRank values of all the modules obtained from each pair
of regions by taking EC and HIP regions as reference
datasets. From this figure one can see that for regions pair
EC-SFG, MedianRanks of modules are lower than other
pairs of regions. Number of modules having MedianRank
less than 10, taking EC region as reference is as follows:
for EC-HIP 10 out of 61 modules (16.4%), for EC-PC 8
out of 80 (10%), for EC-VCX 10 out of 53 (18.88%), for
EC-SFG 11 out of 50 (22%) and for EC-MTG 10 out of
65 (15.38%). Number of modules having MedianRank less
than 10 taking HIP region as follows: for HIP-EC 10 out
0f 40, for HIP-PC 9 out of 60, for HIP-SFG 9 out of 24,
HIP-VCX 9 out of 25, and for HIP-MTG 9 out of 31.
As low value of MedianRank represents preserved module, so it is observed from the figure that the most of the
co-expression modules of EC region are more preserved
in SFG than other regions, while very few of them are
preserved in PC region. In Fig. 8a, we have shown a scatter plot of modules having low MedianRank with module
size. It can be seen from the figure that although for ECMTG 15.38% modules have MedianRank less than ten,
but three modules ‘red’ (MedianRank = 2), ‘honeydew1’
(MedianRank = 3), and ‘darkolivergreen’ (MedianRank =
3) are showing strong preservation characteristic. On the
contrary, for region-pair EC-SFG, although the most of
the modules have low MedianRanks value, but only two of
them (purple and turquoise) have MedianRank less than
a
Page 13 of 21
three. Similarly we can see from Fig. 8b that for HIP-SFG
(37.5%) modules have MedianRank less than ten.
We have performed a principal component analysis
(PCA) on the expression data of DEGs in EC and HIP
regions. The analysis is performed to know whether the
overall expression of genes in the modules is correlated
with the principal components of the DEGs expression
data. We have computed the Pearson correlation among
the first three principal components with the eignegenes
of the identified modules in the EC region. The results
are shown as a heatmap in Fig. 9 which represents the
correlation between each pair of modules’ eigengenes and
the first three principal components. It can be noticed
that the modules showing high correlation with first principal component are also correlated with each other.
For example ‘darkolivergreen’, ‘lightsteenblue1’, ‘ivory’ and
‘royalblue’ showing high correlation among their eigengenes as well as high correlation with the first principal
component.
GO and pathway analysis of preserved and non-preserved
modules
To discover the biological significance of the preserved
modules we have performed gene ontology (GO) and
pathway based analysis. For computation convenience we
have restricted our analysis for the most preserved and the
most perturbed co-expressed modules. We have collected
GO terms and KEGG pathways which are interrelated
with the top ten ranked modules (the most preserved) and
last ten ranked modules (the most perturbed) in the sorted
ranked list. We have exploited the “Database for Annotation, Visualization and Integrated Discovery (DAVID)”
[40] tool for performing this analysis. Table 5 shows the
most significant GO terms and the significant KEGG
pathway which are linked with the modules of EC-MTG
regions pair. Table 4 shows the same for EC-HIP regions
b
Fig. 7 Figure shows plots of MedianRank values with module size of co-expression modules for each pair of brain region. a EC region as reference
data. b HIP region as reference data. Each row in the figure corresponds to five other regions while taking either EC or HIP region as reference at a time
Ray et al. BMC Bioinformatics (2017) 18:579
a
Page 14 of 21
b
Fig. 8 Figure shows scatter plots of MedianRank vs module size of co-expressed modules having MedianRank value less than 10. a EC region as
reference data. b HIP region as reference data. Each panel shows the scatter plot of the modules identified in five other brain regions taking either
EC and HIP regions as reference at a time. Here the modules with lower MedianRank are indicated with bigger filled circles
pair. The second column of these table shows the aggregated ranks of the modules. Column 5, 6 and 7 represents
the most significant GO terms, GO identifiers and the
associated p-Value, respectively. Column 8 and 9 shows
the associated pathways and corresponding p-value. It can
be seen from Table 5 that the most of the modules are
enriched with some pathways of neuro-degenerative disorders like ‘Parkinson’s disease’ and ‘Alzheimer’s disease’.
It can be noted that for EC-MTG region pair, pathway
enrichment is not found in four modules (module ‘coral1’,
Ray et al. BMC Bioinformatics (2017) 18:579
Page 15 of 21
Fig. 9 Figure shows the Heatmap of the correlation matrix formed among the eigengenes of top ranked ten modules and the first three principal
components
‘ivory’, ‘navajowhite2’, and ‘brown4’) among the top ten
aggregated ranked modules. However, for EC-HIP region
pair top ranked modules are more enriched with pathway of neuro-degenerative disorder than the last ranked
modules, shown in Table 4. It can be also noted that
p-value associated with the GO-terms and pathways are
less for top ranked modules than the 10 bottom ranked
modules. Thus, the following analysis have been performed to investigate whether the aggregated ranks are
incompatible with the functional enrichment. We have
collected the p-values of GO enrichment for all the modules of EC-HIP and EC-MTG and plot those with aggregated ranks. In Fig. 10 the scatter diagram exhibits the
association between p-value and the aggregated ranks
of modules. It can be seen from the figure that top
ranked modules have p-value lower than the bottom
ranked modules.
Analysis of preservation using ranking of modules
We have compared the values of composite preservation
statistics Zsummary and MedianRank for analyzing preservation pattern of co-expressed modules obtained from
each pair of brain regions taking EC or HIP as references.
Here, strong preservation of modules is assumed by taking
Zsummary value greater than 10 or MedianRank value less
than 10. Thus, the higher value of Zsummary or lower value
of MedianRanks are not prioritize here, instead all the
modules having Zsummary (or MedianRank) value greater
than (or less than) some threshold are put into same
class. So, this analysis gives the overall preservation of
all modules for all pairs of regions. Thus, to analyze the
preservation in modular level, here, we have proposed
a rank aggregation based method which uses all preservation measures for detecting preserved modules. Here,
each module receives a rank for each preservation measure. So, all the modules for a regions pair get ranks
corresponding to all the preservation measures. By performing rank aggregation we aggregated all the ranks of
modules to obtain a optimal rank list. Modules getting
lower rank have higher preservation characteristics and
vice-versa. For ranking of modules we have used the 12
preservation measures which were described in Table 3.
In Figs. 11 and 12, we have shown the ranking results of
some co-expression modules for EC-HIP regions pair. In
Fig. 11 the ranking result of the modules having aggregated ranks less than ten are shown. Similarly, we have
also shown the ranking results of co-expression modules
having aggregated ranks greater than 51 in Fig. 12.
To have a overall look into the preservation patterns
of modules in each pair of regions, we have compared
aggregated ranks. For this, we have taken all the identified
modules in each pair of regions at a time, and assign ranks
to them using the 12 module preservation statistics mentioned in Table 3. To make an optimal list of ranks, we have
aggregated all the individual ranks similar to the process
described above. In Fig. 13, we have shown the box and
jitter plots of the aggregated ranks for EC (panel -a) and
HIP (panel-b) regions, separately. Taking EC as reference,
Darkgrey
Darkmagenta
Darkseagreen4
Greenyellow
Lightsteelblue1
Yellow
16
17
18
19
20
Antiquewhite4
11
15
Salmon
10
Cyan
Purple
9
14
Plum1
8
Blue
Paleturquoise
7
Brown4
Navajowhite2
6
13
Mediumorchid
5
12
Ivory
Lightcyan
2
4
Darkolivegreen
1
3
Module name
Coral1
Sl No
56
58
64
62
59
61
63
65
60
57
9
10
1
7
2
8
3
4
6
5
Aggregated rank
130
52
94
35
55
66
80
46
137
34
85
99
53
58
38
32
76
49
55
35
Module size
Protein localization to plasma membrane raft
Positive regulation of gene expression
Regulation of synaptic vesicle recycling
Glomerulus development
Antigen processing and presentation of exogenous peptide antigen
via MHC class I: TAP-dependent
Pyruvate biosynthetic process
Regulation of meiotic nuclear division
Cilium morphogenesis
Protein transport
ion transmembrane transport
Glycolytic process
Double-strand break repair via nonhomologous end joining
Dentate gyrus development
Positive regulation by host of viral
transcription
Response to peptide hormone
Cytoskeleton organization
Regulation of translational initiation
Not found
Cytoskeleton-dependent intracellular transport
Positive regulation of dendrite
extension
GO term
Table 5 Significant GO Terms and KEGG Pathways for EC-MTG regions pair
GO ID
GO:0044860
GO:0010628
GO:1903421
GO:0032835
GO:0002479
GO:0042866
GO:0040020
GO:0060271
GO:0015031
GO:0034220
GO:0006096
GO:0006303
GO:0021542
GO:0043923
GO:0043434
GO:0007010
GO:0006446
NA
GO:0030705
GO:1903861
p-Value
1.20E-02
2.60E-02
1.20E-02
1.30E-02
8.00E-03
1.60E-02
1.70E-02
2.60E-03
1.30E-02
3.90E-02
8.90E-05
1.50E-04
3.40E-02
3.30E-02
8.10E-02
1.50E-03
6.00E-03
NA
5.60E-04
3.10E-02
KEGG pathway
Endocytosis
Calcium signaling pathway
Alzheimer’s disease
SNARE interactions in vesicular
transport
Parkinson’s disease
Biosynthesis of amino acids
Ras signaling pathway
Not found
Peroxisome
Alzheimer’s disease
Metabolic pathways
Endocrine and other
factor-regulated calcium
reabsorption
Not found
Glyoxylate and dicarboxylate
metabolism
Not found
Dorso-ventral axis formation
GnRH signaling pathway
Not found
Alzheimer’s disease
Not found
p-Value
1.70E-02
1.20E-02
3.20E-02
7.60E-02
3.20E-02
2.50E-02
4.20E-02
NA
5.90E-02
4.20E-03
1.90E-04
2.50E-03
NA
6.10E-02
NA
3.50E-02
2.80E-02
NA
9.20E-05
NA
Ray et al. BMC Bioinformatics (2017) 18:579
Page 16 of 21
Ray et al. BMC Bioinformatics (2017) 18:579
Page 17 of 21
−log(p_val)
20
15
module
EC_HIP
EC_MTG
10
5
0
20
40
60
rank
Fig. 10 Figure shows the scatter plot between the − log(p-value) and aggregated ranks of identified modules in region pairs EC-HIP and EC-MTG.
Lower p-value indicates higher value of − log(p-value)
total 309 modules are ranked, while taking HIP as reference 185 modules are ranked. It is clear from the Fig. 13
that modules of regions VCX and SFG taking EC as reference region, have aggregated ranks lower than the other
regions. It can be also noted from this figure that the modules of VCX and SFG regions get lower aggregated ranks
while taking HIP as a reference region.
Topological insights into the preserved and perturbed
modules
The following experiment have been carried out to investigate whether there exists any topological characteristics that distinguishes preserved modules from the non
preserved ones. We have computed the “betweenness
centrality” and the “degree” of all the proteins belonging to each preserved and non preserved module. Degree
and betweenness centrality serve as important topological
property of a protein in a network [41]. High degree proteins are generally called ‘hub’ whereas proteins with high
betweenness centrality are called ‘bottlenecks’. Among
the top ten and last ten ranked modules, four modules
are selected in each category based on the higher correlation score among the betweenness centrality and the
degree of their constituent proteins. Figure 14 shows scatter plots between these two metric of the selected four
modules of preserved and non-preserved category. From
the figure, a clear correlation pattern can be seen in
preserved modules. For non preserved modules though
Fig. 11 Figure shows ranking results of top ten ranked co-expression modules.The modules are ranked using 12 measures shown in the right pane
of the figure
Ray et al. BMC Bioinformatics (2017) 18:579
Page 18 of 21
Fig. 12 Figure shows ranking results of last ten ranked co-expression modules having ranks higher than 51. The modules are ranked using 12
measures shown in the right pane of the figure
the correlation exists but not prominent as for preserved
one.
Conclusions
In this article, we have extensively studied the preservation patterns of co-expression networks for the six distinct
brain regions affected by Alzheimer’s disease (AD). For
every brain region “differentially expressed genes” (DEGs)
were computed using the AD affected microarray gene
expression data. We have obtained the common DE genes
for each pair of regions and constructed a pair of coexpression networks. The networks are then compared by
using preservation statistics first introduced in [27]. The
networks are partitioned into co-expression modules and
these are then compared with the preservation measures.
Twelve density and connectivity based measures are used
here to detect preservation pattern between co-expression
modules belonging to a pair of brain regions. We have also
assigned ranks to each module based on the preservation
a
measures and adopted a rank aggregation technique for
combining those ranks to obtain an aggregated rank list.
Low ranks of a module characterizes high preservation
characteristics and vice-versa.
The whole analysis is carried out for all pairs of brain
regions taking expression data of EC and HIP regions as
reference. It emerges from the results of module preservation statistics (Zsummary value) that number of strongly
preserved module for EC-MTG and HIP-MTG regions
are more than other pairs of regions. Moreover, for HIPSFG and HIP-VCX all the modules are either moderately
preserved (Zsummary value between 2 to 10) or strongly
preserved (Zsummary value less than 2). By considering the
MedianRank value, modules of EC-SFG region achieves
more preservation than other pairs of regions. However,
for EC-MTG regions pair more number of modules has
MedianRank value less than or equals to three. From
ranking results we also got preserved and non-preserved
modules for each pair of regions. A significant association
b
Fig. 13 Figure shows the box and jitter plots of the aggregated ranks of all modules identified in EC (provided in panel-a) and HIP region (provided
in panel-b)
Ray et al. BMC Bioinformatics (2017) 18:579
a
Page 19 of 21
b
Fig. 14 Figure shows the scatter plots of the “betweenness centrality” vs the “degree” of (a) 4–preserved and (b) 4–non-preserved modules for
EC-HIP region
Ray et al. BMC Bioinformatics (2017) 18:579
among the betweenness centrality and the degree of
the proteins in preserved modules have been observed
from the topological analysis of the preserved and nonpreserved modules. For example, in EC-HIP region,
preserved modules ‘antiquewhite4’, ‘ivory’, ‘brown’ and
‘royalblue’ show a firm association among the betweenness centrality and the degree of the proteins. On the other
hand for non-preserved modules like ‘thistle’, ‘sienna3’ and
‘salmon4’ the correlation is not so prominent. It reveals
that the proteins belonging to the preserved modules are
more prone to act as a ‘hub’ as well as ‘bottleneck’ within
the whole human PPI network.
Further analysis on the preserved and non-preserved
modules may facilitate to discover the exact progression
pattern of the Alzheimer’s disease. Comparing expression
data of six brain regions through different multivariate
analysis such as MANOVA may provide useful information to the preservation structure of the modules. Detailed
analysis of the expression data in all six brain regions
using MANOVA may yield new insights into the preservation pattern of the brain regions. Apart from this, to
know whether the genes within the top ranked modules
are indeed involved with Alzheimer’s disease one can perform some experimental validation. For example one can
choose to knockdown those genes to investigate whether
the particular genes are really involved in Alzheimer’s
disease. A proper investigation of the preserved modules of a pair of regions will yield some new insights
into the development of new therapeutics for Alzheimer’s
disease.
Additional file
Additional file 1: Figure: Bar plot showing Zdensity , Zconnectivity and
Zsummary values of co-expression modules having Zsummary greater than
ten. Panel (a) shows the results for modules in EC region and panel (b)
shows the same for MTG region. Both results are calculated by taking HIP
region as reference. (EPS 110 kb)
Abbreviations
DEG: Differentially expressed genes; EC: Entorhinal cortex; GEO: Gene
expression omnibus; GO: Gene ontology; HIP: Hippocampus; MTG: Middle
temporal gyrus; PC: Posterior cingulate cortex; PCA: Principal component
analysis; SFG: Superior frontal gyrus; TOM: Topological overlap matrix; VCX:
Primary visual cortex; WGCNA: Weighted gene co-expression network analysis
Acknowledgments
Not applicable.
Funding
There was no source of funding available for the present analysis.
Availability of data and materials
The datasets utilized in the current work is freely accessible in the “Gene
Expression Omnibus” (GEO) under the series accession number GSE5281. The
datasets produced throughout the analysis along with materials utilized in the
current study are accessible from the corresponding author on legitimate
request.
Page 20 of 21
Authors’ contributions
SR, MG and LK have mutually operate on the datasets, formulated the
methods and prepared the manuscript. AM offers constructive, scholarly ideas
and thoroughly amended the manuscript. All of the authors read and
approved the final manuscript.
Ethics approval and consent to participate
Not applicable.
Consent for publication
Not applicable.
Competing interests
The authors announce that they do not have any competing interests.
Publisher’s Note
Springer Nature remains neutral with regard to jurisdictional claims in
published maps and institutional affiliations.
Author details
1 Department of Computer Science and Engineering, Aliah University, West
Bengal, 700156 Kolkata, India. 2 Department of Computer Science and
Engineering, University of Kalyani, West Bengal, 741235 Kalyani, India.
Received: 15 March 2017 Accepted: 21 November 2017
References
1. Burns A, Iliffe S. Alzheimer’s disease. BMJ. 2009;338. doi:10.1136/bmj.b158.
/>2. World Health Organization. Dementia: Fact Sheet No. 362. 2017. WHO.
Available online at: />en/. Accessed 02 Mar 2017.
3. F´’orstl H, Kurz A. Clinical features of Alzheimer’s disease. Eur Arch
Psychiatry Clin Neurosci. 1999;249(6):288–90. doi:10.1007/s004060050101.
4. Frank EM. Effect of Alzheimer’s disease on communication function. J S C
Med Assoc. 1994;90(9):417–23.
5. Liang W, Dunckley T, Beach T, Grover A, Mastroeni D, Ramsey K, Caselli R,
Kukull W, McKeel D, Morris J, Hulette C, Schmechel D, Reiman E,
Rogers J, Stephan D. Altered neuronal gene expression in brain regions
differentially affected by Alzheimer’s disease: A reference data set. Physiol
Genomics. 2008;33(2):240–56. doi:10.1152/physiolgenomics.00242.2007.
6. Vogt BA, Crino PB, Vogt LJ. Reorganization of cingulate cortex in
Alzheimer’s disease: Neuron loss, neuritic plaques, and muscarinic
receptor binding. Cereb Cortex. 1992;2(6):526–35.
doi:10.1093/cercor/2.6.526. />526.full.pdf.
7. Valla J, Berndt JD, Gonzalez-Lima F. Energy hypometabolism in posterior
cingulate cortex of Alzheimer’s patients: Superficial laminar cytochrome
oxidase associated with disease duration. J Neurosci. 2001;21(13):
4923–930. />8. Braak H, Braak E. In: Jellinger K, Fazekas F, Windisch M, editors. Evolution
of neuronal changes in the course of Alzheimer’s disease. Vienna:
Springer; 1998. pp. 127–40.
9. Hock C, Heese K, Hulette C, Rosenberg C, Otten U. Region-specific
neurotrophin imbalances in Alzheimer disease: Decreased levels of
brain-derived neurotrophic factor and increased levels of nerve growth
factor in hippocampus and cortical areas. Arch Neurol. 2000;57(6):846–51.
doi:10.1001/archneur.57.6.846. /data/Journals/NEUR/13134/noc90083.
pdf.
10. Braak H, Braak E. Neuropathological stageing of Alzheimer-related
changes. Acta Neuropathol. 1991;82(4):239–59. doi:10.1007/BF00308809.
11. Braak H, Braak E, Bohl J. Staging of Alzheimer-related cortical destruction.
Eur Neurol. 1993;33(6):403–8.
12. Sekar S, McDonald J, Cuyugan L, Aldrich J, Kurdoglu A, Adkins J, Serrano G,
Beach TG, Craig DW, Valla J, Reiman EM, Liang WS. Alzheimer’s disease
is associated with altered expression of genes involved in immune
response and mitochondrial processes in astrocytes. Neurobiol Aging.
2015;36(2):583–91. doi:10.1016/j.neurobiolaging.2014.09.027.
Ray et al. BMC Bioinformatics (2017) 18:579
13. Ray M, Zhang W. Analysis of Alzheimer’s disease severity across brain
regions by topological analysis of gene co-expression networks. BMC Syst
Biol. 2010;4(1):136. doi:10.1186/1752-0509-4-136.
14. Ray S, Britschgi M, Herbert C, Takeda-Uchimura Y, Boxer A, Blennow K,
Friedman L, Galasko D, Jutel M, Karydas A, Kaye J, Leszek J, Miller B,
Minthon L, Quinn J, Rabinovici G, Robinson W, Sabbagh M, So Y,
Sparks D, Tabaton M, Tinklenberg J, Yesavage J, Tibshirani R,
Wyss-Coray T. Classification and prediction of clinical Alzheimer’s
diagnosis based on plasma signaling proteins. Nat Med. 2007;13(11):
1359–1362. doi:10.1038/nm1653.
15. Liu ZP, Wang Y, Zhang XS, Chen L. Identifying dysfunctional crosstalk of
pathways in various regions of Alzheimer’s disease brains. BMC Syst Biol.
2010;4(2):11. doi:10.1186/1752-0509-4-S2-S11.
16. Bertram L, McQueen MB, Mullin K, Blacker D, Tanzi RE. Systematic
meta-analyses of Alzheimer disease genetic association studies: the
alzgene database. Nat Publ Group. 2007;39(1):17–23. doi:10.1038/ng1934.
17. Puthiyedth N, Riveros C, Berretta R, Moscato P. Identification of
differentially expressed genes through integrated study of Alzheimer’s
disease affected brain regions. PLoS ONE. 2016;11(4):1–29.
doi:10.1371/journal.pone.0152342.
18. Langfelder P, Horvath S. Eigengene networks for studying the
relationships between co-expression modules. BMC Syst Biol. 2007;1(54).
doi:10.1186/1752-0509-1-54.
19. Oldham M, Horvath S, Geschwind H. Conservation and evolution of
gene coexpression networks in human and chimpanzee brains. Proc Natl
Acad Sci U S A. 2006;103:17973–8.
20. Stuart J, Segal E, Koller D, Kim S. A gene co-expression network for global
discovery of conserved genetic modules. Science. 2003;302(5643):249–55.
21. Carlson M, Zhang B, Fang Z, Mischel P, Horvath S, Nelson S. Gene
connectivity, function, and sequence conservation: predictions from
modular yeast co-expression networks. BMC Genomics. 2006;7(40).
doi:10.1186/1471-2164-7-40.
22. Ray S, Bandyopadhyay S. Discovering condition specific topological
pattern changes in coexpression network: an application to HIV-1
progression. IEEE/ACM Trans Comput Biol Bioinforma. 2015;11(4):
1086–1099.
23. Ray S, Hossain SMM, Khatun L. Discovering preservation pattern from
co-expression modules in progression of HIV-1 disease: An eigengene
based approach. In: 2016 IEEE International Conference on Advances in
Computing, Communications and Informatics, ICACCI 2016, Jaipur, India,
September 21-24, 2016. USA: IEEE. 2016. p. 814–20.
doi:10.1109/ICACCI.2016.7732146.
24. Hossain SMM, Ray S, Tannee TS, Mukhopadhyay A. Analyzing prognosis
characteristics of Hepatitis C using a biclustering based approach.
Procedia Comput Sci. 2017;115(Supplement C):282–9.
doi:10.1016/j.procs.2017.09.136.
25. Cai C, Langfelder P, Fuller T, Oldham M, Luo R, et al. Is human blood a
good surrogate for brain tissue in transcriptional studies? BMC Genomics.
2010;11(589). doi:10.1186/1471-2164-11-589.
26. Hossain SMM, Ray S, Mukhopadhyay A. Preservation affinity in consensus
modules among stages of HIV-1 progression. BMC Bioinformatics.
2017;18(1):181. doi:10.1186/s12859-017-1590-3.
27. Langfelder P, Luo R, Oldham M, Horvath S. Is my network module
preserved and reproducible? PLoS Comput Biol. 2011;7(1):1001057.
28. Zhang B, Horvath S. A general framework for weighted gene
co-expression network analysis. Stat Appl Genet Mol Biol. 2005;4:
1128–1172. doi:10.2202/1544-6115.1128.
29. Pihur V, Datta S, Datta S. Weighted rank aggregation of cluster validation
measures: a monte carlo cross-entropy approach. Bioinformatics.
2007;23(13):1607–15.
30. McKhann G, Drachman D, Folstein M, Katzman R, Price D, Stadlan E.
Clinical diagnosis of Alzheimer’s disease: Report of the nincds-adrda work
group under the auspices of department of health and human services
task force on alzheimer’s disease. Neurology. 1984;34(7):939–44.
31. Dong J, Horvath S. Understanding network concepts in modules. BMC
Syst Biol. 2007;1(1):24. doi:10.1186/1752-0509-1-24.
32. Ravasz E, Somera AL, Mongru DA, Oltvai ZN, Barabasi A. Hierarchical
organigation of modularity in metabolic networks. Science. 2001;297:
1551–1555.
Page 21 of 21
33. Li A, Horvath S. Network neighborhood analysis with the multi-node
topological overlap measure. Bioinformatics. 2006;23(2):222–31.
doi:10.1093/bioinformatics/btl581.
34. Yip AM, Horvath S. Gene network interconnectedness and the
generalized topological overlap measure. BMC Bioinformatics. 2007;8(22).
doi:10.1186/1471-2105-8-22.
35. Langfelder P, Zhang B, Horvath S. Defining clusters from a hierarchical
cluster tree: the dynamic tree cut package for R. Bioinformatics. 2008;24:
719–20.
36. Horvath S, Dong J. Geometric interpretation of gene coexpression
network analysis. PLoS Comput Biol. 2008;4(8):1000117.
37. Bamburg JR, Bloom GS. Cytoskeletal pathologies of Alzheimer disease.
Cytoskeleton. 2009;66(8):635–49.
38. Alonso AdC, Zaidi T, Grundke-Iqbal I, Iqbal K. Role of abnormally
phosphorylated tau in the breakdown of microtubules in Alzheimer
disease. Proc Natl Acad Sci. 1994;91(12):5562–6.
39. Haughey NJ, Bandaru VV, Bae M, Mattson MP. Roles for dysfunctional
sphingolipid metabolism in Alzheimer’s disease neuropathogenesis.
Biochim Biophys Acta (BBA)-Mol Cell Biol Lipids. 2010;1801(8):878–86.
40. Huang D, Sherman B, Tan Q, Collins J, Alvord W, Roayaei J, Stephens R,
Baseler M, Lane H, Lempicki R. The david gene functional classification
tool: a novel biological module-centric algorithm to functionally analyze
large gene lists. Genome Biol. 2007;8(9):183.
41. Bandyopadhyay S, Ray S, Mukhopadhyay A, Maulik U. A review of in silico
approaches for analysis and prediction of HIV-1-human protein-protein
interactions. Brief Bioinform. 2014. doi:10.1093/bib/bbu041.
Submit your next manuscript to BioMed Central
and we will help you at every step:
• We accept pre-submission inquiries
• Our selector tool helps you to find the most relevant journal
• We provide round the clock customer support
• Convenient online submission
• Thorough peer review
• Inclusion in PubMed and all major indexing services
• Maximum visibility for your research
Submit your manuscript at
www.biomedcentral.com/submit