DictyExpress: A web-based platform for sequence data management and analytics in Dictyostelium and beyond
Bạn đang xem bản rút gọn của tài liệu. Xem và tải ngay bản đầy đủ của tài liệu tại đây (2.05 MB, 10 trang )
Stajdohar et al. BMC Bioinformatics (2017) 18:291
DOI 10.1186/s12859-017-1706-9
S O FT W A R E
Open Access
dictyExpress: a web-based platform for
sequence data management and analytics in
Dictyostelium and beyond
Miha Stajdohar1 , Rafael D. Rosengarten2*
and Blaz Zupan4,3
, Janez Kokosar1 , Luka Jeran1 , Domen Blenkus1 , Gad Shaulsky3
Abstract
Background: Dictyostelium discoideum, a soil-dwelling social amoeba, is a model for the study of numerous
biological processes. Research in the field has benefited mightily from the adoption of next-generation sequencing
for genomics and transcriptomics. Dictyostelium biologists now face the widespread challenges of analyzing and
exploring high dimensional data sets to generate hypotheses and discovering novel insights.
Results: We present dictyExpress (2.0), a web application designed for exploratory analysis of gene expression data,
as well as data from related experiments such as Chromatin Immunoprecipitation sequencing (ChIP-Seq). The
application features visualization modules that include time course expression profiles, clustering, gene ontology
enrichment analysis, differential expression analysis and comparison of experiments. All visualizations are interactive
and interconnected, such that the selection of genes in one module propagates instantly to visualizations in other
modules. dictyExpress currently stores the data from over 800 Dictyostelium experiments and is embedded within a
general-purpose software framework for management of next-generation sequencing data. dictyExpress allows users
to explore their data in a broader context by reciprocal linking with dictyBase—a repository of Dictyostelium genomic
data. In addition, we introduce a companion application called GenBoard, an intuitive graphic user interface for data
management and bioinformatics analysis.
Conclusions: dictyExpress and GenBoard enable broad adoption of next generation sequencing based inquiries by
the Dictyostelium research community. Labs without the means to undertake deep sequencing projects can mine the
data available to the public. The entire information flow, from raw sequence data to hypothesis testing, can be
accomplished in an efficient workspace. The software framework is generalizable and represents a useful approach for
any research community. To encourage more wide usage, the backend is open-source, available for extension and
further development by bioinformaticians and data scientists.
Keywords: Bioinformatics, Visual analytics, Platform, RNA-seq, ChIP-seq, Differential gene expression
Background
Over seventy five years ago, Dr. Kenneth Raper described
the awesome life history of Dictyostelium discoideum [1].
This social amoeba grows vegetatively while subsisting
on bacteria in the soil, until it exhausts the food supply. Starvation triggers a coordinated process of chemotaxis, aggregation and multicellular development and
*Correspondence:
Genialis Inc., 2726 Bissonnett Street, Suite 240-374, Houston,TX 77005, USA
Full list of author information is available at the end of the article
2
differentiation of tens of thousands of individual cells. Dictyostelium, over the decades, has become a genetic model
organism for myriad biological phenomena, including
multicellular development, kin recognition, bacterial discrimination and innate immunity [2].
Dictyostelium has also been at the leading edge of
genomics era research. The genome of D. discoideum was
among the first eukaryotes to be queued for (Sanger)
sequencing [3], and the developmental transcriptome was
explored in the early days of gene expression microarrays
© The Author(s). 2017 Open Access This article is distributed under the terms of the Creative Commons Attribution 4.0
International License ( which permits unrestricted use, distribution, and
reproduction in any medium, provided you give appropriate credit to the original author(s) and the source, provide a link to the
Creative Commons license, and indicate if changes were made. The Creative Commons Public Domain Dedication waiver
( applies to the data made available in this article, unless otherwise stated.
Stajdohar et al. BMC Bioinformatics (2017) 18:291
[4]. Since then, next-generation RNA-sequencing (RNAseq) has vastly increased the ease and resolution of transcriptome studies [5–7]. And now, researchers are using
ChIP-seq to define gene regulatory networks and shortread whole genome sequencing of chemical mutants to
dissect genetic pathways [8, 9].
These technological and experimental advances continue to drive the need for new and better approaches
to data management and analysis. The sheer volume of
NGS output requires data management that is stable and
scalable. Scientific best practices dictate that analyses
should be rigorous, reproducible and traceable. Software
solutions to these challenges typically are designed for
data scientists and computational experts. However, these
designs often fail to consider the needs, but also the limitations, of many non-computational life scientists who
generate and consume the data. To foster the most creative research and efficient collaborative environment, life
scientists should be engaged in the entire process; know
where their data resides and how it has been processed;
and be empowered to explore their data themselves, to ask
questions and test hypotheses as they arise.
In collaboration with the Dictyostelium group at Baylor College of Medicine, University of Ljubljana developed
the original dictyExpress (1.0), a web application designed
for exploration of transcriptomics datasets [10]. dictyExpress (1.0) allowed users to select among experiments and
specify genes to analyze; visualize the expression time
courses of those genes; identify gene clusters; examine
pre-processed differential expression datasets; and perform Gene Ontology (GO)-term enrichment analysis.
The distinguishing feature of dictyExpress (1.0) was its
interactivity. Each visual analytics module was linked to
the others, such that selecting a gene or genes in one
module propagated to the others, triggering new analyses where necessary. For example, when the user selected
differentially expressed genes in the Volcano Plot, the temporal profiles of these genes appeared in the Time Course
module, and GO enrichment terms updated automatically. Gene selection was supported in all visualization
modules of dictyExpress, and in this way enabled a variety
of workflows and entry points to exploring the data.
The original dictyExpress was developed in Flash (client
side) and relied on an ad-hoc Python-based backend for
data access. Addition of new data was not supported for
the user and required manual changes of the database
on the server side. End users were precluded from developing new pipelines, as well as tracing the results of
bioinformatics analyses. Further, extending the platform
to include other species was complicated by inflexibility
on the server side.
In this paper we report dictyExpress (2.0), a reinvention of the original with an entirely new software
architecture and extended functionality (Fig. 1). From
Page 2 of 10
the original version [10] we retain the name, several data
presentation modalities and the concept of interactive
visual exploration. Everything else has changed. The new
dictyExpress is bundled with GenBoard, a data management and preprocessing web application. The entire suite
has been rewritten in JavaScript, HTML5 and CSS3 on
the client side and a high-level Python web framework
(Django, version 1.8.6, />; PostgreSQL, version
9.4.11, https://
www.postgresql.org; and MongoDB, version 2.4.8, https://
github.com/mongodb/mongo,
godb.
com) and in-house data flow engine on the server side.
The user may now upload raw next-generation sequencing data, trigger the computational pipeline for mapping,
estimation of transcript abundance and computation of
differential gene expressions, and then use dictyExpress
to explore and share the results. Once published, or upon
the user’s preferences, results may be marked as public
and immediately made available to the general audience.
The new dictyExpress has been adopted as a tool of
choice to analyze gene expression data among many
prominent labs in the Dictyostelium community. As of
this submission, the web app has been viewed by over
3700 unique visitors and stores the data from over 800
Dictyostelium (and related) experiments. Access to dictyExpress is reciprocally linked to dictyBase, the home page
of the central repository for Dictyostelium genome data
and experimental resources (). Every
individual gene details page at dictyBase includes a link to
dictyExpress, facilitating access to expression profiles, and
each gene selection in dictyExpress is linked to the corresponding page in dictyBase. Below, we provide essential
details of our implementation framework and describe
the functionality of the new dictyExpress. We pay particular attention to the interactive data analysis, and how
this feature promotes exploration, discovery and insight
generation. We also discuss how the framework could be
extended to support other organisms, projects and data
types, some of which is already underway.
Implementation
The dictyExpress web application is part of a larger data
analysis software framework (Fig. 2). The backend section
of the framework manages the data and executes the analysis pipelines. Data are stored on a file server (raw reads,
genomes, ontologies, expressions), MongoDB database
(data annotations, links to server files, parameters of analysis pipelines) and PostgreSQL database (data on users
and groups, access privileges). Access to the data and
analysis pipelines is managed through RESTful API of
the Django application framework. This accepts requests
from the clients, and schedules analytic tasks to workers. On the client (web browser) side, the framework
Stajdohar et al. BMC Bioinformatics (2017) 18:291
Page 3 of 10
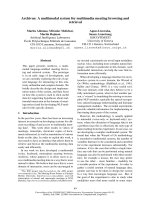
Fig. 1 The landing page of the dictyExpress web application invites public and subscribed users. From the URL (dictyExpress.org), this public page
provides access to published NGS data
Stajdohar et al. BMC Bioinformatics (2017) 18:291
Page 4 of 10
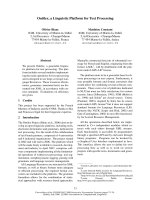
Fig. 2 The software behind dictyExpress and GenBoard incorporates a state-of-the art technology stack in a modular framework. The blue boxes
indicate the user interface layer, with web applications running in JavaScript, and a Python API for programmatic access. The green boxes represent
the data layer, including the dataflow engine, RESTful API and libraries of bioinformatics tools and pipelines. Beneath these sections are unshaded
services layers, including file sharing, database and server systems, and workload managers. The vertical pink column represents the glue that
connects the various layers and facilitates the seamless interaction between technologies
includes two applications: GenBoard for data and pipeline
management, and dictyExpress for interactive analyses.
Both GenBoard and dictyExpress are implemented in
JavaScript, HTML5 and CSS3, and make use of the
following JavaScript libraries: AngularJS, version 1.2.28,
( Bootstrap, version 3.2.0, (http://
getbootstrap.com/); c3, version 0.4.10, ( />d3, version 3.5.5, ( and Flot, version
0.8.3, ( />We developed an asynchronous data management platform to trigger different analysis tasks that may depend on
results of prior processing steps. The dataflow engine supports defining analysis tasks and dependencies, parallel
execution, and status reporting that is used for monitoring on the client side. The GenBoard application is meant
to serve data owners and curators as a user interface for
the dataflow engine. GenBoard has a familiar dashboardlike layout for data upload, annotation, analysis process
automation and monitoring. Meanwhile, the dictyExpress
application is responsible for the presentation of results,
and serves as the entry point for visualization and exploration. dictyExpress visualizations rely on a chassis of
three external libraries—c3, d3, and Flot—which have
been extended substantially with interactive capabilities.
Our aim was to make all visualization modules interactive
and interconnected, such that a user can click a line on a
line graph, a branch in a dendrogram, or a dot on a scatter
plot, and in this way select the underlying data point. The
selection is instantly propagated to all the other modules.
Overall, the implementation codebase includes about
20,000 lines of JavaScript and 30,000 lines of Python. The
dataflow and bioinformatics components of the project
are open source and available at GitHub (https://github.
com/genialis/resolwe).
Results and discussion
A new software framework
The redesign and ground-up recoding of the dictyExpress web-application improved the software in numerous
ways. From the end-user’s perspective, the interactive
data visualizations offer more features and interactivity
than before. Thus users can explore many facets of NGSbased gene expression (and ChIP-seq) data more easily. The companion Genboard application facilitates data
management and processing, providing tools to ensure
traceability and reproducibility of bioinformatics results.
Stajdohar et al. BMC Bioinformatics (2017) 18:291
Both applications sit atop a framework that enhances data
processing performance, and is extensible to virtually any
data analysis use-case (Fig. 2).
Let us illustrate the communication between components of the framework through an example. Consider
that a user uploads raw RNA-seq data (e.g. fastq files) with
the end goal of displaying gene expression time-course
profiles. The user would sign into GenBoard (Fig. 3),
upload the raw data and enter the relevant parameters
and metadata. The data are transferred to the server and
trigger the execution of quality control. Next, through the
GUI, the user instructs GenBoard to run mapping and
compute gene expression values. These computations run
on the server, and, if available, can be distributed over
parallel processors to speed-up the execution time. While
the computation takes place, GenBoard offers an interface to monitor the progress. Finally, the user can bundle
individual data objects, e.g. time-course reads files from
sequential biological samples. Upon completion of the
computation, the expression data become available on dictyExpress. Access is restricted by default to the author of
the data, who may then grant permissions to project partners or make the data public. Any analysis may be shared
via the URL.
Interactive and interconnected visualizations
dictyExpress consists of various visual analytics modules. Each module supports the selection of genes—
represented by points, lines, branches, etc.—depending
on the type of plot (Fig. 4). Gene selections propagate to
other modules, are revealed by highlights, and in some
cases, trigger new analyses on the fly. Such functionality is referred to as brushing-and-linking [11] and is
an essential component of tools for interactive visual
analysis. The current dictyExpress includes the following
modules:
• Experiment and Gene Selection. A table lists in
each row projects with available data. Each project is
comprised of a collection of read counts pertaining to
a particular experiment. For example, a project might
include multiple RNA-seq replicates of the wild type
strain AX4. The user engages with this module by
selecting a project (mouse click), then specifying one
or more gene(s) by free text or upload of a gene list
text file. Gene inputs, which benefit from
auto-complete suggestions, then appear in all other
modules. This module also records the work history,
allows linking to specific genes in dictyBase and
facilitates data downloading.
• Expression Time Courses. In Dictyostelium
biology, researchers often explore the changes in
gene expression levels over developmental time. In
this module, a line graph displays profiles as
Page 5 of 10
normalized read count (y -axis) versus time (x -axis).
The x -axis scales automatically to accommodate the
experimental sampling regime. For studies of noncoding (nc)RNA, selection of these molecules initiates
a second line plot with an appropriately scaled y -axis
[7]. The user can select one or more genes by clicking
or dragging across the expression profile curves. Such
selections then propagate to all other modules,
highlighting data on the selected genes. The user may
also discover which genes are most similar to a
selected gene. The "Find Similar" pop-up menu
enables the user to choose among various methods
for scoring of distance between gene profiles.
Distances are calculated across the transcriptome in
real time, resulting in a table of similar genes that
may be appended to the visualization modules. Tool
tips provide gene-wise information when the user
hovers the mouse over any profile.
• Hierarchical Clustering. Genes are clustered based
on their expression profiles and the results are shown
in a dendrogram, with branches that terminate as
heatmaps to illustrate the level of gene expression at
different time points. Users may choose one of three
methods for distance scoring: Euclidean distance,
Pearson’s correlation or Spearman’s correlation, as
well as branch linkage criteria. This module allows
users to interpret the relative similarity of genes
within a gene set, and to select genes for further
examination by highlighting selected branches.
• Gene Ontology Enrichment. Genes included in the
Experiment and Gene Selection module are analyzed
for GO term enrichment. The results table includes
enrichment statistics and GO terminology. Users
may select any of the enriched terms to discover the
complete set of associated genes.
• Differential Expression. A Volcano Plot is a type of
a scatter plot that helps in identification of
diffferentially expressed genes. Fold change (FC) is
presented on the x-axis (log2 scale), while statistical
confidence, derived from the false discovery rate
(FDR) increases along the y-axis (− log10 FDR). Thus
the further any gene sits from zero, the larger the fold
change and greater the statistical confidence. The
datasets displayed in this module are selected and
computed in GenBoard, usually using baySeq [12]. By
default, the data available represents differential
expression between prespore and prestalk cells, and
users may toggle between D. discoideum and its
sister D. purpureum [5]. Genes from the Experiment
and Gene Selection module are highlighted in the
volcano plot. The user may click or draw a box
around any other data points to append to or replace
the gene selection. The volcano plot also supports
selection of genes from the plot.
Stajdohar et al. BMC Bioinformatics (2017) 18:291
Page 6 of 10
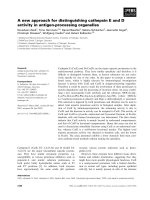
Fig. 3 Genboard is the data management graphic user interface. Here users can create a new project, upload raw and processed data files, specify
analysis algorithms and parameters, and link one step of the analysis process to another. a The user may search/filter among all existing projects
based on the project name or descriptive tags. From this page a user may also create a new project (b). c Within a chosen project, the users find all
of the data, input and output files associated with their bioinformatics analysis. These may be filtered by name, type, etc. Clicking on a file name in
the table navigates to a data details page (d), while clicking on an analysis link in the table navigates to that analysis process (e)
• Experiment Comparison. The time courses of one
or more genes may be compared across different
experiments. Users may choose additional
experiments to be plotted along with the row-wise
selection from the Experiment and Gene Selection
module. Time course profiles may be colored by gene
Stajdohar et al. BMC Bioinformatics (2017) 18:291
Page 7 of 10
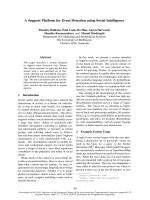
Fig. 4 Visual analytics modules of the dictyExpress web application. All modules are interactive and interconnected, such that selections and
perturbations in one module propagate to the others
Stajdohar et al. BMC Bioinformatics (2017) 18:291
Fig. 5 Example dictyExpress workflow. The workflow leads a user from a question to a novel insight and testable hypothesis
Page 8 of 10
Stajdohar et al. BMC Bioinformatics (2017) 18:291
or experiment. The same interactivity experienced in
the Expression Time Course module applies here.
• JBrowse. An implementation of the popular
JavaScript genome browser enables viewing gene
structure and sequence. JBrowse supports numerous
custom tracks, such as ChIP-seq counts [8],
non-coding RNA-seq read coverage [7], and WGS
variant analysis [9], depending on the experiment and
user permissions.
The JBrowse module and ncRNA sub-module are novel
additions relative to the original version of dictyExpress.
Besides the new software architecture and entirely rewritten code base, the level of interactivity has also been
augmented by including more clickable features and usercontrols via pop-up modules.
Available datasets
dictyExpress showcases published transcriptomics
datasets including developmental time courses of D.
discoideum (AX4) and D. purpureum [5]; AX4 development on nitrocellulose filters or during cyclic-AMP
pulsing in suspension [6]; and wild type AX2 compared
to various AX2 gtaC mutant strains [8]. Transcriptomics
datasets also extend to taxonomic comparisons between
P. pallidum, D. fasciculatum, and D. lacteum [13, 14].
Further, the application hosts the first comprehensive
catalog of ncRNA abundance during development [7] and
whole genome variant analysis of chemically mutagenized
strains [9]. These data will remain open to the community
for browsing and exploration. In the future, datasets will
become available as they are published.
Biological insights: real-life example workflow
The principal goal of dictyExpress is to provide biologists, who may not have advanced computational skills,
the ability to derive novel insights from high-throughput
data. We achieve this by providing the user a set of familiar, interconnected data visualization modules. A biologist
may start with a question about the expression pattern of
a favorite gene (or genes) in a certain dataset, and proceed
by visualizing the gene in other datasets, or by selecting
other genes in any of the other modules. Explorations of
this type may result in new hypotheses, many of which can
be tested in silico prior to wet-lab verification. The visualizations can be captured, saved and communicated to
colleagues by copying the URL of any given screen.
In the accompanying example (Fig. 5), we illustrate a
simple route to discovering additional candidate target
genes of the developmental regulator GtaC [8]. The analysis begins by confirming the GtaC-dependence of the
target gene csaA, then identifies other genes with similar temporal expression profiles, and finally examines the
behavior of one interesting candidate, abcG24, in various
Page 9 of 10
gtaC− mutant backgrounds. The example illustrates how
a researcher may progress from initial knowledge about
a gene of interest to a novel, testable hypothesis. Several
other examples can be viewed as video animations in the
supplemental material, or online at tube.
com/watch?v=9ayBgHdJMqY.
Conclusions
New experimental approaches continue to fuel Dictyostelium research, and many of these rely on highthroughput sequencing analysis [9, 15]. dictyExpress and
GenBoard enable the broad adoption of next generation
sequencing based inquiries. The reinvention of dictyExpress yielded an application that is easy to use, addresses
many common analysis tasks, and may be extended to
meet future needs. The inclusion of GenBoard offers biologists a solution for or data management and processing,
to complement the exploratory analyses of dictyExpress.
The entire information flow, from raw sequence data to
hypothesis testing and novel insights, can now be accomplished in an intuitive and efficient workspace.
The new system architecture and technology stack
are designed to evolve to keep pace with experimental,
sequencing, and bioinformatics advances. We envision
an ongoing process of improvement as technology and
users demand. Already we are eyeing updates such as
providing programmatic access via API for data management and bioinformatics support that will appeal to
data experts. We also plan to expand bioinformatics support and dataflow capabilities by leveraging open source
contributions.
Abbreviations
ChIP-seq: Chromatin immunoprecipitation sequencing; FC: Fold change; FDR:
False discovery rate; GO: Gene ontology; ncRNA: non-coding RNA; RNA-seq:
RNA sequencing; WGS: Whole genome sequencing
Acknowledgements
We would like to thank members of Biolab (University of Ljubljana) and of the
Shaulsky and Kuspa labs at Baylor College of Medicine for their advice,
feedback and critiques of the software and this manuscript. We are especially
indebted to Mariko Kurasawa and Balaji Santhanam for their helpful
suggestions and diligent testing of the software.
Funding
No specific funding was received for this study.
RDR, GS and BZ were supported from the grant from NIH (P01-HD39691). RDR
was supported in part by the Keck Center of the Gulf Coast Consortia, Training
Program in Biomedical Informatics, National Library of Medicine
(T15LM007093-21, PI Tony Gorry, Rice University). BZ’s support also came from
grants by ARRS (P2-0209, J2-5480), and European Commission
(Health-F5-2010-242038). These funding bodies played no role in the design
or conclusions of this study.
Availability of data and materials
The public URL for dictyExpress is: . A link to
GenBoard is found in the QuickApps link within dictyExpress. dictyExpress
provides access to publicly available data, which are cited within the app for
further reference. The data from those studies are also archived at the Gene
Expression Omnibus (GEO) as described in each dataset’s publication. Open
Stajdohar et al. BMC Bioinformatics (2017) 18:291
Page 10 of 10
source code for the back end dataflow engine and bioinformatics tools
described herein can be found at: />
6.
Authors’ contributions
MS, JK, LJ, and DB developed the software. BZ, GS and RDR helped in design of
the user interface. RDR and GS provided problem domain knowledge and the
testing data. MS, RDR, GS and BZ wrote and revised the manuscript. All authors
read and approved the final manuscript.
7.
Competing interests
Authors RDR, JK, LJ, DB and MS own shares in Genialis, Inc, and are employed
by it or its subsidiary, Genialis d.o.o. BZ serves as an advisor to, and owns shares
in, Genialis as well. The new dictyExpress was developed as part of a
commercial arrangement between Genialis d.o.o. and Baylor College of
Medicine. GS declares no competing interests.
9.
8.
10.
11.
Consent for publication
The work described herein does not involve humans or human data. Therefore
consent to publish is not applicable.
12.
Ethics approval and consent to participate
The work described herein does not involve humans, human data or animals.
Therefore ethics and consent approval is not applicable.
13.
Publisher’s Note
14.
Springer Nature remains neutral with regard to jurisdictional claims in
published maps and institutional affiliations.
Author details
1 Genialis d.o.o., Trzaska cesta 315, 1000 Ljubljana, Slovenia. 2 Genialis Inc., 2726
Bissonnett Street, Suite 240-374, Houston,TX 77005, USA. 3 Department of
Molecular and Human Genetics, Baylor College of Medicine, 1 Baylor Plaza,
Houston, TX 77030, USA. 4 Faculty of Computer and Information Science,
University of Ljubljana, Veˇcna pot 113, 1000 Ljubljana, Slovenia.
15.
Rosengarten RD, Santhanam B, Fuller D, Katoh-Kurasawa M, Loomis WF,
Zupan B, Shaulsky G. Leaps and lulls in the developmental transcriptome
of Dictyostelium discoideum. BMC Genomics. 2015;16:294.
Rosengarten RD, Santhanam B, Kokosar J, Shaulsky G. The long
non-coding RNA transcriptome of dictyostelium discoideum development.
G3: Genes | Genomes | Genetics. 2017;7(2):387–98.
Santhanam B, Cai H, Devreotes PN, Shaulsky G, Katoh-Kurasawa M. The
GATA transcription factor GtaC regulates early developmental gene
expression dynamics in Dictyostelium. Nat Commun. 2015;6:7551.
Li CL, Santhanam B, Webb AN, Zupan B, Shaulsky G. Gene discovery by
chemical mutagenesis and whole-genome sequencing in Dictyostelium.
Genome Res. 2016;26(9):1268–76.
Rot G, Parikh A, Curk T, Kuspa A, Shaulsky G, Zupan B. dictyExpress: a
Dictyostelium discoideum gene expression database with an explorative
data analysis web-based interface. BMC Bioinforma. 2009;10:265.
Ward M, Grinstein G, Keim D. Interactive Data Visualisation. Natick,
Massachusetts: A K Peters, Ltd.; 2010.
Hardcastle TJ, Kelly KA. baySeq: empirical Bayesian methods for
identifying differential expression in sequence count data. BMC
Bioinforma. 2010;11:422.
Schilde C, Lawal HM, Noegel AA, Eichinger L, Schaap P, Glockner G. A
set of genes conserved in sequence and expression traces back the
establishment of multicellularity in social amoebae. BMC Genomics.
2016;17(1):871.
Glockner G, Lawal HM, Felder M, Singh R, Singer G, Weijer CJ, Schaap P.
The multicellularity genes of dictyostelid social amoebas. Nat Commun.
2016;7:12085.
Zhang X, Zhuchenko O, Kuspa A, Soldati T. Social amoebae trap and kill
bacteria by casting DNA nets. Nat Commun. 2016;7:10938.
Received: 30 November 2016 Accepted: 23 May 2017
References
1. Raper K. Pseudoplasmodium formation and organization in dictyostelium
discoideum. J Elisha Mitchell Sci Soc. 1940;56:241–82.
2. Williams J. Dictyostelium finds new roles to model. Genetics. 2010;185(3):
717–26.
3. Eichinger L, Pachebat JA, Glockner G, Rajandream MA, Sucgang R,
Berriman M, Song J, Olsen R, Szafranski K, Xu Q, Tunggal B,
Kummerfeld S, Madera M, Konfortov BA, Rivero F, Bankier AT,
Lehmann R, Hamlin N, Davies R, Gaudet P, Fey P, Pilcher K, Chen G,
Saunders D, Sodergren E, Davis P, Kerhornou A, Nie X, Hall N, Anjard C,
Hemphill L, Bason N, Farbrother P, Desany B, Just E, Morio T, Rost R,
Churcher C, Cooper J, Haydock S, van Driessche N, Cronin A,
Goodhead I, Muzny D, Mourier T, Pain A, Lu M, Harper D, Lindsay R,
Hauser H, James K, Quiles M, Madan Babu M, Saito T, Buchrieser C,
Wardroper A, Felder M, Thangavelu M, Johnson D, Knights A,
Loulseged H, Mungall K, Oliver K, Price C, Quail MA, Urushihara H,
Hernandez J, Rabbinowitsch E, Steffen D, Sanders M, Ma J, Kohara Y,
Sharp S, Simmonds M, Spiegler S, Tivey A, Sugano S, White B, Walker D,
Woodward J, Winckler T, Tanaka Y, Shaulsky G, Schleicher M,
Weinstock G, Rosenthal A, Cox EC, Chisholm RL, Gibbs R, Loomis WF,
Platzer M, Kay RR, Williams J, Dear PH, Noegel AA, Barrell B, Kuspa A.
The genome of the social amoeba Dictyostelium discoideum. Nature.
2005;435(7038):43–57.
4. Van Driessche N, Shaw C, Katoh M, Morio T, Sucgang R, Ibarra M,
Kuwayama H, Saito T, Urushihara H, Maeda M, Takeuchi I, Ochiai H,
Eaton W, Tollett J, Halter J, Kuspa A, Tanaka Y, Shaulsky G. A
transcriptional profile of multicellular development in Dictyostelium
discoideum. Development. 2002;129(7):1543–52.
5. Parikh A, Miranda ER, Katoh-Kurasawa M, Fuller D, Rot G, Zagar L,
Curk T, Sucgang R, Chen R, Zupan B, Loomis WF, Kuspa A, Shaulsky G.
Conserved developmental transcriptomes in evolutionarily divergent
species. Genome Biol. 2010;11(3):35.
Submit your next manuscript to BioMed Central
and we will help you at every step:
• We accept pre-submission inquiries
• Our selector tool helps you to find the most relevant journal
• We provide round the clock customer support
• Convenient online submission
• Thorough peer review
• Inclusion in PubMed and all major indexing services
• Maximum visibility for your research
Submit your manuscript at
www.biomedcentral.com/submit