Reconciliation feasibility in the presence of gene duplication, loss, and coalescence with multiple individuals per species
Bạn đang xem bản rút gọn của tài liệu. Xem và tải ngay bản đầy đủ của tài liệu tại đây (794.74 KB, 10 trang )
Rogers et al. BMC Bioinformatics (2017) 18:292
DOI 10.1186/s12859-017-1701-1
METHODOLOGY ARTICLE
Open Access
Reconciliation feasibility in the presence
of gene duplication, loss, and coalescence with
multiple individuals per species
Jennifer Rogers1 , Andrew Fishberg1 , Nora Youngs2,3 and Yi-Chieh Wu1*
Abstract
Background: In phylogenetics, we often seek to reconcile gene trees with species trees within the framework of an
evolutionary model. While the most popular models for eukaryotic species allow for only gene duplication and gene
loss or only multispecies coalescence, recent work has combined these phenomena through a reconciliation
structure, the labeled coalescent tree (LCT), that simultaneously describes the duplication-loss and coalescent history
of a gene family. However, the LCT makes the simplifying assumption that only one individual is sampled per species
whereas, with advances in gene sequencing, we now have access to multiple samples per species.
Results: We demonstrate that with these additional samples, there exist gene tree topologies that are impossible to
reconcile with any species tree. In particular, the multiple samples enforce new constraints on the placement of
duplications within a valid reconciliation. To model these constraints, we extend the LCT to a new structure, the
partially labeled coalescent tree (PLCT) and demonstrate how to use the PLCT to evaluate the feasibility of a gene tree
topology. We apply our algorithm to two clades of apes and flies to characterize possible sources of infeasibility.
Conclusion: Going forward, we believe that this model represents a first step towards understanding reconciliations
in duplication-loss-coalescence models with multiple samples per species.
Keywords: Phylogenetics, Reconciliation, Coalescence, Incomplete lineage sorting, Gene duplication and loss
Background
In evolutionary biology, a phylogenetic tree describes evolutionary relationships among a collection of taxonomic
units, for example, genes or species. To understand the
evolutionary history of a gene family, or a set of genes
with detectable shared ancestry, we rely on two types
of phylogenetic trees: the species tree that describes how
a set of species have speciated, and the gene tree that
describes how a set of genes sampled from these species
have diverged. The gene tree can be thought of as evolving
“inside” the species tree, and this nesting is represented as
a reconciliation that indicates the particular number and
order of evolutionary events that gave rise to the gene tree.
When the gene tree and species tree are congruent, the
gene tree topology can be explained through speciation
*Correspondence:
Department of Computer Science, Harvey Mudd College, Claremont,
California 91711, USA
Full list of author information is available at the end of the article
1
events alone. However, when the two trees are incongruent, we must account for the differences by postulating
additional evolutionary events. For example, the number
of loci per species could change due to gene duplication
and loss [1–6] or additionally horizontal gene transfer
[3, 7–11]. Stochastic fixation of polymorphisms in a
population could result in incomplete lineage sorting
[3, 12–17]. There could be events in the species history
not represented in a species tree such as hybridization
[18–21]. Or convergent evolution, in which similar traits
evolved independently rather than as a result of shared
ancestry, may have occurred, for example through gene
conversion [22–25].
In this work, we focus on two of the most popular evolutionary models for eukaryotic organisms: the duplicationloss model that allows for gene duplications and gene
losses (Fig. 1a) and the multispecies coalescent model that
allows for incomplete lineage sorting (Fig. 1b). Many reconciliation methods have been developed that focus on
© The Author(s). 2017 Open Access This article is distributed under the terms of the Creative Commons Attribution 4.0
International License ( which permits unrestricted use, distribution, and
reproduction in any medium, provided you give appropriate credit to the original author(s) and the source, provide a link to the
Creative Commons license, and indicate if changes were made. The Creative Commons Public Domain Dedication waiver
( applies to the data made available in this article, unless otherwise stated.
Rogers et al. BMC Bioinformatics (2017) 18:292
a
Page 2 of 10
b
d
c
p=1/(2N)
p=1
p=1
a1 b1b2 c1c2
a1
b1
c1
a1
b1
c1
b2
c2
a1
b1 b2
c1 c2
A
A
B
C
A
B
C
B
C
A
B
C
B
C
Locus 1
Locus 2
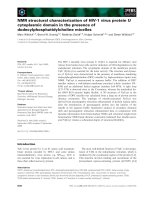
Fig. 1 Evolutionary models and reconciliation structures. a In the duplication-loss model, incongruence between the gene tree (black) and species
tree (blue) can be explained using gene duplications (yellow star) and gene losses (red “x”). b In a multispecies coalescent model, incongruence
between the gene tree and species tree can be explained due to incomplete lineage sorting (ILS). c The unified model proposed by Rasmussen and
Kellis [36] combines the duplication-loss and multispecies coalescent models. For an alternative view of this model, in which the traditional
duplication-loss and coalescent processes are decoupled, see Additional file 1: Figure S1. d The LCT combines the species tree, locus tree, gene tree,
and reconciliations between them into a single structure. [Figure and caption adapted with permission from Wu et al. [37] and Rasmussen and Kellis
[36]]
only one of these models. For inferring duplications and
losses, reconciliation can be performed using a parsimony
[1, 2, 26–28] or probabilistic [4, 6, 29] framework. For
inferring evolution in the presence of incomplete lineage
sorting, similar parsimony [3, 30] and probabilistic [15]
methods exist, though these are often used to estimate
ancestral population sizes or divergence times [15], to
reconstruct species trees [31, 32], or both [33, 34].
Only a few methods consider reconciliation under a
duplication-loss-coalescence, or DLC, model, which, as
its name implies, allows for duplication, loss, and coalescence. For example, NOTUNG [35] reconciles gene
trees against a non-binary species tree to minimize the
duplication-loss cost while allowing for possible deep coalescence at unresolved nodes in the species tree. While
this parsimony framework is simple, it cannot capture all
possible evolutionary histories. More recent algorithms
have relied on a unified generative model, DLCoal, that
introduces an intermediate locus tree (Fig. 1c; [36]). Under
this model, the gene tree (also known as the coalescent
tree) evolves within the locus tree according to a multispecies coalescent model, and the locus tree evolves
within the species tree according to a duplication-loss
model. Subsequently, a new reconciliation structure, the
labeled coalescent tree (LCT), was introduced that simultaneously describes the three trees and reconciliations
between them (Fig. 1d; [37]). The associated reconciliation algorithms DLCoalRecon and DLCpar infer the
maximum a posteriori or a most parsimonious reconciliation, respectively, and substantially improve homolog and
event inference.
However, both DLCoalRecon and DLCpar assume that
each extant species is represented by a single haploid sample. But as more genomes are sequenced and
variants genotyped, it will become increasingly important to incorporate the additional information provided
by the multiple samples into phylogenetic algorithms.
Here, we consider for the first time the problem of
gene tree-species tree reconciliation under a DLC model
with multiple samples per species. However, rather than
present a full reconciliation method, we consider the
subproblem of reconciliation feasibility. That is, previously, DLCoalRecon and DLCpar relied on the fact that,
regardless of the gene tree topology, a feasible reconciliation always exists. The proof is trivial: any such
gene tree (with one haploid sample but possibly multiple loci per species) can be reconciled against any
species tree under a duplication-loss model alone [38].
Of course, not all reconciliations are parsimonious or
probable; nevertheless, the existence of a universal reconciliation strategy allows research to focus on finding an
optimal one.
In contrast, when using multiple haploid samples per
species, we can no longer assume that a feasible reconciliation exists. For this problem, we present several
contributions:
• We demonstrate that, with multiple haploid samples
per species, if at least one species contains multiple
loci, then regardless of the species tree topology,
there exist gene tree topologies for which no valid
reconciliation is possible.
Rogers et al. BMC Bioinformatics (2017) 18:292
• We present an algorithm for determining
reconciliation feasibility. Our algorithm relies on a
new reconciliation structure, the partially labeled
coalescent tree (PLCT), to capture the constraints
implied by the multiple loci and multiple samples. In
brief, the PLCT is a gene tree in which each branch is
labeled with the locus in which it evolved, and the
labeling is partial because not all branches necessarily
have labels and because multiple labels may
correspond to the same locus. We further introduce
the locus equivalence graph (LEG) to capture the
constraints among loci within the PLCT and
demonstrate how connected components within the
LEG can be used to determine reconciliation
feasibility.
To demonstrate the utility of our approach, we
have applied it to both a real primate and a simulated fly data set to characterize the percentage
of feasible and infeasible gene trees and understand how various user choices and data set metrics,
such as the gene tree reconstruction algorithm, the number of samples, and the level of branch support and ILS,
affect feasibility. The PLCT software and data are freely
available for download at />software/plct.
Methods
Gene family evolution under duplication, loss, and
coalescence
To understand how gene families evolve through
gene duplication, gene loss, and coalescence, we start
by reviewing the DLCoal model that combines the
duplication-loss and multispecies coalescent models [36].
The DLCoal model makes the following assumptions:
1. Any incongruence between the gene tree and species
tree can be explained through duplication, loss, and
coalescence. Furthermore, each duplication creates a
unique new locus that is unlinked with the original
locus, allowing coalescence within the original and
new loci to occur independently, and there is no gene
conversion between duplicated loci.
2. Duplication and loss events do not fix differently in
descendant species; that is, they do not undergo
hemiplasy (Additional file 1: Figure S2; [39]).
Equivalently, all duplications and losses either always
go extinct (p = 0) or fix (p = 1) in all descendant
lineages, allowing us to separate the duplication-loss
process from the coalescent process.
3. Each extant species is represented by a single haploid
sample; that is, within each gene family, multiple
genes from the same extant species are sampled from
multiple loci in a single individual as opposed to
Page 3 of 10
being sampled from the same locus across multiple
individuals.
Assumption 1 is applicable to evolution within eukaryotic species, and assumption 2 was shown to affect only
a small number of gene trees in simulation with biologically realistic parameters [36]. We relax assumption 3 in
this work.
We now consider the gene family illustrated in Fig. 1c.
In this example, a duplication occurs in one chromosome
along the branch ancestral to species B and C, creating
a new locus (“locus 2”) in the genome distinct from the
original locus (“locus 1”). At the new locus, this duplicate
evolves within the population according to the WrightFisher process [12, 14–16, 40] until it eventually fixates.
Thus, the sampled genomes of A, B, and C contain genes
a1 , b1 , b2 , c1 , and c2 , and their phylogenetic tree is a
“traceback” in the combined Wright-Fisher processes of
loci 1 and 2. Furthermore, the red and yellow trees representing loci 1 and 2 form an intermediate locus tree
that is distinct from the gene tree and species tree and
describes how loci are created and destroyed. To disentangle the effects of duplication-loss and coalescence, we can
think of the gene tree as evolving “inside” the locus tree,
with a multispecies coalescent process within each locus,
and we can think of the locus tree as evolving “inside”
the species tree according to a duplication-loss process
(Additional file 1: Figure S1). As the gene tree of this
model represents the history of gene sequences as they
coalesce within the locus tree, we will use the term coalescent tree and gene tree interchangeably throughout the
remainder of this manuscript.
Reconciliation using the labeled coalescent tree
In the DLCoal model, evolutionary history is captured
through three trees and two reconciliations: the gene,
locus, and species trees, and the gene tree-locus tree and
locus tree-species tree reconciliations. The labeled coalescent tree (LCT) combines this history into a single
reconciliation structure (Fig. 1d; [37]). As a full description of the LCT is not necessary for our purposes, we
focus on the concepts essential to our reconciliation feasibility algorithm. First, duplications occur along branches
in the LCT. In contrast to duplications at nodes of the
locus tree, duplications in the LCT denote that the locus
has changed at some point along the branch. By placing duplications along branches, we can capture the delay
between a duplication event and the time at which the lineage with the duplicate coalesces with another lineage in
the original locus. For example, in the scenario of Fig. 1d,
a duplication occurs in the ancestor of species B and C,
but the lineage with the duplicate coalesces with a lineage in the original locus in the root species. Second, the
LCT labels each node and branch with the locus in which
Rogers et al. BMC Bioinformatics (2017) 18:292
Page 4 of 10
each other before coalescing with other lineages, the additional sample provides no additional information about
this gene.) Given only a reconstructed gene tree (Fig. 2b),
a reconciliation must simultaneously explain the history
of all samples.
But under these assumptions, the reconciliation is no
longer trivially feasible because the multiple samples
introduce allele constraints and the multiple loci introduce paralog constraints. That is, within a species, genes
at the same locus across multiple samples must be alleles,
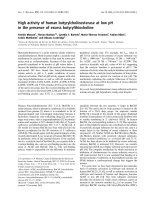
and genes at different loci must be paralogs. As an example of how allele and paralog constraints may conflict,
consider sampling two genes (from locus 1 and locus 2)
in two individuals (samples i and ii) from a single species
A (Fig. 3a). The reconstructed gene tree (Fig. 3b) suggests that the genes within an individual are more closely
related than the same gene across multiple individuals;
such a gene tree may have been the result of noisy gene
sequencing or reconstruction error, or due to violations
of our model assumptions, for example, through gene
conversion within each individual.
We now demonstrate that this gene tree is infeasible
under a DLC model. Genes ai1 and aii1 are from the same
locus 1, so they must be alleles, and a valid reconciliation must not have any duplication along the path between
these two leaves (Fig. 3b, orange). Similarly, genes ai2 and
aii2 from locus 2 must be alleles, further constraining the
location of duplications (Fig. 3b, purple). Next, locus 1 and
locus 2 are distinct loci within the same species; therefore,
any pair of genes, one from locus 1 and one from locus
2, must be paralogs, and a valid reconciliation must have
at least one duplication along the path between each gene
pair (Fig. 3b, right). Now suppose that we wanted to add a
duplication between paralogs ai1 and ai2 . There is no place
to put this duplication because we have already prohibited
duplications on every branch between ai1 and ai2 . Thus,
there is no way to simultaneously satisfy these allele and
the gene evolves; for branches with a duplication, one side
of the branch (before the duplication) is labeled with the
original locus and the other side (after the duplication)
with the new locus.
Let us consider one version of the reconciliation problem in which we are given a gene tree, a species tree, and a
leaf mapping that, for each extant gene, defines the extant
species from which it was sampled. Both trees are full,
rooted, and binary, and the leaf mapping indicates only the
species to which each extant gene belongs. In particular,
we have no knowledge of how loci across different species
are related. For this problem, if each species is represented
by a single haploid sample, then regardless of the gene tree
topology, a valid reconciliation exists.
Constraints introduced by multiple samples
We now extend our reconciliation problem to consider
the case in which at least one species is sequenced from
multiple haploid samples (requiring a coalescence-aware
model) and at multiple loci (requiring a duplication-aware
model). We assume that we know the species-specific
locus from which each gene is sampled, as would be the
case when variants are mapped onto a reference genome.
But as before, we have no knowledge of how loci across
different species are related. Furthermore, there may exist
copy number variation across the samples in that different
samples from the same species contain different loci.
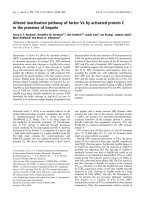
To demonstrate how multiple samples might provide additional information for the reconciliation problem, consider the gene family illustrated in Fig. 2a.
While the duplication-loss history of this family is identical to that of Fig. 1c, we now have access to two individuals
(the original sample i and a new sample ii) from species
C. Furthermore, the coalescent histories of these samples
differ. In particular, the gene tree supports two placements
for gene c1 with respect to the other genes. (In contrast, because the two samples for gene c2 coalesce with
b
a
a1
A
b1
B
Locus 1
c1i c1ii b2
C
c2i c2ii
B
a1 b1 c1i c1ii b2 c2i c2ii
C
Locus 2
Fig. 2 Multiple samples. a The unified model allows for multiple samples per species (sampled individuals denoted in superscript). b A
reconstructed gene tree shows different histories for the multiple samples, and a reconciliation must simultaneously explain these histories
Rogers et al. BMC Bioinformatics (2017) 18:292
a
Page 5 of 10
b
sample i
sample
locus
species
a1i
1 2
alleles
paralogs
1 2
a 1i
sample ii
a2i a1ii
a2ii
a 1i
a2i a1ii
a2ii
Fig. 3 Allele and paralog constraints. a Genes are sampled at two loci 1 and 2 from two individuals i and ii in a single species A. Within this species,
genes at the same locus (across multiple individuals) must be alleles, and genes at different loci (regardless of individual) must be paralogs. b A valid
reconciliation must not include a duplication along the path between alleles (left, each color corresponds to one locus, and no colored branch can
have a duplication). At the same time, a valid reconciliation must include a duplication along the path between paralogs (right, every colored path
must have a duplication on at least one branch of the path). There is no way to simultaneously satisfy these constraints, so this gene tree is not
reconcilable
paralog constraints, and the gene tree in this example is
not reconcilable.
An algorithm to determine reconciliation feasibility
We have seen that, in the presence of multiple samples
and loci per species, not all gene trees are reconcilable. Furthermore, whether a gene tree is reconcilable depends only on allele and paralog constraints,
which in turn depend on the gene tree topology
and the leaf mapping but are independent of the
species tree and of the rooting of the gene tree.
Thus, while we use the term reconciliation feasibility
throughout this manuscript, a more appropriate term
might be gene tree feasibility under a reconciliation
model.
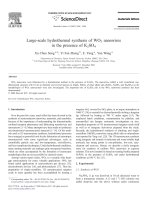
We now present an algorithm to determine whether a
gene tree is reconcilable given the constraints imposed
by the inclusion of multiple samples and multiple loci
(Fig. 4). Our algorithm consists of two new structures:
the partially labeled coalescent tree (PLCT) that describes
a
the constraints on the placement of duplications in the
gene tree, and the locus equivalence graph (LEG) that
describes the set of loci that must be orthologous. To
determine feasibility, we examine the pairs of loci within
the LEG that must be paralogs. If any pair of loci is
constrained to be both orthologs and paralogs, then we
conclude that the gene tree has no valid reconciliation. We
describe these steps in more detail below. Here, we focus
on the algorithmic intuition. Technical details, including
pseudocode, a formal proof of correctness, an analysis
of time complexity, and optimizations, are provided in
Additional file 1: Section S1.
Generating the partially labeled coalescent tree
We are given as input a full, binary gene tree and a leaf
mapping that, for each extant gene, defines the extant
species from which it was sampled and the speciesspecific locus at which it was sampled (Fig. 4a). Our goal
is to label the gene tree branches along which duplications
cannot have occurred.
d
c
b
b1 and b2
in different
connected
components
a1
species A
sample i
1
b2
b1
sample ii
a 1i
1
b 1i
a1ii
b1ii
b 2i
b2ii
feasible
species B
sample i
1
b1 and b2
in same
connected
component
a1
2
sample ii
1
2
b1
a 1i
a1ii
b 1i
b 2i
b1ii
b2ii
b2
infeasible
Fig. 4 Reconciliation feasibility. a The sampled species, loci, and individuals. We assume knowledge of the species-specific locus from which each
gene is sampled. b For a gene tree (black), the PLCT uses alleles to label branches along which no duplications are allowed (colored lines). c The LEG
contains one node per species-specific locus and encodes overlapping labels in the PLCT as edges in the LEG. d A gene tree has a feasible
reconciliation if and only if every connected component of the LEG contains no more than one locus from each species
Rogers et al. BMC Bioinformatics (2017) 18:292
To construct these constraints, we consider each set of
genes mapped to the same species and locus. Each pair of
genes within this set must be alleles, so duplications cannot have occurred along the path between any pair. To
denote this constraint, we label the branches along these
paths with a unique color corresponding to the speciesspecific locus (Fig. 4b). We then repeat this process for
each locus of each species. Thus, a branch of the PLCT
may be labeled with multiple colors if it is constrained by
multiple species-specific loci.
Generating the locus equivalence graph
Given a PLCT, our goal is to encode the set of speciesspecific loci that must be orthologous. However, rather
than consider orthologs, we will consider the stronger
concept of locus equivalency. Two loci in different
species are equivalent if they derived from their most
recent common ancestor through speciation events alone.
As an example, in the scenario of Fig. 1c, each species has
its own species-specific “locus 1” (a1 , b1 , c1 ) that derived
from the original “locus 1” in the root species through speciations. Note that equivalent loci must be orthologous
but orthologous loci may not be equivalent as duplications could have occurred since the common ancestor.
Furthermore, because only speciations are allowed, locus
equivalency is a transitive relationship.
To encode locus equivalencies, we construct a graph in
which nodes denote species-specific loci and edges denote
the equivalency constraint. We start by creating a graph
with one vertex for each species-specific locus. Next, for
every branch of the PLCT with multiple labels, we add
an edge to the LEG between all pairwise combinations of
these labels (Fig. 4c). To understand the rationale, recall
that each label in the PLCT corresponds to one speciesspecific locus and that the PLCT can assign multiple labels
to each gene tree branch. Since each branch also corresponds to a gene lineage at a specific point in time and this
lineage must exist at only one locus, if a branch has multiple labels, these labels must correspond to the same locus
and be equivalent.
Determining reconciliation feasibility
Finally, given a LEG, our goal is to determine whether
the original input gene tree has a feasible reconciliation.
We call a LEG reconcilable if and only if every connected component of the LEG contains no more than one
locus from any species, and we claim that a gene tree is
reconcilable if and only if its LEG is reconcilable.
First we show that if the LEG is irreconcilable,
that is, if any connected component of the LEG contains multiple loci from a single species, then the gene
tree is irreconcilable. Since locus equivalency is transitive and implies orthology, each connected component
of the LEG represents a set of species-specific loci that
Page 6 of 10
must be equivalent, and every pair within this set must be
orthologs. However, we also know that distinct loci within
the same species must be paralogs. Therefore, if any connected component of the LEG contains multiple loci from
a single species, then a pair of genes is constrained to be
both orthologs and paralogs. As no reconciliation can satisfy both constraints, the gene tree must be irreconcilable
(Fig. 4d, bottom).
Next we show that if the LEG is reconcilable, that is,
every connected component of the LEG contains no more
than one locus from a single species, then the gene tree
is reconcilable. Note that if we required that loci within
the same connected component of the LEG be equivalent and loci across different connected components be
non-equivalent, then such a reconciliation is valid (Fig. 4d,
top). We can induce the former constraint by restricting duplications from occurring on any labeled branch of
the PLCT. Similarly, we can induce the latter constraint
by inserting duplications on unlabeled branches between
nodes in different connected components of the LEG. We
emphasize that this reconciliation, though valid, may not
be parsimonious nor probable.
Lastly, we comment briefly on our algorithm as
applied to non-binary gene trees. In such cases, if the
LEG is irreconcilable, then the gene tree is irreconcilable. However, if the LEG is reconcilable, then the
reconciliation feasibility of the gene tree is unknown
(Additional file 1: Theorem S1.1).
Results and discussion
Biological data set of ape genomes
To assess our algorithm on a real data set, we analyzed
6298 gene families across seven species or subspecies
of great apes, with data obtained from Prado-Martinez
et al. [41] and Flicek et al. [42] and trees reconstructed
using maximum parsimony (PHYLIP [43]), neighborjoining (BioNJ [44]), and maximum likelihood (PhyML
[45], RAxML [46]) (Additional file 1: Section S2, Tab 1).
To understand whether multiple samples add information to the gene tree, we investigated the monophyly of genes sampled at the same species and same
locus. If such genes are inferred to be monophyletic,
then the multiple samples agree on their relationship relative to other genes and contribute no added
information over a single sample. We call a speciesspecific loci monophyletic if the genes within the
locus are monophyletic, and we call a tree monophyletic if all loci within the tree are monophyletic.
We find that 57.6% of loci and 0.46% of trees are
monophyletic, suggesting some disagreement among
the samples.
Additionally, we find that despite the low percentage of monophyletic trees, 4.4% of trees are infeasible.
We believe that many trees are feasible because most
Rogers et al. BMC Bioinformatics (2017) 18:292
Page 7 of 10
Table 1 Reconciliation infeasibility in apes data set
Phylogenetic program
Treesa
Locib
Monophyletic treesc
Monophyletic locid
Infeasiblee
PHYLIP
76
1394
3 (3.9%)
1115 (80.0%)
35 40.8
BioNJ
6298
125,928
5 (0.1%)
63,013 (50.0%)
366 5.8
PhyML
6297
125,914
46 (0.7%)
80,805 (64.2%)
229 3.6
RAxML
6298
125,928
34 (0.5%)
73,576 (58.4%)
213 3.4
a
The number of gene trees considered for each program. For PHYLIP, since many trees were non-binary, we considered only trees for which we can definitively determine
their reconciliation feasibility or infeasibility. In particular, non-binary trees with a reconcilable LEG were not considered. For PHYLIP and PhyML, one tree could not be
reconstructed
b The number of species-specific loci across all trees
c The number and percentage of trees for which, for every species-specific loci, the genes in that loci were inferred to be monophyletic
d The number and percentage of species-specific loci for which the genes in that loci were inferred to be monophyletic
e The number and percentage of trees with infeasible reconciliations
200
400
number of trees
60
0
0
20
bootstrap
40
binary tree, reconcilable LEG
non-binary tree, irreconcilable LEG
binary tree, irreconcilable LEG
600
800
100
b
80
a
labels are part of a conflicting connected component,
we find that conflicting branches have significantly lower
bootstrap support than non-conflicting branches (Fig. 5a).
This trend remains even after strengthening our definition of conflict to include only branches whose labels map
to multiple loci from a single species. That is, the labels
must directly conflict, which is equivalent to looking only
for conflicts in neighboring nodes of the LEG rather than
among the nodes in each connected component. In our
second approach, we collapsed branches with bootstrap
support below a threshold and evaluated the feasibility of
the resulting gene trees (Fig. 5b). Here, recall that nonbinary gene trees with a reconcilable LEG have unknown
reconciliation feasibility. As the threshold increases, the
number of gene trees with such indeterminate feasibility increases. At the same time, the number of infeasible
gene trees decreases, an expected result as fewer branches
have conflicting labels, resulting in fewer conflicts in the
1000
loci are monophyletic; therefore, only a few gene tree
branches have multiple labels, resulting in less possibility for conflict in the LEG. For example, for RAxML
gene trees, only 26.5% of branches are labeled and only
17.7% have multiple labels. While we have only investigated a few gene tree reconstruction algorithms, we find
that the percentage of infeasible trees increases as reconstruction accuracy decreases, with maximum likelihood
methods outperforming neighbor-joining methods [6, 47]
and neighbor-joining methods outperforming parsimony
methods [48, 49].
Next, we hypothesized that reconciliation infeasibility was the result of poorly supported branches in the
gene tree. To investigate this possible effect, we analyzed
RAxML gene trees in two ways. In our first approach,
recall that a conflict occurs in the LEG if any connected
component contains multiple loci from a single species.
After separating branches based on whether the branch
weak conflict
non-conflicting branches
strong conflict
conflicting branches
10 20 30 40 50 60 70 80 90 100
threshold
Fig. 5 Reconciliation infeasibility due to poorly supported branches. a Bootstrap support among conflicting and non-conflicting branches. A branch
is said to conflict if its labels are part of a connected component that contains multiple loci from a single species (weak conflict) or if its labels map to
multiple loci from a single species (strong conflict). For both types of conflict, the distribution of bootstrap support for conflicting branches was
significantly lower than the distribution for non-conflicting branches (mean denoted as ‘×’, statistics in Additional file 1: Table S1). b Reconciliation
infeasibility after collapsing poorly supported branches. For each gene tree, we collapsed branches with bootstrap support below the threshold,
generated LEGs for the resulting multifurcating gene trees, and evaluated the feasibility of the LEGs. Non-binary trees with a reconcilable LEG have
unknown reconciliation feasibility and are not shown but constitute the remainder of the 6298 gene trees. As the threshold increases, the numbers
of feasible (blue) and infeasible (red) gene trees decrease while the number of trees with unknown feasibility increases
Rogers et al. BMC Bioinformatics (2017) 18:292
Page 8 of 10
Simulated data set
Monophyly
Conclusion
Traditionally, researchers have investigated eukaryotic
gene families using the duplication-loss model only or
the coalescent-only model only. However, while the
duplication-loss model can be applied to paralogous
families with multiple loci per species, it cannot capture population-related effects and is restricted to a
single sample per species. Similarly, while the coalescent model can incorporate multiple alleles and thus
multiple samples per species, it assumes orthologous
loci with a single locus per species. This work bridges
these models by considering a joint DLC model and
b
trees
loci
DL Rate
1x
2x
4x
Tree
30
% infeasible
20
Number of
Samples
2
10
10
40
60
Number of
Samples
2
5
10
20
% monophyly
40
80
a
100
To evaluate our algorithm on a different clade, we used the
simulated data set of twelve Drosophila previously developed by Rasmussen and Kellis [36] for evaluating reconciliations under a DLC model, supplemented to simulate
multiple individuals per species and gene tree reconstruction error (Additional file 1: Section S3). In brief, we used
a known species tree and parameters and simulated evolution with varying duplication and loss rates, population
sizes, and number of samples to understand how these
parameters affect several metrics.
As before, we investigated the monophyly of genes sampled at the same species and locus (Fig. 6a), and as
expected, we find that, as the population size and number of samples increase, each of which increases the level
of ILS, monophyly decreases. Furthermore, for reconstructed gene trees, no tree is monophyletic and few
loci are monophyletic, demonstrating that reconstructed
gene trees exhibit greater disagreement among samples
compared to true trees.
We also find that the percentage of infeasible gene trees
increases with the level of ILS (Fig. 6b). However, possible sources of ILS affect infeasibility in different ways. For
example, few gene trees (0–2.3%) are infeasible for low
population sizes (1–25 million), but once the population
size exceeds this threshold, the percentage of infeasible
gene trees increases rapidly. In contrast, increasing the
rate of duplications and losses or increasing the number
of samples also increases the percentage of infeasible gene
trees but to a lesser degree. For example, at a duplicationloss rate 1× the estimated real rate, a population size
of 50 million, and with 2 samples per species, 3.0% of
gene trees are infeasible. Doubling the population size
incurs a larger increase in infeasibility (17.0 percentage
points to 20.0%) than increasing the number of samples
to 5 (5.9 points to 8.9%) or doubling the duplication-loss
rate (3.2 points to 6.2%). Interestingly, these results can
only partially be attributed to trends in monophyletic loci
(Fig. 6a). That is, from the same baseline of 1×, 50 million, and 2 samples, 42.7% of loci are monophyletic. Just
as doubling the duplication-loss rate yields the smallest
increase in infeasibility, it also incurs the smallest decrease
in monophyletic loci (0.8 points to 41.9%). However,
increasing the number of samples yields a larger decrease
(17.1 points to 25.6%) than doubling the population
size (7.3 points to 35.4%). Still, together, these results
demonstrate that the problem of infeasible gene trees
must be considered for dense, rapidly evolving clades, a
type of data set that is likely to increase as sequencing
costs decline.
50
LEG. And the number of feasible gene trees also decreases
until eventually, a smaller percentage of gene trees are
feasible than infeasible. Altogether, these results demonstrate that while reconciliation feasibility is affected by
poorly supported branches, even robust gene trees with
well-supported branches can be infeasible.
0
0
true
RAxML
1
10
25
50
effective population size (millions)
100
1
10
25
50
100
effective population size (millions)
Fig. 6 Reconciliation infeasibility in simulated flies data set. a The percentage of monophyletic trees and loci for varying number of samples using
the true simulated gene tree and the reconstructed RAxML gene tree. Monophyly decreases as the population size and number of samples increase.
Results are shown for duplications and losses simulated at the same rate (1×) as that estimated for real data; little difference is observed when the
rate is varied (not shown). b The percentage of gene trees with infeasible reconciliations using RAxML gene trees. The percentage of infeasible gene
trees increases as the population size, duplication-loss rate, and number of samples increase. Results for 5 samples are not shown but tend to lie
between the values for 2 and 10 samples for the same population size and duplication-loss rate
Rogers et al. BMC Bioinformatics (2017) 18:292
allowing for multiple loci and multiple samples per
species. Importantly, only by using a joint model can we
account for both sources of gene multiplicity within a
species.
However, for gene families with multiple loci and
samples, we have demonstrated that gene tree topological feasibility is no longer guaranteed, and to
address this issue, we have presented an algorithm
for assessing feasibility. Because we have allowed
for data sets with multiple loci and samples, our
method will only become increasingly relevant as
more genomes as sequenced. For such data sets,
we envision our method as part of a larger phylogenomic pipeline, for example, to identify gene trees
with known errors or gene trees that violate our
model assumptions and filter them from analysis.
Additionally, because our method relies only on the
gene tree topology and leaf mappings, and in particular, is independent of the species tree and the
gene tree rooting, it is broadly applicable. In this way,
our method complements existing bootstrap methods
for measuring gene tree quality. While bootstraps can
be used to evaluate the robustness of a reconstructed
topology, both at the resolution of the full topology
and for individual branches, our method can definitively identify when a gene tree topology has been
affected by reconstruction error or gene conversion.
However, we caution that our approach can only identify
a portion of the trees that are incorrect, and the sensitivity
of our method for identifying topological error remains
an open question.
Going forward, our work moves us one step closer
to phylogenomic studies with multiple samples per
species, and we see several directions for future
work. For example, we have addressed the question of reconciliation feasibility for binary gene trees.
Next steps could consider feasibility for non-binary
gene trees or extend current DLC-reconciliation algorithms such as DLCoalRecon [36] and DLCpar [37]
to handle multiple samples per species. There has also
been recent work on whether ortholog and paralog constraints, possibly inferred from external sources, are
mutually satisfiable [50] and on correcting gene tree
topological errors based on ortholog constraints [51].
Along these lines, our work could be extended to capture ortholog constraints so that researchers could, for
example, incorporate evidence from manually-curated
comparisons between model organisms to improve inferences. Or, given that we know which gene trees must
have errors, one could investigate error-correction algorithms for making infeasible gene trees feasible. Finally, we
have assumed that, for each species, we know the locus
from which each gene was sampled. For data sets without this information, a reconciliation approach could be
Page 9 of 10
developed to infer relationships within species in addition
to between species.
Additional file
Additional file 1: Supplementary Material. (PDF 370 kb)
Acknowledgments
We thank Ran Libeskind-Hadas and Mukul Bansal for helpful comments,
feedback, and discussions.
Funding
This work was supported by funds from the Department of Computer Science
and the Dean of Faculty of Harvey Mudd College.
Availability of data and materials
The PLCT software and supplemental data are freely available for download at
/>Authors’ contributions
YW conceived the problem. JR and NR developed and formally analyzed the
algorithm. AF and YW implemented the software and analyzed the data. JR
and YW drafted the manuscript. All authors read and approved the final
manuscript.
Competing interests
The authors declare that they have no competing interests.
Consent for publication
Not applicable.
Ethics approval and consent to participate
Not applicable.
Publisher’s Note
Springer Nature remains neutral with regard to jurisdictional claims in
published maps and institutional affiliations.
Author details
1 Department of Computer Science, Harvey Mudd College, Claremont,
California 91711, USA. 2 Department of Mathematics, Harvey Mudd College,
Claremont, California 91711, USA. 3 Current Address: Department of
Mathematics and Statistics, Colby College, Waterville, Maine 04901, USA.
Received: 27 December 2016 Accepted: 22 May 2017
References
1. Goodman M, Czelusniak J, Moore GW, Romero-Herrera AE, Matsuda G.
Fitting the gene lineage into its species lineage, a parsimony strategy
illustrated by cladograms constructed from globin sequences. Syst Zool.
1979;28(2):132–63.
2. Page RDM. Maps between trees and cladistic analysis of historical
associations among genes,organisms, and areas. Syst Biol. 1994;43(1):
58–77.
3. Maddison WP. Gene trees in species trees. Syst Biol. 1997;46(3):523–36.
4. Arvestad L, Berglund AC, Lagergren J, Sennblad B. Gene tree
reconstruction and orthology analysis based on an integrated model for
duplications and sequence evolution. In: Proceedings of the Eighth
Annual International Conference on Research in Computational
Molecular Biology. RECOMB ’04. New York: ACM; 2004. p. 326–35.
5. Durand D, Hallórsson BV, Vernot B. A hybrid micro–macroevolutionary
approach to gene tree reconstruction. J Comput Biol. 2006;13(2):320–35.
6. Rasmussen MD, Kellis M. A Bayesian approach for fast and accurate gene
tree reconstruction. Mol Biol Evol. 2011;28(1):273–90.
7. Doyon JP, Scornavacca C, Gorbunov KY, SzöllHosi GJ, Ranwez V, Berry V.
An efficient algorithm for gene/species trees parsimonious reconciliation
with losses, duplications and transfers In: Tannier E, editor. Comparative
Rogers et al. BMC Bioinformatics (2017) 18:292
8.
9.
10.
11.
12.
13.
14.
15.
16.
17.
18.
19.
20.
21.
22.
23.
24.
25.
26.
27.
28.
29.
30.
31.
32.
33.
34.
35.
36.
Genomics. Lecture Notes in Comput Sci, vol. 6398. Berlin, Heidelberg:
Springer; 2011. p. 93–108.
David LA, Alm EJ. Rapid evolutionary innovation during an archaean
genetic expansion. Nature. 2011;469(7328):93–6.
Tofigh A, Hallett M, Lagergren J. Simultaneous identification of
duplications and lateral gene transfers. IEEE/ACM Trans Comput Biol
Bioinform. 2011;8(2):517–35.
Chen ZZ, Deng F, Wang L. Simultaneous identification of duplications,
losses, and lateral gene transfers. IEEE/ACM Trans Comput Biol Bioinform.
2012;9(5):1515–28.
Bansal MS, Alm EJ, Kellis M. Efficient algorithms for the reconciliation
problem with gene duplication, horizontal transfer and loss.
Bioinformatics. 2012;28(12):283–91.
Pamilo P, Nei M. Relationships between gene trees and species trees. Mol
Biol Evol. 1988;5(5):568–83.
Takahata N. Gene genealogy in three related populations: consistency
probability between gene and population trees. Genetics. 1989;122(4):
957–66.
Rosenberg NA. The probability of topological concordance of gene trees
and species trees. Theor Popul Biol. 2002;61(2):225–47.
Rannala B, Yang Z. Bayes estimation of species divergence times and
ancestral population sizes using DNA sequences from multiple loci.
Genetics. 2003;164(4):1645–56.
Degnan JH, Rosenberg NA. Gene tree discordance, phylogenetic
inference and the multispecies coalescent. Trends Ecol Evol. 2009;24(6):
332–40.
Wakeley J. Coalescent Theory: An Introduction. Greenwood Village: Roberts
& Company Publishers; 2009.
Arnold ML. Natural Hybridization and Evolution. New York: Oxford University
Press; 1997.
Mallet J. Hybrid speciation. Nature. 2007;446(7133):279–83.
Nakhleh L. Evolutionary phylogenetic networks: Models and issues. In:
Problem Solving Handbook in Computational Biology and Bioinformatics.
Boston: Springer; 2011. p. 125–58.
Yu Y, Barnett RM, Nakhleh L. Parsimonious inference of hybridization in
the presence of incomplete lineage sorting. Syst Biol. 2013;62(5):738–51.
Innan H. The coalescent and infinite-site model of a small multigene
family. Genetics. 2003;163(2):803–10.
Teshima KM, Innan H. The effect of gene conversion on the divergence
between duplicated genes. Genetics. 2004;166(3):1553–60.
Thornton KR. The neutral coalescent process for recent gene duplications
and copy-number variants. Genetics. 2007;177(2):987–1000.
Innan H. Population genetic models of duplicated genes. Genetica.
2009;137(1):19.
Chen K, Durand D, Farach-Colton M. NOTUNG: A program for dating
gene duplications and optimizing gene family trees. J Comput Biol.
2000;7(3-4):429–47.
Zmasek CM, Eddy SR. A simple algorithm to infer gene duplication and
speciation events on a gene tree. Bioinformatics. 2001;17(9):821–8.
Wapinski I, Pfeffer A, Friedman N, Regev A. Natural history and
evolutionary principles of gene duplication in fungi. Nature.
2007;449(7158):54–61.
Hahn MW, De Bie T, Stajich JE, Nguyen C, Cristianini N. Estimating the
tempo and mode of gene family evolution from comparative genomic
data. Genome Res. 2005;15(8):1153–60.
Wu T, Zhang L. Structural properties of the reconciliation space and their
applications in enumerating nearly-optimal reconciliations between a
gene tree and a species tree. BMC Bioinf. 2011;12(Suppl 9):7.
Kubatko LS, Carstens BC, Knowles LL. STEM: species tree estimation
using maximum likelihood for gene trees under coalescence.
Bioinformatics. 2009;25(7):971–3.
Liu L, Yu L, Kubatko L, Pearl DK, Edwards SV. Coalescent methods for
estimating phylogenetic trees. Mol Phylogenet Evol. 2009;53(1):320–8.
Drummond A, Rambaut A. BEAST: Bayesian evolutionary analysis by
sampling trees. BMC Evol Biol. 2007;7(7):214.
Liu L, Pearl DK. Species trees from gene trees: Reconstructing Bayesian
posterior distributions of a species phylogeny using estimated gene tree
distributions. Syst Biol. 2007;56(3):504–14.
Vernot B, Stolzer M, Goldman A, Durand D. Reconciliation with
non-binary species trees. J Comput Biol. 2008;15(8):981–1006.
Rasmussen MD, Kellis M. Unified modeling of gene duplication, loss, and
coalescence using a locus tree. Genome Res. 2012;22:755–65.
Page 10 of 10
37. Wu YC, Rasmussen MD, Bansal MS, Kellis M. Most parsimonious
reconciliation in the presence of gene duplication, loss, and deep
coalescence using labeled coalescent trees. Genome Res. 2014;24(3):
475–86.
38. Page RD. GeneTree: comparing gene and species phylogenies using
reconciled trees. Bioinformatics. 1998;14(9):819–20.
39. Avise JC, Robinson TJ. Hemiplasy: A new term in the lexicon of
phylogenetics. Syst Biol. 2008;57(3):503–7.
40. Tajima F. Evolutionary relationship of DNA sequences in finite
populations. Genetics. 1983;105(2):437–60.
41. Prado-Martinez J, Sudmant PH, Kidd JM, Li H, Kelley JL, Lorente-Galdos B,
´
Veeramah KR, Woerner AE, OConnor
TD, Santpere G, Cagan A,
Theunert C, Casals F, Laayouni H, Munch K, Hobolth A, Halager AE,
Malig M, Hernandez-Rodriguez J, Hernando-Herraez I, Prufer K, Pybus M,
Johnstone L, Lachmann M, Alkan C, Twigg D, Petit N, Baker C,
Hormozdiari F, Fernandez-Callejo M, Dabad M, Wilson ML, Stevison L,
Camprubi C, Carvalho T, Ruiz-Herrera A, Vives L, Mele M, Abello T,
Kondova I, Bontrop RE, Pusey A, Lankester F, Kiyang JA, Bergl RA,
Lonsdorf E, Myers S, Ventura M, Gagneux P, Comas D, Siegismund H,
Blanc J, Agueda-Calpena L, Gut M, Fulton L, Tishkoff SA, Mullikin JC,
Wilson RK, Gut IG, Gonder MK, Ryder OA, Hahn BH, Navarro A, Akey JM,
Bertranpetit J, Reich D, Mailund T, Schierup MH, Hvilsom C, Andres AM,
Wall JD, Bustamante CD, Hammer MF, Eichler EE, Marques-Bonet T.
Great ape genetic diversity and population history. Nature.
2013;499(7459):471–5.
42. Flicek P, Amode MR, Barrell D, Beal K, Billis K, Brent S, Carvalho-Silva D,
Clapham P, Coates G, Fitzgerald S, Gil L, Girón CG, Gordon L, Hourlier T,
Hunt S, Johnson N, Juettemann T, Kähäri AK, Keenan S, Kulesha E, Martin FJ,
Maurel T, McLaren WM, Murphy DN, Nag R, Overduin B, Pignatelli M,
Pritchard B, Pritchard E, Riat HS, Ruffier M, Sheppard D, Taylor K,
Thormann A, Trevanion SJ, Vullo A, Wilder SP, Wilson M, Zadissa A,
Aken BL, Birney E, Cunningham F, Harrow J, Herrero J, Hubbard TJP,
Kinsella R, Muffato M, Parker A, Spudich G, Yates A, Zerbino DR, Searle SMJ.
Ensembl 2014. Nucleic Acids Res. 2014;42(D1):749–55.
43. Felsenstein J. PHYLIP - Phylogeny Inference Package (Version 3.2).
Cladistics. 1989;5:164–6.
44. Gascuel O. BIONJ: an improved version of the NJ algorithm based on a
simple model of sequence data. Mol Biol Evol. 1997;14(7):685–95.
45. Guindon S, Dufayard JF, Lefort V, Anisimova M, Hordijk W, Gascuel O.
New algorithms and methods to estimate maximum-likelihood
phylogenies: Assessing the performance of PhyML 3.0. Syst Biol.
2010;59(3):307–21.
46. Stamatakis A. RAxML-VI-HPC: maximum likelihood-based phylogenetic
analyses with thousands of taxa and mixed models. Bioinformatics.
2006;22(21):2688–90.
47. Wu YC, Rasmussen MD, Bansal MS, Kellis M. TreeFix: Statistically informed
gene tree error correction using species trees. Syst Biol. 2013;62(1):110–20.
48. Saitou N, Imanishi T. Relative efficiencies of the Fitch-Margoliash,
maximum-parsimony, maximum likelihood, minimum-evolution, and
neighbor-joining methods of phylogenetic tree construction in obtaining
the correct tree. Mol Biol Evol. 1989;6(5):514–25.
49. Tateno Y, Takezaki N, Nei M. Relative efficiencies of the maximumlikelihood, neighbor-joining, and maximum-parsimony methods when
substitution rate varies with site. Mol Biol Evol. 1994;11(2):261–77.
50. Lafond M, El-Mabrouk N. Orthology and paralogy constraints: satisfiability
and consistency. BMC Genomics. 2014;15(6):1–10.
51. Lafond M, Semeria M, Swenson KM, Tannier E, El-Mabrouk N. Gene tree
correction guided by orthology. BMC Bioinforma. 2013;14(15):1–9.