Characterization of strain amplitude-dependent behavior of hardness and indentation size effect of SS400 structural steel
Bạn đang xem bản rút gọn của tài liệu. Xem và tải ngay bản đầy đủ của tài liệu tại đây (3.81 MB, 11 trang )
Journal of Science and Technology in Civil Engineering, NUCE 2020. 14 (3): 15–25
CHARACTERIZATION OF STRAIN
AMPLITUDE-DEPENDENT BEHAVIOR OF HARDNESS
AND INDENTATION SIZE EFFECT OF SS400
STRUCTURAL STEEL
Nguyen Ngoc Vinha,∗, Vu Quoc Anhb , Hong Tien Thanga
a
Department of Civil and Environmental Engineering, Sejong University, Gwangjin-gu, Seoul, South Korea
b
Department of Steel and Timber Structures, Hanoi Architectural University,
Km 10, Nguyen Trai road, Thanh Xuan district, Hanoi, Viet Nam
Article history:
Received 13/03/2020, Revised 10/04/2020, Accepted 13/04/2020
Abstract
In this paper, the continuous stiffness measurement (CSM) indentation is employed to investigate fatigue mechanical properties of structural steel under cyclic loading. For this purpose, several representative analytical
approaches were introduced to estimate the basic mechanical properties including Young’s modulus and indentation hardness from the characteristics of the loading/unloading curves. Several experiments including CSM
nanoindentation, low-cycle fatigue experiment for four strain amplitude levels, optical microscope (OM), and
transmission electron microscopy (TEM) examinations were conducted to observe the variation characteristics
of mechanical properties at the microscale and their micro-mechanisms. The microstructural evolution of the
specimens deformed by the low-cycle fatigue was observed using the OM and TEM examinations. The standard
nanoindentation experiments were then performed at different strain rate levels to characterize the influences
of strain rate indentation on hardness of the material. The micro-mechanisms established based on the microstructural evolution and strain gradient plasticity theory were introduced to be responsible for the variation
of indentation hardness under cyclic loading. Finally, the indentation size effect (ISE) phenomenon in SS400
structural steel was investigated and explained through the strain gradient plasticity theory regarding geometrically necessary dislocations underneath the indenter tip. The experimental results can be used for practical
designs as well as for understanding the fatigue behavior of SS400 structural steel.
Keywords: cyclic loading; fatigue; nanoindentation; indentation size effect; strain rate sensitivity; structural
steel.
/>
c 2020 National University of Civil Engineering
1. Introduction
Structural steel is attributed to one of the most important materials in the construction industry.
The topics regarding structural steel have also been the most studied and understood [1, 2]. The behavior of structural steel can be predicted and followed many standards and codes to define its mechanical
properties, chemical compositions, the specific shape, and cross-section. These standards/codes are
established by the agencies, for example, the National Institute of Standards and Technology, American Institute of Steel Construction, Korean Steel and Alloy Standard, and so on. The primary purpose
∗
Corresponding author. E-mail address: (Vinh, N. N.)
15
Vinh, N. N., et al. / Journal of Science and Technology in Civil Engineering
of the steel in the building industry is to construct the skeleton, which supports everything together.
Structural steel is often employed as the reinforcement materials to support the materials having low
tensile strength and low ductility [3, 4]. The high ductility of the structural steel is another important
property, which allows redistributing the stresses in the continuous components and at the local region
having high stresses. Since structural steel has energy dissipation capacity, high durability, and ductility, the structures made from structural steel have a great ability to resist dynamic loading, earthquake,
and seismic loading [5–7]. Thus, this material is a good choice to construct buildings by engineers
and architects. Structural steel under the effects of the operational factors in a long time can result in
the embrittlement caused by corrosion damage, thermal aging, and fatigue [8]. This might lead to the
reduction of material properties as well as eventually failure.
In material science, fatigue is attributed to the weakening of a material caused by the cyclic loading, leading to progressive structural damage and crack propagation [9, 10]. Historically, fatigue has
been divided into two types, for example, high-cycle fatigue (number of cycle N is more than 104 )
and low-cycle fatigue (LCF), where there is significant plasticity [11, 12]. LCF has two fundamental characteristics, including low cycle phenomenon and plastic deformation in each cycle, in which
the materials have finite endurance for this type of load. There is a lot of interest in investigating
the influences of cyclic loading on the mechanical properties of the material, especially steel [13–
20]. Srinivasan et al. [13] investigated the LCF behavior at several temperatures of 316L stainless
steel. The experimental results of their research indicated that the fatigue life showed the temperaturedependent behavior, in which the fatigue life reached a maximum at the intermediate temperature
range. Ye et al. [14] studied the fatigue deformation behavior of 18Cr-8Ni austenitic steel subjected
to the LCF loading. The authors pointed out that the slip band spacing tended to decrease when the
strain amplitude increased from 0.04% to 2%, and Vicker’s hardness of all the strain amplitude levels
exhibited the indentation size-dependent behavior. Mannan and Valsan [15] then studied the thermomechanical fatigue, creep-fatigue, and low-cycle fatigue of 9Cr-1Mo steel at high temperatures. The
results from their research indicated that base metal of 316L stainless steel showed better fatigue resistance compared with weld metal at a temperature of 773 K. Ye et al. [18] applied the nondestructive
indentation technique to estimate the mechanical properties in the 304L steel weld zone subjected to
the LCF loading, while numerical and experimental investigation regarding the LCF behavior of P91
steel was conducted by Dundulis et al. [19].
The fracture behavior and the fatigue properties of low yielding point steel were characterized by
Yang et al. [20]. The experimental results showed the excellent LCF properties, in which the number
of cycles was less than 100 when the strain amplitude was more than 3%, while the number of cycles
was larger than 100 with smaller strain amplitudes. Recently, Nguyen et al. [21] investigated the strain
rate sensitivity behavior of structural steel subjected to the cyclic loading using the depth-sensing instrumented technique. However, the strain amplitude-dependent behavior of hardness and indentation
size effect of SS400 structural steel has not been well investigated so far. Thus, a series of experiments, including nanoindentation, LCF experiments, OM, and TEM examinations were performed on
the SS400 structural steel. The microstructure evolution of the specimen deformed by cyclic loading
was observed using the TEM examination. The variation of indentation hardness under different strain
amplitude levels was investigated using the nanoindentation experiment. Micro-mechanism was then
introduced to be responsible for the variation of indentation hardness under the fatigue conditions.
Finally, the indentation size effect phenomenon of SS400 structural steel was observed and analyzed.
16
Vinh, N. N., et al. / Journal of Science and Technology in Civil Engineering
2. Methodology
Journal of Science and Technology in Civil Engineering NUCE 2020
ISSN 1859-2996
2.1. Determination of material properties from loading/unloading curves
Figure
1. 1.
Indentation
curve
Figure
Indentation
curveofofstructural
structuralsteel
steel
Determination
of strain
rate sensitivity
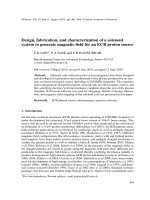
Fig. 1 2.2.
presents
the indentation
curve
of structural steel from the standard indentation experiment.
There are several methods to extract the mechanical properties of the material from the characteristics
The strain
rate [22–24],
sensitivityforisexample,
the mostOliver
important
parameter
in the indentation
Johnson-Cook
of the indentation
curves
and Pharr
[22]. Thus,
hardness (H)
constitutive
model,
which
is
a
visco-plastic
model
considering
the
temperature
can be determined using Eq. (1), and elastic modulus (E) can also be estimated using Eq.and
(2) [25–27].
strain rate influences on material behavior and fracture [28,29]. Normally, the strain
Pm
rate sensitivity of structural steel is calculated
H = based on the results of the dynamic tensile
experiment using the following equation [30]Ac
−1
2
345(7
)
1 ' , 1 − ϑi
𝑚 =2 39:(<̇
)
E = 1−ϑ
Er
−
Ei
(4)
(1)
(2)
where 𝜎> and 𝜀̇ are the yield strength and strain rate, respectively. Although the results
In Eq. (1), Pm and Ac are the maximum applied load and the contact area, respectively. The
of strain rate sensitivity from the dynamic tensile experiment are reliable, high testing
notation Ei and ϑi in Eq. (2) are the elastic modulus and Poisson’s ratio of the indenter tip, and ϑ
cost and time-consuming task in performing the dynamic loading tensile experiments
is Poisson’s ratio of the tested material. The reduced modulus (Er ) is commonly calculated via the
are the limitations of this approach. Recently, nanoindentation is attributed to a
values of the contact stiffness (S ) and Ac as
promising method to determine the strain rate sensitivity of the material at the small
√
πS [31–34]. For the nanoindentation
scales, for example, microscale and nanoscale
Er =
(3)
√
technique, the strain rate sensitivity is defined
2β Aasc the change in indentation hardness
versus the change in the strain rate as
where β is the constant factor.
𝑚=
2.2. Determination of strain rate sensitivity
39:(?)
39:(<̇ )
.
(5)
The strain
rate sensitivity
the most important
2.3. Estimation
of theisdislocation
density parameter in the Johnson-Cook constitutive model,
which is a visco-plastic model considering the temperature and strain rate influences on material
behavior and
fracture
[28, conditions,
29]. Normally,
the strain structure
rate sensitivity
of structural
is calculated
Under
the fatigue
the dislocation
was formed
dependingsteel
on the
based on the
results
of
the
dynamic
tensile
experiment
using
the
following
equation
[30]
strain amplitude levels. The formation of the dislocation structure, as well as the
variation of grain size subjected to the cyclic loading, was observed using the TEM and
∂ ln σy
OM examinations. The dislocation density
m = and the grain size are then calculated from
∂ ln(ε)
˙
(4)
where σy and ε˙ are the yield strength and strain rate, respectively. Although the results of strain rate
4
sensitivity from the dynamic tensile experiment are reliable, high testing cost and time-consuming
17
Vinh, N. N., et al. / Journal of Science and Technology in Civil Engineering
task in performing the dynamic loading tensile experiments are the limitations of this approach. Recently, nanoindentation is attributed to a promising method to determine the strain rate sensitivity of
the material at the small scales, for example, microscale and nanoscale [31–34]. For the nanoindentation technique, the strain rate sensitivity is defined as the change in indentation hardness versus the
change in the strain rate as
∂ ln(H)
m=
(5)
∂ ln(ε)
˙
2.3. Estimation of the dislocation density
Under the fatigue conditions, the dislocation structure was formed depending on the strain amplitude levels. The formation of the dislocation structure, as well as the variation of grain size subjected
to the cyclic loading, was observed using the TEM and OM examinations. The dislocation density
and the grain size are then calculated from TEM images. Regarding the density of the dislocations,
there are two different methods to determine the dislocation density, such as X-Ray diffraction and
TEM examination. To reduce the complexity of the research, the dislocation density (ρ) of the tested
material can be determined from the TEM image using the following equation
ρ=
NIntersection
A
(6)
in which A and NIntersection are a tested area and the number of intersections of the dislocation lines
and the surface plan. Both values of NIntersection and A are obtained from the TEM images.
3. Experimental procedures
The LCF experiments are performed using a universal fatigue machine (MTS fatigue testing
equipment system) with the allowed capacity of 100 kN. The specimens for the LCF experiments
are cut out from the steel plate with 12 mm thickness. All the LCF specimens have the same dimension, for example, 12 mm thickness, 10 mm width, and 24 mm length gauge. The geometry of
the fatigue specimens is divided into three segments as follows: a clamping section, a transition section, and an effective length section. Further details of the fatigue specimens and the fatigue machine
can be found out elsewhere [21]. It should be noted that the specimen preparation complies with
the ASTM standard [35]. To measure the strain during fatigue testing, an electronic extensometer is
employed in the center of the middle section of the specimens. A computer, which connects to the
loading and measurement system, is employed to record the applied load and the number of cycles to
failure. Finally, the LCF experiments are carried out at four strain amplitude (εa ) levels, such as F-01
(εa = 0.4%), F-02 (εa = 0.6%), F-03 (εa = 0.8%), and F-04 (εa = 1.0%). It should be noted that
all the fatigue experiments in this study are performed at a semi-static strain rate of 0.001 s−1 and a
frequency of 10 Hz.
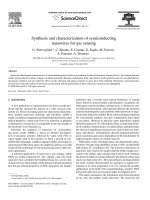
Another experiment in this study is nanoindentation. First, the specimens for nanoindentation are
cut out from the middle region of the specimens deformed by the cyclic loading. Thus, the flat rectangular plates with a size of 12 mm × 10 mm × 15 mm are achieved. These specimens are mounted
into the 25 mm diameter circle epoxy mold and then polished to obtain the specimen surface with
high fineness as shown in Fig. 2. The standard nanoindentation experiments are performed on these
polished specimens in the wide strain rate range from 0.04 s−1 to 0.2 s−1 . The same hm of 2000 nm is
used for standard nanoindentation experiments. It should be noted that an industry diamond Berkovich
indenter tip with Poisson’s ratio of 0.07 and an elastic modulus of 1140 GPa is employed for all
18
Vinh, N. N., et al. / Journal of Science and Technology in Civil Engineering
nanoindentation experiments in this study [25]. To investigate the indentation size effect of SS400
structural steel, CSM indentation experiments are also carried out in the load control mode with a
maximum applied load of 190 mN, a load amplitude of 10 mN, a constant loading/unloading rate of
300 mN/min, and a frequency of 10 Hz. The preparation of specimens and performing nanoindentation experiments comply with the E2546-07 ASTM standard [36, 37]. To observe the microstructural
evolution under the cyclic loading, the TEM examination is adopted. Three thin slices are cut out
from the cross-section in the middle part near the fracture location. The precision ion polishing system technique is then employed to electropolish these thin slices. The TEM examinations are carried
out using the TEM HF-3300 machine.
Figure 2. Nano-Hardness testing system
4. Results
4.1. Microstructural evolution under cyclic loading
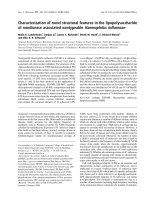
Under the cyclic loading, the dislocation structure (nanostructure) strongly depends on the strain
amplitude levels. Indeed, to observe the dislocation structure of the specimens deformed by the lowcycle fatigue, the TEM examination was performed, and the dislocation structure was presented in
Fig. 3. It can be seen that the initial dislocation structure mainly consists of the dislocation lines with
a low dislocation density. These dislocation lines are randomly arranged. At low strain amplitude
(0.4%), the sub-grains and the packets of the dislocation debris were formed as shown in Fig. 3(b).
The dislocations are partially developed on both the interior of the grains and the grain boundaries
with randomly arranged dislocations. The sub-grains are mainly located inside the initial grains, and
the individual striations can be observed in the interior of the grains. These individual striations
penetrate many grains, leading to the formation of the smaller dislocation structure. At the highest
strain amplitude, the progressive reduction of sub-grain size can be observed. The dislocation lines
are fully developed in the interior of the grains, and higher dislocation density is also observed. The
presence of the individual striations is more frequent. This might lead to the smaller size of the subgrains, and the smaller distance of dislocation slips as observed in Fig. 3(c). Since the dislocation line
19
Vinh, N. N., et al. / Journal of Science and Technology in Civil Engineering
is fully developed inside the grains, it is quite difficult to distinguish the boundaries of the sub-grains.
It can be deduced from the microstructural evolution that the dislocation density tends to increase
with the further increase of strain amplitude, while the size of sub-grains, as well as the dislocation
Journal
of Science
and and
Technology
in Civil
Engineering
NUCE
2020
ISSN
1859-2996
Journal
of Science
Technology
in Civil
Engineering
NUCE
ISSN
slip
distance,
show
the progressive
decrease
as2020
illustrated
in1859-2996
Fig. 3.
(a) The virgin specimen
Figure
evolution(c)ofSpecimen
dislocationdeformed
structures
cyclic loading: a) th
(b) Specimen deformed
at 3.
εa The
= 0.4%
at under
εa = 1.0%
specimen, b) specimen deformed at 𝜀F = 0.4%, c) specimen deformed at 𝜀F
Figure 3. The evolution of dislocation structures under cyclic loading
4.2. Variation of indentation hardness
Journal of Science and Technology in Civil Engineering NUCE 2020
4.2. Variation of indentation hardness
ISSN 1859-2
The nanoindentation experiments were then performed on the polished sp
The nanoindentation experiments were thendifferent strain rate from 0.04 s'% to 0.2 s'% for corresponding strain amplit
performed on the polished specimens at differ-Indentation hardness was then calculated based on the indentation parame
ent strain rate from 0.04 s−1 to 0.2 s−1 for cor-applied load-displacement curve using Eq. (1). As a result, the strain rate-i
responding strain amplitude levels. Indentationhardness relationship was illustrated as shown in Fig. 4.
hardness was then calculated based on the indentaFigure
3. The
evolution
of dislocation
structures
under
cyclic
loading:
a) the
virgin
Figure
3.parameters
The
evolution
dislocation
under
cyclic
loading:
a) the
virgin
tion
ofof the
appliedstructures
load-displacement
specimen,
b)
specimen
deformed
at
𝜀
=
0.4%,
c)
specimen
deformed
at
𝜀
=
1.0%
specimen,
specimen
=F 0.4%,
specimen
deformed at 𝜀F =F 1.0%
curveb)using
Eq.deformed
(1). Asata𝜀Fresult,
thec) strain
rateindentation hardness relationship was illustrated
Variationindentation
of indentation
hardness
4.2.4.2.
Variation
as shownof in
Fig. 4. hardness
As seen, indentation hardness shows the ratenanoindentation
experiments
were
then
performed
polished
specimens
TheThe
nanoindentation
experiments
were
then
performed
on on
thethe
polished
specimens
at at
dependent
behavior,
in
higher
indentation strain amplitude levels.
'%
'%
8
'%swhich
'%
different
strain
rate
from
0.04
to
0.2
s
for
corresponding
different strain rate from 0.04 s to 0.2 s for corresponding strain amplitude levels.
hardnesshardness
can bewas
observed
at a higher
strain
rate
Indentation
then
calculated
based
on
the
indentation
parameters
of
the
Indentation hardness was then calculated based on the indentation parameters of the
forload-displacement
allload-displacement
cases of thecurve
strain
amplitudes.
in-the
applied
curve
using
As
a result,
strain
rate-indentation
applied
using
Eq.Eq.
(1).(1).
AsAnother
a result,
the
strain
rate-indentation
Figure
4. Variation
under
different
loading speeds
Figure of
4. indentation
Variation of hardness
indentation
hardness
under
teresting
feature
from
Fig.
4
is
that
the
indentation
hardness
relationship
illustrated
as shown
in Fig.
hardness
relationship
waswas
illustrated
as shown
in Fig.
4. 4.
different
speeds
As seen,
showsloading
the rate-dependent
behavior, in which
hardness depends not only on the strain rate
but indentation hardness
indentationrehardness can be observed at a higher strain rate for all cases of the
also on the strain amplitude. The experimental
sults show higher hardness for higher
strain amplitude.
the strain
amplitudes.
Another When
interesting
featurerate
fromincreases,
Fig. 4 is the
thateffects
the indentation ha
of strain amplitude on the indentationdepends
hardness
less
compared
with
a lower The experi
notare
only
onpronounced
the strain rate
but also on
thethose
strainatamplitude.
strain rate. Indeed, the strain amplitude
strongly
hardness
at 0.04
s−1amplitude.
, while theWhen
weakthe
de-strain rate inc
results
showinfluences
higher hardness
for higher
strain
pendence of hardness on the strain amplitude
canofbestrain
observed
at the on
highest
strain rate ashardness
presented
the effects
amplitude
the indentation
are less prono
in Fig. 4. The hardness results are thencompared
used to calculate
the
strain
rate
sensitivity
of
SS400
structural
with those at a lower strain rate. Indeed, the strain amplitude st
8 8
'%
steel as m = dln (H) /dln (˙ ). Therefore,
the plothardness
of logarithmic
versus
influences
at 0.04 s(hardness)
, while the
weaklogarithmic
dependence(strain
of hardness on the
rate) was established as seen in Fig. amplitude
4, and thecan
regression
analysis
was
then
performed.
Therefore,
be observed at the highest strain rate as presented in Fig. 4. The ha
the strain rate sensitivity values of 0.026,
0.041
0.045 were
well rate
determined
forofSS400
results0.032,
are then
usedand
to calculate
the strain
sensitivity
SS400 structural s
structural steel at the strain amplitude𝑚of=1.0%,
0.8%,
0.6%,
and
0.4%,
respectively.
𝑑ln(𝐻)/𝑑ln(𝜖̇). Therefore, the plot of logarithmic (hardness) versus logar
(strain rate) 20
was established as seen in Fig. 4, and the regression analysis wa
performed. Therefore, the strain rate sensitivity values of 0.026, 0.032, 0.041 and
were well determined for SS400 structural steel at the strain amplitude of 1.0 %,
0.6 %, and 0.4 %, respectively.
and more details of the CSM experiments were presented in the previous sectio
result in Fig. 5a shows that the ISE in SS400 structural steel is more pronounc
which indentation hardness is very high at a shallow indent of 160 nm, q
decreases from 5000 MPa to 2100 MPa when the indentation depth increases up t
Vinh, N. N., et al. / Journal of Science and Technology in Civil Engineering
nm, and finally becomes stable at the depths over 1600 nm.
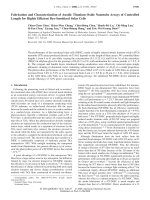
4.3. Indentation size effect phenomenon
In the nanoindentation technique, several phenomena usually occur during the loading and unloading stages, for example, pile-up, sink-in, pop-in, indentation size effect (ISE), and so on [38–40],
of Science and Technology in Civil Engineering NUCE 2020
1859-2996
in which the ISE phenomenon is the decrease ofISSN
hardness
with increasing indentation load or increasing indentation depth [41, 42]. This ISE phenomenon can be observed in most materials, but
more pronounced in the metal, especially in steel [43, 44]. This is a reason to investigate the ISE in
e details of the CSM experiments were presented in the previous section. The
SS400 structural steel. For this purpose, numerous CSM indentations with a sinus model were perFig. 5a shows
that the ISE in SS400 structural steel is more pronounced, in
formed, and more details of the CSM experiments were presented in the previous section. The result
ndentation hardness
is shows
very high
at ISE
a shallow
indent
of 160
quickly
in Fig. 5(a)
that the
in SS400
structural
steelnm,
is more
pronounced, in which indentation
s from 5000hardness
MPa to 2100
MPa
the indentation
depth
up decreases
to 1600 from 5000 MPa to 2100 MPa
is very
highwhen
at a shallow
indent of
160 increases
nm, quickly
whenstable
the indentation
depth
increases
up to 1600 nm, and finally becomes stable at the depths over
finally becomes
at the depths
over
1600 nm.
1600 nm.
size effect
of SS400 structural
steel: a) Hardness-dept
(a) Hardness-depth relationship Figure 5. Indentation
(b) Estimation
of macro-hardness
and a characteristic
length
using
Nix
&
Gao
model
relationship, b) Estimation of macro-hardness and a characteristic length using N
Gao model
Figure 5. Indentation size effect of SS400 structural steel
The ISE phenomenon can be explained through the strain gradient plasticity theory regarding
geometrically necessary dislocation (GND). Nix and Gao [41] proposed a general model to explain the
dependence of hardness on the indentation depth. This model assumes that the dislocations generated
during the indentation process are stored within the hemispherical volume defined by the contact
radius (ac ) as shown in Fig. 6, and the indentation hardness can be described as a function of h,
macro-hardness (H0 ), and a characteristic length (h∗ ) as
h∗
H
10
= 1+
(7)
H0a) Hardness-depth
h
ure 5. Indentation size effect of SS400 structural steel:
ship, b) Estimation of macro-hardness
and a characteristic length using Nix &
In Eq. (7), h∗ can be calculated as h∗ = 40.5bα2 tan2 θ(µ/H0 )2 , wherein µ, α, θ, and b are the shear
Gao model
modulus, a constant factor, the angle between the indenter surface and the plane of the surface, and the
Burgers vector, respectively. Therefore, Nix and Gao’s model was applied to interpret the experimental
data in this study as shown in Fig. 5(b). As a result, H0 of 1602.5 MPa and h∗ of 1250 nm were well
achieved by fitting the experimental data using Eq. (7). It can be seen that Nix and Gao’s model
21
Journal of Science and Technology in Civil Engineering NUCE 2020
ISSN 1859-2996
Vinh, N. N., et al. / Journal of Science and Technology in Civil Engineering
6. Schematic
diagramfor
for understanding
understanding the the
ISE phenomenon
Figure Figure
6. Schematic
diagram
ISE phenomenon
describes
depth-dependent
especially
for the
depth lessplasticity
than 0.002theory
nm−1 .
Thewell
ISEthe
phenomenon
can hardness,
be explained
through
the inverse
strain gradient
At larger inverse depths (shallow indents), the larger standard deviation can be observed, which is
regarding geometrically necessary dislocation (GND). Nix and Gao [41] proposed a
caused by the blunted indenter tip, surface oxidation, and other defects [45].
general model to explain the dependence of hardness on the indentation depth. This
assumes that the dislocations generated during the indentation process are stored
5.model
Discussions
within the hemispherical volume defined by the contact radius (𝑎* ) as shown in Fig. 6,
The behavior of indentation hardness for different strain amplitudes was observed as shown in
and4.the
indentation
can be
described
a function
of ℎ,can
macro-hardness
(𝐻G ),
Fig.
The
dependencehardness
of indentation
hardness
on theasfatigue
conditions
be interpreted through
∗
the
of the dislocation
structure
andevolution
a characteristic
length (ℎ
) as and the strain gradient plasticity theory [46]. First, the re-
lationship between the indentation hardness of the material and the dislocation density (ρ) can be
?
described based on the strain gradient plasticity
model Ias∗ [41, 47]
= D1√+ .
(7)
?.
I √
H = cσ = c 3αGb ρ
(8)
In Eq. (7), ℎ∗ can be calculated as ℎ∗ = 40.5𝑏𝛼 $ 𝑡𝑎𝑛$ 𝜃(𝜇/𝐻 )$ , wherein 𝜇, 𝛼, 𝜃, and
G
where α and G are the constant factor and the shear modulus, respectively.
In Eq. (8), c is the Tabor’s
𝑏 are[48].
the shear
constant factor,
theisangle
between
the square
indenter
and
factor
It can modulus,
be seen thata indentation
hardness
proportional
to the
rootsurface
of the dislocation
density.
As previously
mentioned,
the dislocation
density showed
an increaseNix
when
strain
the plane
of the
surface, and
the Burgers
vector, respectively.
Therefore,
andtheGao’s
amplitude
increased
from
to 1.0%.
it can be deduced
the evolution
of theindislocation
model was
applied
to 0.4%
interpret
the Thus,
experimental
data in from
this study
as shown
Fig. 5b.
structure presented in Fig. 3 and the strain gradient
plasticity
theory
that
the
dislocation
density of
∗
Asspecimens
a result, deformed
𝐻G of 1602.5
MPa and
ℎ tends
of 1250
nm were
achieved
by of
fitting
the
the
by low-cycle
fatigue
to increase
withwell
the further
increase
the strain
experimental
datatousing
(7).toItan
can
be seen
that Nix and
Gao’sasmodel
describes
well
amplitude
from 0.4
1.0%, Eq.
leading
increase
of indentation
hardness
observed
in Fig. 4.
the depth-dependent hardness, especially for the inverse depth less than 0.002 nm'% .
6.AtConclusions
larger inverse depths (shallow indents), the larger standard deviation can be
observed,
which
is indentation,
caused by low-cycle
the blunted
indenter
tip, surface
and
other
In this study,
CSM
fatigue
experiments,
and TEMoxidation,
examination
were
performed
to
investigate
the
microstructural
evolution,
strain
amplitude-dependent
behavior
of
hardness,
defects [45].
and indentation size effect of SS400 structural steel. The experimental and analysis results support
the following conclusions:
5. Discussions
- The dislocation density tends to increase with the further increase of the strain amplitude, while
the size of sub-grains or the dislocation slip distance shows a progressive reduction.
hardness is highly sensitive to not only strain rate indentation but also the strain
The- Indentation
behavior of
indentation hardness for different strain amplitudes was observed as
amplitude level.
shown in Fig. 4. The dependence of indentation hardness on the fatigue conditions can
22
be interpreted through the evolution of the dislocation structure and the strain gradient
plasticity theory [46]. First, the relationship between the indentation hardness of the
Vinh, N. N., et al. / Journal of Science and Technology in Civil Engineering
- The indentation size effect phenomenon is observed in SS400 structural steel. The dependence
of hardness on the indentation depth is interpreted through the strain gradient plasticity theory (Nix
and Gao model).
- When the strain amplitude increases from 0.4% to 1.0%, the dislocation density tends to increase,
while the grain size shows a decrease, to be responsible for the strain amplitude-dependent behavior
of indentation hardness in this study.
Acknowledgments
This research was supported by a grant (19CTAP-C151846-01) from the Technology Advancement Research Program (TARP) funded by the Ministry of Land, Infrastructure, and Transport of the
Korean government and by a grant (2019R1A4A1021702) from the Basic Research Program through
the National Research Foundation of Korea (NRF) funded by the MSIT.
References
[1] Hai, N. V., Nghiem, D. N. T., Binh, L. V., Tin, L. N. C., Cuong, N. H. (2019). Large displacement
elastic analysis of planar steel frames with flexible beam-to-column connections under static loads by
corotational beam-column element. Journal of Science and Technology in Civil Engineering (STCE)NUCE, 13(3):85–94.
[2] Hieu, N. T., Tuan, V. A., Cuong, N. Q. (2019). Weight optimization of steel truss frames using differential
evolution algorithm. Journal of Science and Technology in Civil Engineering (STCE)-NUCE, 13(5V):
55–64. (in Vietnamese).
[3] Viet, V. Q., Ha, H., Hoan, P. T. (2019). Evaluation of ultimate bending moment of circular concrete–filled
double skin steel tubes using finite element analysis. Journal of Science and Technology in Civil Engineering (STCE) - NUCE, 13(1):21–32.
[4] Hieu, N. T. (2018). Simplified design method and parametric study of composite cellular beam. Journal
of Science and Technology in Civil Engineering (STCE) - NUCE, 12(3):34–43.
[5] Thuat, D. V., Hoa, N. D., Chuong, H. V., Khanh, T. D. (2019). Single-storey industrial steel building
frames with cranes designed to withstand static earthquake and wind loads. Journal of Science and
Technology in Civil Engineering (STCE) - NUCE, 13(5V):9–19. (in Vietnamese).
[6] Thuat, D. V., Hoa, N. D., Chuong, H. V., Hung, T. V. (2019). Effects of vertical seismic actions on the
responses of single-storey industrial steel building frames. Journal of Science and Technology in Civil
Engineering (STCE) - NUCE, 13(3):73–84.
[7] Trung, N. T. (2019). Application of Hilbert Huang transform to identify the natural frequencies of steel
frame. Journal of Science and Technology in Civil Engineering (STCE) - NUCE, 13(2):64–73.
[8] Thu, P. T. N., Tuan, P. Q. (2019). Effects of protective cover forms on behavior of I-shaped steel beams
under elevated temperature. Journal of Science and Technology in Civil Engineering (STCE) - NUCE, 13
(5V):47–54. (in Vietnamese).
[9] Wikipedia (2018). Fatigue (material). Wikipedia Free Encylopedia.
[10] Vuong, N. V., Quan, M. H. (2019). Fatigue analysis of jacket support structure for offshore wind turbines.
Journal of Science and Technology in Civil Engineering (STCE) - NUCE, 13(1):46–59.
[11] Murakami, Y., Miller, K. J. (2005). What is fatigue damage? A view point from the observation of low
cycle fatigue process. International Journal of Fatigue, 27(8):991–1005.
[12] Wikipedia (2019). Low-cycle fatigue. Wikipedia Free Encylopedia.
[13] Srinivasan, V. S., Sandhya, R., Bhanusankararao, K., Mannan, S. L., Raghavan, K. S. (1991). Effects of
temperature on the low cycle fatigue behaviour of nitrogen alloyed type 316L stainless steel. International
Journal of Fatigue, 13(6):471–478.
23
Vinh, N. N., et al. / Journal of Science and Technology in Civil Engineering
[14] Ye, D., Matsuoka, S., Nagashima, N., Suzuki, N. (2005). Multi-scale deformation behavior investigation
of 18Cr–8Ni austenitic steel subjected to low-cycle fatigue loading. Materials Characterization, 55(2):
106–117.
[15] Mannan, S. L., Valsan, M. (2006). High-temperature low cycle fatigue, creep–fatigue and thermomechanical fatigue of steels and their welds. International Journal of Mechanical Sciences, 48(2):160–175.
[16] Ye, D., Xu, Y., Xiao, L., Cha, H. (2010). Effects of low-cycle fatigue on static mechanical properties,
microstructures and fracture behavior of 304 stainless steel. Materials Science and Engineering: A, 527
(16-17):4092–4102.
[17] Saad, A. A., Sun, W., Hyde, T. H., Tanner, D. W. J. (2011). Cyclic softening behaviour of a P91 steel
under low cycle fatigue at high temperature. Procedia Engineering, 10:1103–1108.
[18] Ye, D., Mi, F., Liu, J., Xu, Y., Chen, Y., Xiao, L. (2013). Use of instrumented indentation testing to study
local mechanical properties of 304L SS welded joints subjected to low-cycle fatigue loadings. Materials
Science and Engineering: A, 564:76–84.
[19] Dundulis, G., Janulionis, R., Gryb˙enas, A., Makareviˇcius, V., Dundulis, R. (2017). Numerical and experimental investigation of low cycle fatigue behaviour in P91 steel. Engineering Failure Analysis, 79:
285–295.
[20] Yang, L., Gao, Y., Shi, G., Wang, X., Bai, Y. (2018). Low cycle fatigue property and fracture behavior of
low yield point steels. Construction and Building Materials, 165:688–696.
[21] Nguyen, N.-V., Pham, T.-H., Kim, S.-E. (2019). Strain rate sensitivity behavior of a structural steel during
low-cycle fatigue investigated using indentation. Materials Science and Engineering: A, 744:490–499.
[22] Oliver, W. C., Pharr, G. M. (1992). An improved technique for determining hardness and elastic modulus
using load and displacement sensing indentation experiments. Journal of Materials Research, 7(6):1564–
1583.
[23] Pham, T.-H., Kim, J. J., Kim, S.-E. (2015). Estimating constitutive equation of structural steel using
indentation. International Journal of Mechanical Sciences, 90:151–161.
[24] Chang, C., Xiao, G., Liu, E., Lin, J., Zhang, X., Long, X., Zhang, L.-l. (2019). Revisiting the procedure
for characterising mechanical properties in welded joints through nanoindentation. Materials Science and
Technology, 35(8):986–992.
[25] Nguyen, N.-V., Pham, T.-H., Kim, S.-E. (2018). Characterization of strain rate effects on the plastic
properties of structural steel using nanoindentation. Construction and Building Materials, 163:305–314.
[26] Nguyen, N.-V., Pham, T.-H., Kim, S.-E. (2019). Microstructure and strain rate sensitivity behavior of
SM490 structural steel weld zone investigated using indentation. Construction and Building Materials,
206:410–418.
[27] Hoan, P. T., Vinh, N. N., Tung, N. T. T. (2019). Indentation for investigation of strain rate effect on mechanical properties in structural steel weld zone. Journal of Science and Technology in Civil Engineering
(STCE)-NUCE, 13(3):104–112.
[28] Murugesan, M., Jung, D. (2019). Johnson Cook Material and Failure Model Parameters Estimation of
AISI-1045 Medium Carbon Steel for Metal Forming Applications. Materials, 12(4):609.
[29] Johnson, G. R., Cook, W. H. (1983). A constitutive model and data for metals subjected to large strains,
high strain rates and high temperatures. In Proceedings of the 7th International Symposium on Ballistics,
volume 21, The Netherlands, 541–547.
[30] Luecke, W. E., McColskey, J. D., McCowan, C. N., Banovic, S. W., Fields, R. J., Foecke, T., Siewert,
T. A., Gayle, F. W. (2005). Mechanical properties of structural steels. National Institude of Standards and
Technology, Washington.
[31] Liu, Y., Hay, J., Wang, H., Zhang, X. (2014). A new method for reliable determination of strain-rate
sensitivity of low-dimensional metallic materials by using nanoindentation. Scripta Materialia, 77:5–8.
[32] Wei, Q. (2007). Strain rate effects in the ultrafine grain and nanocrystalline regimes—influence on some
constitutive responses. Journal of Materials Science, 42(5):1709–1727.
[33] Nguyen, N.-V., Kim, S.-E. (2020). Experimental study to investigate microstructure and continuous strain
rate sensitivity of structural steel weld zone using nanoindentation. International Journal of Mechanical
Sciences, 174:105482.
24
Vinh, N. N., et al. / Journal of Science and Technology in Civil Engineering
[34] Nguyen, N.-V., Pham, T.-H., Kim, S.-E. (2019). Strain rate-dependent behaviors of mechanical properties
of structural steel investigated using indentation and finite element analysis. Mechanics of Materials, 137:
103089.
[35] ASTM (2004). Test method for strain-controlled fatigue testing. E606/E606M-12, 96:1–16.
[36] ASTM E2546-07 (2007). Standard practice for instrumented indentation testing.
[37] ASTM-E3 (2011). Standard guide for preparation of metallographic specimens. ASTM Int, 1–12.
[38] Shankar, S., Loganathan, P., Mertens, A. J. (2015). Analysis of pile-up/sink-in during spherical indentation for various strain hardening levels. Structural Engineering and Mechanics, 53(3):429–442.
[39] Giannakopoulos, A. E., Suresh, S. (1999). Determination of elastoplastic properties by instrumented
sharp indentation. Scripta Materialia, 40(10):1191–1198.
[40] Chen, K.-W., Jian, S.-R., Wei, P.-J., Jang, J. S.-C., Lin, J.-F. (2010). A study of the relationship between
semi-circular shear bands and pop-ins induced by indentation in bulk metallic glasses. Intermetallics, 18
(8):1572–1578.
[41] Nix, W. D., Gao, H. (1998). Indentation size effects in crystalline materials: A law for strain gradient
plasticity. Journal of the Mechanics and Physics of Solids, 46(3):411–425.
[42] Durst, K., Backes, B., Franke, O., G¨oken, M. (2006). Indentation size effect in metallic materials: Modeling strength from pop-in to macroscopic hardness using geometrically necessary dislocations. Acta
Materialia, 54(9):2547–2555.
[43] Rodriguez, R., Gutierrez, I. (2003). Correlation between nanoindentation and tensile propertiesInfluence
of the indentation size effect. Materials Science and Engineering: A, 361(1-2):377–384.
[44] Arthur, E. K., Ampaw, E., Kana, M. G. Z., Akinluwade, K. J., Adetunji, A. R., Adewoye, O. O., Soboyejo,
W. O. (2015). Indentation size effects in pack carbo-nitrided AISI 8620 steels. Materials Science and
Engineering: A, 644:347–357.
[45] Haghshenas, M., Khalili, A., Ranganathan, N. (2016). On room-temperature nanoindentation response of
an Al–Li–Cu alloy. Materials Science and Engineering: A, 676:20–27.
[46] Begley, M. R., Hutchinson, J. W. (1998). The mechanics of size-dependent indentation. Journal of the
Mechanics and Physics of Solids, 46(10):2049–2068.
[47] Durst, K., Backes, B., G¨oken, M. (2005). Indentation size effect in metallic materials: Correcting for the
size of the plastic zone. Scripta Materialia, 52(11):1093–1097.
[48] Tabor, D. (1951). The hardness of metals. Oxford at the Clarendon Press.
25