35768 Study of Electrode Reactions and Interfacial Properties
Bạn đang xem bản rút gọn của tài liệu. Xem và tải ngay bản đầy đủ của tài liệu tại đây (1.33 MB, 38 trang )
29
Analytical Electrochemistry, Third Edition, by Joseph Wang
Copyright © 2006 John Wiley & Sons, Inc.
2
STUDY OF ELECTRODE
REACTIONS AND
INTERFACIAL PROPERTIES
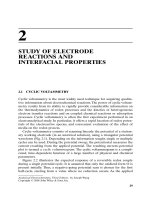
2.1 CYCLIC VOLTAMMETRY
Cyclic voltammetry is the most widely used technique for acquiring qualita-
tive information about electrochemical reactions. The power of cyclic voltam-
metry results from its ability to rapidly provide considerable information on
the thermodynamics of redox processes and the kinetics of heterogeneous
electron transfer reactions and on coupled chemical reactions or adsorption
processes. Cyclic voltammetry is often the first experiment performed in an
electroanalytical study. In particular, it offers a rapid location of redox poten-
tials of the electroactive species, and convenient evaluation of the effect of
media on the redox process.
Cyclic voltammetry consists of scanning linearly the potential of a station-
ary working electrode (in an unstirred solution), using a triangular potential
waveform (Fig. 2.1). Depending on the information sought, single or multiple
cycles can be used. During the potential sweep, the potentiostat measures the
current resulting from the applied potential. The resulting current–potential
plot is termed a cyclic voltammogram. The cyclic voltammogram is a compli-
cated, time-dependent function of a large number of physical and chemical
parameters.
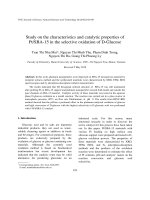
Figure 2.2 illustrates the expected response of a reversible redox couple
during a single potential cycle. It is assumed that only the oxidized form O is
present initially. Thus, a negative-going potential scan is chosen for the first
half-cycle, starting from a value where no reduction occurs. As the applied
potential approaches the characteristic E° for the redox process, a cathodic
current begins to increase, until a peak is reached. After traversing the poten-
tial region in which the reduction process takes place (at least 90/n mV beyond
the peak), the direction of the potential sweep is reversed. During the reverse
scan, R molecules (generated in the forward half-cycle, and accumulated near
the surface) are reoxidized back to O, resulting in an anodic peak.
30
STUDY OF ELECTRODE REACTIONS AND INTERFACIAL PROPERTIES
Forward
scan
Switching
potential
Reverse
scan
E
final
E
initial
Potential
Time
Cycle 1
Figure 2.1 Potential–time excitation signal in a cyclic voltammetric experiment.
Forward scan
OR
Reverse scan
OR
Potential
Anodic Current Cathodic
–0.3 –0.7
Figure 2.2 Typical cyclic voltammogram for a reversible O + ne
−
ª R redox process.
The characteristic peaks in the cycle voltammogram are caused by the for-
mation of the diffusion layer near the electrode surface. These can be best
understood by carefully examining the concentration–distance profiles during
the potential sweep (see Section 1.2.1.2). For example, Figure 2.3 illustrates
four concentration gradients for the reactant and product at different times
corresponding to (a) the initial potential value, (b,c) the formal potential of
the couple (during the forward and reversed scans, respectively), and (c) the
achievement of a zero-reactant surface concentration. Note that the continu-
ous change in the surface concentration is coupled with an expansion of the
diffusion-layer thickness (as expected in quiescent solutions). The resulting
current peaks thus reflect the continuous change of the concentration gradi-
ent with time. Hence, the increase in the peak current corresponds to the
achievement of diffusion control, while the current drop (beyond the peak)
CYCLIC VOLTAMMETRY
31
(a)
(b)
(c)
(d)
C
O
C
R
Figure 2.3 Concentration distribution of the oxidized and reduced forms of the
redox couple at different times during a cyclic voltammetric experiment corresponding
to the initial potential (a), to the formal potential of the couple during the forward
and reversed scans (b,d), and to the achievement of a zero-reactant surface
concentration (c).
exhibits a t
−1/2
dependence (independent of the applied potential). For these
reasons, the reversal current has the same shape as does the forward one. As
will be discussed in Chapter 4, the use of ultramicroelectrodes—for which the
mass transport process is dominated by radial (rather than linear) diffusion—
results in a sigmoid-shaped cyclic voltammogram.
2.1.1 Data Interpretation
The cyclic voltammogram is characterized by several important parameters.
Four of these observables, the two peak currents and two peak potentials,
provide the basis for the diagnostics developed by Nicholson and Shain (1)
for analyzing the cyclic voltammetric response.
2.1.1.1 Reversible Systems The peak current for a reversible couple (at
25°C) is given by the Randles–Sevcik equation
(2.1)
where n is the number of electrons, A the electrode area (in cm
2
), C the con-
centration (in mol/cm
3
), D the diffusion coefficient (in cm
2
/s), and v the poten-
tial scan rate (in V/s). Accordingly, the current is directly proportional to
concentration and increases with the square root of the scan rate. Such
dependence on the scan rate is indicative of electrode reaction controlled by
mass transport (semiinfinite linear diffusion). The reverse-to-forward peak
current ratio, i
p,r
/i
p,f
, is unity for a simple reversible couple. As will be discussed
in the following sections, this peak ratio can be strongly affected by chemical
reactions coupled to the redox process.The current peaks are commonly meas-
ured by extrapolating the preceding baseline current.
The position of the peaks on the potential axis (E
p
) is related to the formal
potential of the redox process. The formal potential for a reversible couple is
centered between E
p,a
and E
p,c
:
(2.2)
The separation between the peak potentials (for a reversible couple) is
given by
(2.3)
Thus, the peak separation can be used to determine the number of electrons
transferred, and as a criterion for a Nernstian behavior. Accordingly, a fast
one-electron process exhibits a ∆E
p
of about 59mV. Both the cathodic and
∆EE E
n
p p,a p,c
V=−=
0 059.
E
EE
°=
+
p,a p,c
2
i n ACD v
p
=×
()
269 10
532 1212
.
32
STUDY OF ELECTRODE REACTIONS AND INTERFACIAL PROPERTIES
anodic peak potentials are independent of the scan rate. It is possible to relate
the half-peak potential (E
p/2
, where the current is half of the peak current) to
the polarographic half-wave potential, E
1/2
:
(2.4)
(The sign is positive for a reduction process.)
For multielectron transfer (reversible) processes, the cyclic voltammogram
consists of several distinct peaks, if the E° values for the individual steps are
successively higher and are well separated. An example of such a mechanism
is the six-step reduction of the fullerenes C
60
and C
70
to yield the hexaanion
products C
60
6−
and C
70
6−
. Such six successive reduction peaks are observed in
Figure 2.4.
The situation is very different when the redox reaction is slow or coupled
with a chemical reaction. Indeed, it is these “nonideal” processes that are
usually of greatest chemical interest and for which the diagnostic power of
EE
n
p
V
212
0 028
=±
.
CYCLIC VOLTAMMETRY
33
Potential (V vs. Fc/Fc
+
)
10 mA
5 mA
(a)
(b)
C
60
C
70
–1.0 –2.0 –3.0
–1.0 –2.0 –3.0
Figure 2.4 Cyclic voltammetry of C
60
and C
70
in an acetonitrile/toluene solution.
(Reproduced with permission from Ref. 2.)
cyclic voltammetry is most useful. Such information is usually obtained by
comparing the experimental voltammograms with those derived from theo-
retical (simulated) ones (1). Proper compensation of the ohmic drop (see
Section 4.4) is crucial for such diagnostic applications of cyclic voltammetry.
2.1.1.2 Irreversible and Quasi-reversible Systems For irreversible
processes (those with sluggish electron exchange), the individual peaks are
reduced in size and widely separated (Fig. 2.5, curve A). Totally irreversible
systems are characterized by a shift of the peak potential with the scan rate:
(2.5)
where α is the transfer coefficient and n
a
is the number of electrons involved
in the charge transfer step. Thus, E
p
occurs at potentials higher than E°, with
the overpotential related to k° and α. Independent of the value k°, such peak
displacement can be compensated by an appropriate change of the scan rate.
The peak potential and the half-peak potential (at 25°C) will differ by 48/αn
mV. Hence, the voltammogram becomes more drawn-out as αn decreases.
The peak current, given by
(2.6)
is still proportional to the bulk concentration, but will be lower in height
(depending on the value of α. Assuming an value of 0.5, the ratio of the
reversible-to-irreversible current peaks is 1.27 (i.e., the peak current for the
irreversible process is about 80% of the peak for a reversible one).
i n n ACD v
pa
=×
()
()
299 10
5
12
12 12
. α
EE
RT
nF
nFv
RT
p
a
a
k
D
=°− −
°
+
α
α
078
12
12
.ln ln
34
STUDY OF ELECTRODE REACTIONS AND INTERFACIAL PROPERTIES
B
A
i
0
E
° E
Figure 2.5 Cyclic voltammograms for irreversible (curve A) and quasi-reversible
(curve B) redox processes.
For quasi-reversible systems (with 10
−1
> k° > 10
−5
cm/s) the current is con-
trolled by both the charge transfer and mass transport.The shape of the cyclic
voltammogram is a function of (where a = nFv/RT). As
increases, the process approaches the reversible case. For small values of
(i.e., at very fast v), the system exhibits an irreversible behavior.
Overall, the voltammograms of a quasi-reversible system are more drawn out
and exhibit a larger separation in peak potentials compared to a reversible
system (Fig. 2.5, curve B).
2.1.2 Study of Reaction Mechanisms
One of the most important applications of cyclic voltammetry is for qualita-
tive diagnosis of chemical reactions that precede or succeed the redox process
(1). Such reaction mechanisms are commonly classified by using the letters E
and C (for the redox and chemical steps, respectively) in the order of the steps
in the reaction scheme. The occurrence of such chemical reactions, which
directly affect the available surface concentration of the electroactive species,
is common to redox processes of many important organic and inorganic com-
pounds. Changes in the shape of the cyclic voltammogram, resulting from the
chemical competition for the electrochemical reactant or product, can be
extremely useful for elucidating these reaction pathways and for providing
reliable chemical information about reactive intermediates.
For example, when the redox system is perturbed by a following chemical
reaction, namely, an EC mechanism
(2.7)
the cyclic voltammogram will exhibit a smaller reverse peak (because the
product R is chemically ‘removed’ from the surface). The peak ratio i
p,r
/i
p,f
will
thus be smaller than unity; the exact value of the peak ratio can be used to
estimate the rate constant of the chemical step. In the extreme case, the chem-
ical reaction may be so fast that all of R will be converted to Z, and no reverse
peak will be observed. A classical example of such an EC mechanism is the
oxidation of the drug chlorpromazine to form a radical cation that reacts with
water to give an electroinactive sulfoxide. Ligand exchange reactions (e.g., of
iron porphyrin complexes) occurring after electron transfer represent another
example of such a mechanism.
Additional information on the rates of these (and other) coupled chemical
reactions can be achieved by changing the scan rate (i.e. adjusting the exper-
imental time scale). In particular,the scan rate controls the time spent between
the switching potential and the peak potential (during which time the chemi-
cal reaction occurs). Hence, as illustrated in Figure 2.6, it is the ratio of the
rate constant (of the chemical step) to the scan rate that controls the peak
ratio. Most useful information is obtained when the reaction time lies within
the experimental time scale. For scan rates between 0.02 and 200V/s (common
OeRZ+→
−
n ∫
kaD°π
kaD°π
kaD°π
CYCLIC VOLTAMMETRY
35
with conventional electrodes), the accessible time scale is around 0.1–1000ms.
Ultramicroelectrodes (discussed in Section 4.5.4) offer the use of much faster
scan rates and hence the possibility of shifting the upper limit of follow-up
rate constants measurable by cyclic voltammetry (3). For example, highly reac-
tive species generated by the electron transfer, and alive for 25 ns, can be
detected using a scan rate of 10
6
V/s. A wide variety of fast reactions (includ-
ing isomerization and dimerization) can thus be probed.The extraction of such
information commonly requires background subtraction to correct for the
large charging-current contribution associated with ultrafast scan rates.
A special case of the EC mechanism is the catalytic regeneration of O
during the chemical step:
(2.8)
(2.9)
An example of such a catalytic EC process is the oxidation of dopamine in
the presence of ascorbic acid (4). The dopamine quinone formed in the redox
step is reduced back to dopamine by the ascorbate ion.The peak ratio for such
a catalytic reaction is always unity.
RA O+ ∫
OeR+
−
n ∫
36
STUDY OF ELECTRODE REACTIONS AND INTERFACIAL PROPERTIES
0.1
0.01
500 10
0.1, 0.01
k
/a =
O + ne R Z
Current function
0.4
0.2
0.0
–0.2
180 120 60 0 –60
(E – E
1/2
)n (mV)
k
Figure 2.6 Cyclic voltammograms for a reversible electron transfer followed by an
irreversible step for various ratios of chemical rate constant to scan rate k/a, where a
= nFv/RT. (Reproduced with permission from Ref. 1.)
Other reaction mechanisms can be elucidated in a similar fashion. For
example, for a CE mechanism, where a slow chemical reaction precedes the
electron transfer,the ratio of i
p,r
/i
p,f
is generally larger than one, and approaches
unity as the scan rate decreases. The reverse peak is seldom affected by the
coupled reaction,while the forward one is no longer proportional to the square
root of the scan rate.
ECE processes, with a chemical step being interposed between electron
transfer steps
(2.10)
are also easily explored by cyclic voltammetry, because the two redox couples
can be observed separately.The rate constant of the chemical step can thus be
estimated from the relative sizes of the two cyclic voltammetric peaks.
Many anodic oxidations involve an ECE pathway. For example, the neuro-
transmitter epinephrine can be oxidized to its quinone, which proceeds via
cyclization to leucoadrenochrome. The latter can rapidly undergo electron
transfer to form adrenochrome (5). The electrochemical oxidation of aniline
is another classical example of an ECE pathway (6). The cation radical thus
formed rapidly undergoes a dimerization reaction to yield an easily oxidized
p-aminodiphenylamine product. Another example (of industrial relevance) is
the reductive coupling of activated olefins to yield a radical anion, which reacts
with the parent olefin to give a reducible dimer (7). If the chemical step is very
fast (in comparison to the electron transfer process), the system behaves as an
EE mechanism (of two successive charge transfer steps).Table 2.1 summarizes
common electrochemical mechanisms involving coupled chemical reactions.
Powerful cyclic voltammetric computational simulators, exploring the behav-
ior of virtually any user-specific mechanism have been developed (9). Such
simulated voltammograms can be compared with and fitted to the experi-
mental ones.The new software also provides “movie”-like presentations of the
corresponding continuous changes in the concentration profiles.
2.1.3 Study of Adsorption Processes
Cyclic voltammetry can also be used for evaluating the interfacial behavior of
electroactive compounds. Both reactant and product can be involved in an
adsorption–desorption process. Such interfacial behavior can occur in studies
of numerous organic compounds, as well as of metal complexes (if the ligand
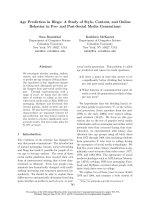
is specifically adsorbed). For example, Figure 2.7 illustrates repetitive cyclic
voltammograms, at the hanging mercury drop electrode, for riboflavin in a
sodium hydroxide solution. A gradual increase of the cathodic and anodic
peak currents is observed, indicating progressive adsorptive accumulation at
the surface. Note also that the separation between the peak potentials is
smaller than expected for solution-phase processes. Indeed, ideal Nernstian
behavior of surface-confined nonreacting species is manifested by symmetric
OeROeR
112 2
+→+→
−−
nn∫
CYCLIC VOLTAMMETRY
37
cyclic voltammetric peaks (∆E
p
= 0), and a peak half-width of 90.6/n mV (Fig.
2.8). The peak current is directly proportional to the surface coverage (Γ) and
potential scan rate:
(2.11)
i
nF Av
RT
p
=
22
4
Γ
38
STUDY OF ELECTRODE REACTIONS AND INTERFACIAL PROPERTIES
TABLE 2.1 Electrochemical Mechanisms Involving Coupled Chemical Reactions
1. Reversible electron transfer, no chemical complications:
O + ne
−
∫ R
2. Reversible electron transfer followed by a reversible chemical reaction—E
r
C
r
mechanism:
O + ne
−
∫ R
3. Reversible electron transfer followed by an irreversible chemical reaction—E
r
C
i
mechanism:
O + ne
−
∫ R
4. Reversible chemical reaction preceding a reversible electron transfer—C
r
E
r
mechanism:
O + ne
−
∫ R
5. Reversible chemical reaction preceding an irreversible electron transfer—C
r
E
i
mechanism:
O + ne
−
∫ R
6. Reversible electron transfer followed by an irreversible regeneration of starting
materials—catalytic mechanism:
O + ne
−
∫ R
7. Irreversible electron transfer followed by an irreversible regeneration of starting
material:
O + ne
−
∫ R
8. Multiple electron transfer with intervening chemical reaction—ECE mechanism:
O + n
1
e
−
∫ R R ∫ Y
Y + n
2
e
−
∫ Z
Source: Adapted with permission from Ref. 8.
k
R+Z O↔
k
R+Z O↔
k
k
1
1
ZO↔
−
k
k
1
1
ZO↔
−
k
R Z↔
k
k
1
1
R Z↔
−
Recall that a Nernstian behavior of diffusing species yields a v
1/2
dependence.
In practice, the ideal behavior is approached for relatively slow scan rates, and
for an adsorbed layer that shows no intermolecular interactions and fast elec-
tron transfers.
The peak area at saturation (i.e., the quantity of charge consumed
during the reduction or adsorption of the adsorbed layer) can be used to
calculate the surface coverage:
(2.12)
This can be used for calculating the area occupied by the adsorbed molecule
and hence to predict its orientation on the surface. The surface coverage is
commonly related to the bulk concentration via the adsorption isotherm. One
of the most frequently used at present is the Langmuir isotherm
(2.13)
ΓΓ=
+
m
BC
BC1
Q = nFAΓ
CYCLIC VOLTAMMETRY
39
–0.2 –0.4 –0.6 –0.8
E (V)
–0.2
–0.1
0
0.1
0.2
i (mA)
1
Figure 2.7 Repetitive cyclic voltammograms for 1 × 10
−6
M riboflavin in a 1mM
sodium hydroxide solution. (Reproduced with permission from Ref. 10.)
where Γ
m
is the surface concentration corresponding to a monolayer coverage
(mol/cm
2
) and B is the adsorption coefficient.A linearized isotherm, Γ=Γ
m
BC,
is obtained for low adsorbate concentrations (i.e., when 1 >> BC). The Lang-
muir isotherm is applicable to a monolayer coverage and assumes that there
are no interactions between adsorbed species. Other isotherms (e.g., of
Frumkin or Temkin) take into account such interactions. Indeed, the Langmuir
isotherm is a special case of the Frumkin isotherm when no interactions exist.
When either the reactant (O) or the product (R) (but not both) is adsorbed,
one expects to observe a postpeak or prepeak, respectively (at potentials more
negative or positive than the diffusion-controlled peak).
Equations have been derived for less ideal situations, involving quasi- and
irreversible adsorbing electroactive molecules and different strengths of
adsorption of the reactant and product (11–14). The rates of fast adsorption
40
STUDY OF ELECTRODE REACTIONS AND INTERFACIAL PROPERTIES
+100 0 –100
+50 –50
n(E – E
°
surf
) (mV)
G =
DE
p
,
Q
nFA
1
2
Figure 2.8 Ideal cyclic voltammetric behavior for a surface layer on an electrode.The
surface coverage Γ can be obtained from the area under the peak. (Reproduced with
permission from Ref. 11.)
processes can be characterized by high-speed cyclic voltammetry at ultrami-
croelectrodes (15).
Two general models can describe the kinetics of adsorption. The first model
involves fast adsorption with mass transport control, while the other involves
kinetic control of the system. Under the latter (and Langmuirian) conditions,
the surface coverage of the adsorbate at time t, Γ
t
, is given by
(2.14)
where Γ
e
is the surface coverage and k′ is the adsorption rate constant.
The behavior and performance of chemically modified electrodes based on
surface-confined redox modifiers and conducting polymers (Chapter 4), can
also be investigated by cyclic voltammetry, in a manner similar to that for
adsorbed species. For example, Figure 2.9 illustrates the use of cyclic voltam-
metry for in situ probing of the growth of an electropolymerized film. Changes
in the cyclic voltammetric response of a redox marker (e.g., ferrocyanide) are
commonly employed for probing the blocking/barrier properties of insulating
films (such as self-assembled monolayers).
2.1.4 Quantitative Applications
Cyclic voltammetry can be useful also for quantitative purposes, based on
measurements of the peak current [Eq. (2.1)]. Such quantitative applications
ΓΓ
t
kCt=−−
′
()()
et
1 exp
CYCLIC VOLTAMMETRY
41
0 0.5
Potential (V)
Current
1
st
Figure 2.9 Repetitive cyclic voltammograms illustrating the continuous growth of
polyaniline on a platinum surface.
require the establishment of the proper baseline. For neighboring peaks (of a
mixture), the baseline for the second peak is obtained by extrapolating the
current decay of the first one (in accordance to t
−1/2
). Background reactions,
primarily those associated with the double-layer charging and redox surface
processes, limit the detection limit to around the 1 × 10
−5
M level. Background-
subtracted cyclic voltammetry can be employed for measuring lower concen-
trations (16). In particular, fast-scan (500–1000-V/s) background-subtracted
cyclic voltammetry at carbon fiber microelectrodes is seeing increased use for
the in vivo monitoring of neurotransmitters (such as dopamine or serotonin)
in the human brain (17). Such coupling of digital background subtraction and
fast voltammetric measurements provides the subsecond temporal resolution
necessary for detecting dynamic concentration changes in the micromolar
range occurring in the extracellular environment of the brain. The good tem-
poral and chemical resolutions of such in vivo cyclic voltammetric experiments
offer improved understanding of the chemistry of the brain. These repetitive
scanning in vivo experiments generate large quantities of data, which are best
represented as three-dimensional (potential, current, time) color contour
images (18). For example, the temporal release of dopamine following an elec-
trical stimulation is evidenced from the rapid increase in color around its peak
potential.The ultrafast scanning also eliminates interferences from adsorption
processes and chemical reactions that are coupled to the primary oxidation
reaction of catecholamine neurotransmitters (19):
(2.15)
For more detailed information on the theory of cyclic voltammetry, and the
interpretation of cyclic voltammograms, see Refs. 1, 7, 20, and 21.
2.2 SPECTROELECTROCHEMISTRY
The coupling of optical and electrochemical methods, spectroelectrochemistry,
has been employed since the early 1980s to investigate a wide variety of inor-
ganic, organic, and biological redox systems (22,23). Such a combination of
electrochemical perturbations with the molecular specificity of optical moni-
toring successfully addresses the limited structural information available from
the current response. It can be extremely useful for the elucidation of reac-
tion mechanisms, and for the delineation of kinetic and thermodynamic
parameters. A variety of informative optical methods have thus been coupled
with electrochemical techniques. While the following sections will focus pri-
marily on transmission absorption UV–vis (ultraviolet–visible) spectroscopic
procedures, powerful spectroelectrochemical data can be obtained in reflec-
+ 2H
+
+ 2e
–
HO
R
R
HO
O
O
42
STUDY OF ELECTRODE REACTIONS AND INTERFACIAL PROPERTIES
tance experiments (in which the light beam is reflected from the electrode
surface), using vibrational spectroscopic investigations, as well as from lumi-
nescence and scattering spectrochemical studies.
2.2.1 Experimental Arrangement
Optically transparent electrodes (OTEs), which enable light to be passed
through their surface and the adjacent solution, are the key for performing
transmission spectroelectrochemical experiments. One type of OTE consists
of a metal (gold, silver, nickel) micromesh containing small (10–30-µm) holes,
which couples good optical transmission (over 50%) with good electrical con-
ductivity. Such a minigrid is usually sandwiched between two microscopic
slides, which form a thin-layer cell (Fig. 2.10). The resulting chamber, contain-
ing the electroactive species in solution, contacts a larger container that holds
the reference and auxiliary electrodes. The OTE is placed in the spectropho-
tometer so that the optical beam is passed directly through the transparent
electrode and the solution. The working volume of the cell is only 30–50µL,
and complete electrolysis of the solute requires only 30–60s. Alternately, the
OTE may consist of a thin (100–5000-Å) film of a metal (e.g., gold, platinum)
or a semiconductor (e.g., tin oxide), deposited on a transparent material such
as quartz or glass substrate. The film thickness is often selected as a compro-
mise between its electrical conductivity and optical transmission.
Improvements in cell design have been reported, including the use of
fiber optics for the illumination and collection of light near electrode surfaces
(24), the fabrication of long-pathlength OTEs via drilling of a small hole
through a solid conducting material for sensitive optical monitoring of weakly
absorbing species (25,26), and the incorporation of open porous materials
(particularly reticulated vitreous carbon) within a thin-layer compartment
(27).
SPECTROELECTROCHEMISTRY
43
Photon beam
Reference and auxiliary
electrodes
OTE
Detector
Figure 2.10 Thin-layer spectroelectrochemical cell.