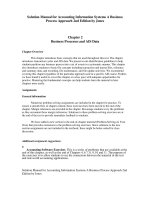
Solution manual for project management analytics a data driven approach to making rational and effective project decisions 1st edition singh
Bạn đang xem bản rút gọn của tài liệu. Xem và tải ngay bản đầy đủ của tài liệu tại đây (688.01 KB, 37 trang )
Project Management
Analytics
A Data-Driven Approach to Making
Rational and Effective
Project Decisions
Harjit Singh, MBA, PMP, CSM
Data Processing Manager III, State of California
1
Project Management Analytics
Learning Objectives
After reading this chapter, you should be familiar with the
■
Definition of analytics
■
Difference between analytics and analysis
■
Purpose of using analytics in project management
■
Applications of analytics in project management
■
Statistical approach to project management analytics
■
Lean Six Sigma approach to project management analytics
■
Analytic Hierarchy Process approach to project management analytics
“Information is a source of learning. But unless it is organized, processed, and available
to the right people in a format for decision making, it is a burden, not a benefit.”
—William Pollard (1828–1893), English Clergyman
Effective project management entails operative management of uncertainty on the project. This requires the project managers today to use analytical techniques to monitor and
control the uncertainty as well as to estimate project schedule and cost more accurately
with analytics-driven prediction. Bharat Gera, Line Manager at IBM agrees, “Today,
project managers need to report the project metrics in terms of ‘analytical certainty.’”
Analytics-based project metrics can essentially enable the project managers to measure, observe, and analyze project performance objectively and make rational project
decisions with analytical certainty rather than making vague decisions with subjective
uncertainty. This chapter presents you an overview of the analytics-driven approach to
project management.
1
What Is Analytics?
Analytics (or data analytics) can be defined as the systematic quantitative analysis of data
or statistics to obtain meaningful information for better decision-making. It involves the
collective use of various analytical methodologies, including but not limited to statistical
and operational research methodologies, Lean Six Sigma, and software programming.
The computational complexity of analytics may vary from low to very high (for example,
big data). The highly complex applications usually utilize sophisticated algorithms based
on statistical, mathematical, and computer science knowledge.
Analytics versus Analysis
Analysis and analytics are similar-sounding terms, but they are not the same thing. They
do have some differences.
Both are important to project managers. They (project managers) can use analysis to
understand the status quo that may reflect the result of their efforts to achieve certain
objectives. They can use analytics to identify specific trends or patterns in the data under
analysis so that they can predict or forecast the future outcomes or behaviors based on
the past trends.
Table 1.1 outlines the key differences between analytics and analysis.
Table 1.1
Analytics vs. Analysis
Criterion
Analytics
Analysis
Working
Definition
Analytics can be defined as a
method to use the results of
analysis to better predict customer or stakeholder behaviors.
Analysis can be defined as the
process of dissecting past gathered
data into pieces so that the current (prevailing) situation can be
understood.
Dictionary
Definition
Per Merriam-Webster dictionary, analytics is the method of
logical analysis.
Per Merriam-Webster dictionary,
analysis is the separation of a whole
into its component parts to learn
about those parts.
Time Period
Analytics look forward to
project the future or predict
an outcome based on the past
performance as of the time of
analysis.
Analysis presents a historical view
of the project performance as of the
time of analysis.
2
Project Management Analytics
Criterion
Analytics
Analysis
Examples
Use analytics to predict which
functional areas are more
likely to show adequate participation in future surveys so
that a strategy can be developed to improve the future
participation.
Use analysis to determine how
many employees from each functional area of the organization participated in a voice of the workforce
survey.
Types of Analysis
Prediction of future audience
behaviors based on their past
behaviors
Target audience segmentation
Statistical, mathematical, computer science, and Lean Six
Sigma tools, and techniquesbased algorithms with advanced
logic
Business intelligence tools
Tools
Target audience grouping based on
multiple past behaviors
Structured query language (SQL)
Sophisticated predictive analytics software tools
Typical Activities
Identify specific data patterns
Develop a business case
Derive meaningful inferences
from data patterns
Elicit requirements
Document requirements
Use inferences to develop regres- Conduct risk assessment
sive/predictive models
Model business processes
Use predictive models
Develop business architecture
for rational and effective
decision-making
Develop a SharePoint list to track
key performance indicators
Run SQL queries on a data warehouse to extract relevant data for
reporting
Run simulations to investigate
different scenarios
Use statistical methods to predict
future sales based on past sales
data
Chapter 1 Project Management Analytics
3
Why Is Analytics Important in Project Management?
Although switching to the data-driven approach and utilizing the available analytical
tools makes perfect sense, most project managers either are not aware of the analytical
approach or they do not feel comfortable moving away from their largely subjective
legacy approach to project management decision-making. Their hesitation is related to
lack of training in the analytical tools, technologies, and processes. Most project management books only mention these tools, technologies, and processes in passing and do not
discuss them adequately and in an easily adaptable format. Even the Project Management
Body of Knowledge Guide (PMBOK), which is considered the global standard for project management processes, does not provide adequate details on an analytics-focused
approach.
The high availability of analytical technology today can enable project managers to use
the analytics paradigm to break down the processes and systems in complex projects to
predict their behavior and outcomes. Project managers can use this predictive information to make better decisions and keep projects on schedule and on budget. Analytics
does more than simply enable project managers to capture data and mark the tasks done
when completed. It enables them to analyze the captured data to understand certain
patterns or trends. They can then use that understanding to determine how projects
or project portfolios are performing, and what strategic decisions they need to make to
improve the success rate if the measured/observed project/portfolio performance is not
in line with the overall objectives.
How Can Project Managers Use Analytics in Project
Management?
Analytics finds its use in multiple areas throughout the project and project management
life cycles. The key applications of analytics in this context include, but are not limited
to, the following:
Assessing feasibility: Analytics can be used to assess the feasibility of various alternatives
so that a project manager can pick the best option.
Managing data overload: Due to the contemporary Internet age, data overload has
crippled project managers’ capability to capture meaningful information from mountains of data. Analytics can help project managers overcome this issue.
Enhancing data visibility and control via focused dashboards: An analytics dashboard
can provide a project manager a single view to look at the big picture and determine
both how each project and its project team members are doing. This information comes
4
Project Management Analytics
in handy for prioritizing project tasks and/or moving project team members around to
maximize productivity.
Analyzing project portfolios for project selection and prioritization: Project portfolio
analysis is a useful application of analytics. This involves evaluating a large number of
project proposals (or ideas) and selecting and prioritizing the most viable ones within
the constraints of organizational resources and other relevant factors.
Across all project organizations in general, but in a matrix organization in particular, multiple projects compete for finite resources. Organizations must select projects
carefully after complete assessment of each candidate project’s feasibility based on the
organization’s project selection criteria, which might include, but not be limited to, the
following factors:
■
Technical, economic, legal, political, capacity, and capability constraints
■
Cost-benefits analysis resulting in scoring based on various financial models
such as:
■
■
Net present value (NPV)1
■
Return on investment (ROI)2
■
Payback period3
■
Breakeven analysis4
Resource requirements
■
Internal resources (only functional department resources, cross-functional
resources, cross-organizational resources, or any combination of the preceding)
■
External resources
■
Both internal and external resources
■
Project complexity
■
Project risks
■
Training requirements
1
NPV is used to compare today’s investment with the present value of the future cash flows after those
cash flows are discounted by a certain rate of return.
2
ROI = Net Profit / Total Investment
Payback period is the time required to recoup the initial investment in terms of savings or profits.
Breakeven analysis determines the amount of revenue needed to offset the costs incurred to earn that
revenue.
3
4
Chapter 1 Project Management Analytics
5
Analytics can help organizations with selecting projects and prioritizing shortlisted projects for optimal allocation of any scarce and finite resources.
Improve project stakeholder management: Analytics can help improve project stakeholder management by enabling a project manager to predict stakeholder responses to
various project decisions. Project stakeholder management is both art and science—art
because it depends partly on the individual skillset, approach, and personality of the
individual project manager, and science because it is a highly data-driven process. Project managers can use analytics to predict the outcomes of the execution of their strategic
plans for stakeholder engagement management and to guide their decisions for appropriate corrective actions if they find any discrepancy (variance) between the planned and
the actual results of their efforts.
Project stakeholder management is much like customer relationship management
(CRM5) in marketing because customers are essentially among the top-level project
stakeholders and project success depends on their satisfaction and acceptance of the
project outcome (product or service). Demographic studies, customer segmentation,
conjoint analysis, and other techniques allow marketers to use large amounts of consumer purchase, survey, and panel data to understand and communicate marketing
strategy. In his paper “CRM and Stakeholder Management,” Dr. Ramakrishnan (2009)
discusses how CRM can help with effective stakeholder management. According to him,
there are seven Cs of stakeholder management:
1. Concern
2. Communicate
3. Contribute
4. Connect
5. Compound
6. Co-Create
7. Complete
Figure 1.1 illustrates the seven Cs of stakeholder management.
The seven Cs constitute seven elements of the project stakeholder management criteria,
which can be evaluated for their relative importance or strength with respect to the goal
5
6
CRM refers to a process or methodology used to understand the needs and behaviors of customers so
that relationships with them can be improved and strengthened.
Project Management Analytics
of achieving effective stakeholder management by utilizing the multi-criteria evaluation
capability of the Analytic Hierarchy Process (AHP).6
Understand and address
stakeholder concerns
Engage in communication with
stakeholders
Connect
Concern
Communicate
Create value for stakeholders to
meet their needs and
expectations
7 Cs of Project
Stakeholder
Management
Contribute
Interact with stakeholders
Compound
Use the blend of Concern,
Communicate, Contribute,
and Connect to create synergy
Co-Create
Engage stakeholders in
decision-making throughout
the project life cycle
Complete
Follow through with
stakeholders through the
complete project life cycle
Figure 1.1 Seven Cs of Project Stakeholder Management
Web analytics can also help managers analyze and interpret data related to the online
interactions with the project stakeholders. The source data for web analytics may include
personal identification information, search keywords, IP address, preferences, and various other stakeholder activities. The information from web analytics can help project
managers use the adaptive approach7 to understand the stakeholders better, which in
turn can further help them customize their communications according to the target
stakeholders.
Predict project schedule delays and cost overruns: Analytics can tell a project manager
whether the project is on schedule and whether it’s under or over budget. Also, analytics
can enable a project manager to predict the impact of various completion dates on the
bottom line (project cost). For example, Earned Value Analytics (covered in Chapter 8,
“Statistical Applications in Project Management”) helps project managers avoid surprises
by helping them proactively discover trends in project schedule and cost performance.
Manage project risks: Another area in a project’s life cycle where analytics can be
extremely helpful is the project risk management area. Project risk identification, ranking, and prioritization depend upon multiple factors, including at least the following:
■
Size and complexity of the project
■
Organization’s risk tolerance
■
Risk probability, impact, and horizon
■
Competency of the project or risk manager
6
Read Chapter 6, “Analytical Hierarchy Process,” to learn about AHP.
7
The process of gaining knowledge by adapting to the new learning for better decision-making.
Chapter 1 Project Management Analytics
7
Predictive analytics models can be used to analyze those multiple factors for making
rational decisions to manage the risks effectively.
Improve project processes: Project management involves the execution of a multitude
of project processes. Thus, continuous process improvement is essential for eliminating waste and improving the quality of the processes and the product of the project.
Improvement projects typically involve four steps:
1. Understand the current situation.
2. Determine the desired (target) future situation.
3. Perform gap analysis (find the delta between the target and the current situations).
4. Make improvement decisions to address the gap.
Analytics can help project managers through all four process improvement steps by
enabling the use of a “Project Management —Lean Six Sigma” blended or hybrid methodology for managing the projects with embedded continuous improvement.
Project Management Analytics Approach
The project management analytics approach can vary from organization to organization and even from project to project. It depends on multiple factors including, but not
limited to, organizational culture; policies and procedures; project environment; project
complexity; project size; available resources; available tools and technologies; and the
skills, knowledge, and experience of the project manager or project/business analysts.
This book covers the following approaches to project management analytics:
■
Statistical
■
Lean Six Sigma
■
Analytic Hierarchy Process
You will look at the application of each of these approaches and the possible combination
of two or more of these approaches, depending upon the project characteristics.
Statistical Approach
“Lies, damned lies, and statistics!
Nothing in progression can rest on its original plan.”
—Thomas S. Monson (American religious leader and author)
8
Project Management Analytics
Throughout the project life cycle, project managers must deal with a large number of
uncertainties. For instance, project risks are uncertainties that can derail the project
if they are not addressed in a timely and effective way. Similarly, all project baselines
(plans) are developed to deal with the uncertain future of the project. That’s why the
project plans are called living documents because they are subject to change based on
future changes. Because picturing the future precisely is hard, best estimates are used to
develop the project plans.
Statistical approach comes in handy when dealing with project uncertainties because it
includes tools and techniques that managers can deploy to interpret specific patterns
in the data pertaining to the project management processes to predict the future more
accurately.
Quantitative measure of a process, when that process is performed over and over, is
likely to follow a certain frequency pattern of occurrence. In other words, there is a
likelihood or probability of recurrence of the same quantitative measure in the long
run. This likelihood or probability represents the uncertainty of recurrence of a certain
quantitative value of the process. Statistical analysis can help predict certain behaviors
of the processes or systems in the environment of uncertainty, which is fundamental to
data-driven decision-making.
We use the following analytical probability distributions to illustrate how a statistical
approach can help in effective decision-making in project management:
■
Normal distribution
■
Poisson distribution
■
Uniform distribution
■
Triangular distribution
■
Beta distribution
Normal Distribution
Depicted in Figure 1.2, the normal distribution is the most common form of the probability density function. Due to its shape, it is also referred to as the bell curve. In this
distribution, all data values are symmetrically distributed around the mean of the probability. The normal distribution method constitutes a significant portion of the statistical content that this book covers because the project management processes involve a
number of normal events.8
8
For example, project selection criteria scores, stakeholders’ opinions, labor wages, project activity
duration, project risk probability, and so on.
Chapter 1 Project Management Analytics
9
- 3
- 2
- 1
+ 1
+ 2
+ 3
Figure 1.2 Normal Distribution
Normal distribution is the result of the process of accumulation. Usually, the sum or
average of the outcomes of various uncertainties constitutes an outcome whose probability distribution is a normal distribution.
For data with a normal distribution, the standard deviation has the following
characteristics:9
9
10
■
68.27% of the data values lie within one standard deviation of the mean.
■
95.45% of the data values lie within two standard deviations of the mean.
■
99.73% of the data values lie within three standard deviations of the mean.
This is also known as the empirical rule.
Project Management Analytics
Poisson Distribution
Poisson distribution is the result of the process of counting. Figure 1.3 depicts the shape
of a typical Poisson distribution curve.
0.2
0.18
0.16
0.14
0.12
0.1
0.08
0.06
0.04
0.02
0
0
5
10
15
20
25
30
Figure 1.3 Poisson Distribution
This distribution can be used to count the number of successes or opportunities as a
result of multiple tries within a certain time period. For example, it can be used to count
■
The number of projects human resources acquired in a period of two months
■
The number of project milestones completed in a month
■
The number of project tasks completed in a given week
■
The number of project change requests processed in a given month
Chapter 4, “Statistical Fundamentals I,” covers the Poisson distribution in more depth
and examines how this distribution can be used in project management to count discrete,10 countable, independent events.
10
Discrete random variables are small in number and can be counted easily. For example, if a random
variable represents the output of tossing a coin, then it is a discrete random variable because there are
just two possible outcomes—heads or tails.
Chapter 1 Project Management Analytics
11
Uniform Distribution
Illustrated in Figure 1.4, a uniform distribution is also referred to as a rectangular distribution with constant probability.
f(x)
1
b–a
a
b
x
Figure 1.4 Uniform Distribution
The area of the rectangle is equal to the product of its length and its width.
Thus, the area of the rectangle equals (b – a) * 1/ (b – a) = 1.
What does this mean? This means that for a continuous11 random variable, the area
under the curve is equal to 1. This is true in the case of a discrete random variable as well
provided the values of the discrete random variable are close enough to appear almost
continuous.
The unit area under the curve in Figure 1.4 illustrates that relative frequencies or probabilities of occurrence of all values of the random variable, when integrated, are equal
to 1. That is:
11
12
When there are too many possible values for a random variable to count, such a random variable is
called a continuous random variable. The spacing between the adjacent values of the random variable is so small that it is hard to distinguish one value from the other and the pattern of those values
appears to be continuous.
Project Management Analytics
∫
b− a
all f ( X ) dX = 1
In this equation, dX is an increment along the x-axis and f(X) is a value on the y-axis.
Uniform distribution arbitrarily determines a two-point estimate of the highest and lowest values (endpoints of a range) of a random variable. This simplest estimation method
allows project managers to transform subjective data into probability distributions for
better decision-making especially in risk management.
Triangular Distribution
Unlike uniform distribution, the triangular distribution illustrates that the probability
of all values of a random variable are not uniform. Figure 1.5 shows the shape of a triangular distribution.
f(x)
2
b–a
a
c
b
x
Figure 1.5 Triangular Distribution
A triangular distribution is called so because of its triangular shape. It is based on three
underlying values: a (minimum value), b (maximum value), and c (peak value) and can
be used estimate the minimum, maximum, and most likely values of the outcome. It is
also called three-point estimation, which is ideal to estimate the cost and duration associated with the project activities more accurately by considering the optimistic, pessimistic,
and realistic values of the random variable (cost or duration). The skewed nature of this
Chapter 1 Project Management Analytics
13
distribution represents the imbalance in the optimistic and pessimistic values in an event.
Like all probability density functions, triangular distribution also has the property that
the area under the curve is 1.
Beta Distribution
The beta distribution depends on two parameters—α and β where α determines the center or steepness of the hump of the curve and β determines the shape and fatness of the
tail of the curve. Figure 1.6 shows the shape of a beta distribution.
␣ determines center or steepness of the hump
 determines the shape and fatness of the tail
0
1
Time t
Figure 1.6 Beta Distribution
Like triangular distribution, beta distribution is also useful in project management to
model the events that occur within an interval bounded by maximum and minimum
end values. You will learn how to use this distribution in PERT (Program Evaluation
and Review Technique) and CPM (Critical Path Method) for three-point estimation in
Chapter 8.
14
Project Management Analytics
Lean Six Sigma Approach
The Lean12 Six Sigma13 approach encompasses reduction in waste and reduction in variation (inaccuracy). For decisions to be rational and effective, they should be based on an
approach that promotes these things. That is the rationale behind the use of the Lean Six
Sigma approach in project management analytics.
NOTE
“Lean-Six Sigma is a fact-based, data-driven philosophy of improvement that values
defect prevention over defect detection. It drives customer satisfaction and bottomline results by reducing variation, waste, and cycle time, while promoting the use of
work standardization and flow, thereby creating a competitive advantage. It applies
anywhere variation and waste exist, and every employee should be involved.”
Source: American Society of Quality (ASQ). />six-sigma/lean.html
The goal of every project organization in terms of project outcome is SUCCESS, which
stands for
SMART14 Goals Established and Achieved
Under Budget Delivered Outcome
Communications Effectiveness Realized
Core Values Practiced
Excellence in Project Management Achieved
Schedule Optimized to Shorten Time to Delivery
Scope Delivered as Committed
The projects are typically undertaken to improve the status quo of a certain prevailing
condition, which might include an altogether missing functionality or broken functionality. This improvement effort involves defining the current (existing) and the target
conditions, performing gap analysis (delta between the target and the current condition),
12
The Lean concept, originated in Toyota Production System, Japan, focuses on reduction in waste.
13
The Six Sigma concept, originated in Motorola, USA, focuses on reduction in variation.
14
Specific, Measurable, Achievable, Realistic, and Timely
Chapter 1 Project Management Analytics
15
and understanding what needs to be done to improve the status quo. The change from the
current condition to the target condition needs to be managed through effective change
management. Change management is an integral part of project management and the
Lean Six Sigma approach is an excellent vehicle to implement changes successfully.
The DMAIC Cycle
Like the project management life cycle, Lean Six Sigma also has its own life cycle called
the DMAIC cycle. DMAIC stands for the following stages of the Lean Six Sigma life cycle:
Define
Measure
Analyze
Improve
Control
The DMAIC is a data-driven process improvement, optimization, and stabilization cycle.
All stages of the DMAIC cycle are mandatory and must be performed in the order from
“define” to “control.” Figure 1.7 depicts a typical DMAIC cycle.
Define
Measure
Measure Performance of
the Modified Process
Analyze
Modify
Process?
Improve
Control
No
N
Yes
Modify
Figure 1.7 DMAIC Cycle
The various stages of the DMAIC cycle are briefly described here (refer to Chapter 7,
“Lean Six Sigma,” for detailed discussion on the DMAIC cycle):
16
■
Define: Define the problem and customer requirements.
■
Measure: Measure the current performance of the process (establish baseline),
determine the future desired performance of the process (determine target), and
perform gap analysis (target minus baseline).
■
Analyze: Analyze observed and/or measured data and find root cause(s). Modify
the process if necessary but re-baseline the performance post-modification.
Project Management Analytics
■
Improve: Address the root cause(s) to improve the process.
■
Control: Control the future performance variations.
The PDSA Cycle
Project quality is an integral part of project management. The knowledge of Lean Six
Sigma tools and processes arms a project manager with the complementary and essential skills for effective project management. The core of Lean Six Sigma methodology is
the iterative PDSA (Plan, Do, Study, Act) cycle, which is a very structured approach to
eliminating or minimizing defects and waste from any process.
Figure 1.8 shows the PDSA cycle. We discuss this cycle as part of our discussion on the
applications of the Lean Six Sigma approach in project management.
PLAN
DO
ACT
STUDY
Figure 1.8 PDSA Cycle
Brief explanations of the building blocks of the PDSA cycle follow (refer to Chapter 7 for
detailed discussion on the PDSA cycle):
■
Plan: The development of the plan to carry out the cycle
■
Do: The execution of the plan and documentation of the observations
■
Study: The analysis of the observed and collected data during the execution of
the PDSA plan
■
Act: The next steps based on the analysis results obtained during study
Lean Six Sigma Tools
The Lean Six Sigma processes involve a lot of data collection and analysis. The various
tools used for this purpose include the following:
Chapter 1 Project Management Analytics
17
■
Brainstorming: To collect mass ideas on potential root causes
■
Surveys: To collect views of the individuals who are large in number and/or outside personal reach
■
Five whys: A method that asks five probing questions to identify the root cause
■
Value stream mapping: Process map analysis to identify wasteful process steps
■
Cause and effect or fishbone or Ishikawa diagram: A tool to help with brainstorming on the possible root causes
■
Control charts: To identify “common” and “special” causes in the stream of data
observed over a period of time
■
Correlation: To study the correlation between two variables
■
Cost-benefits analysis: To estimate the cost of implementing an improvement
plan and the benefits realized
■
Design of experiments: To identify the recipe for the best possible solution
■
Histograms: Unordered frequency (of defects) map
■
Pareto charts: Ordered (descending) frequency (of defects) map
■
Regression analysis: To study the effect of one variable with all other variables
held constant
■
Root cause analysis: Analysis to find the “cure” for a problem rather than just
“symptoms treatment”
■
Run charts: Observed data over a period of time
■
SIPOC15 chart: Process analysis to identify input and output interfaces to the
process
These tools are discussed in more detail in Chapter 7.
The Goal of Lean Six Sigma–Driven Project Management
Executing only those activities that are value adding, when they are needed, utilizing
minimum possible resources, without adversely impacting the quality, scope, cost,
and delivery time of the project.
15
18
SIPOC (Supplier, Input, Process, Output, Customer) is a process analysis tool.
Project Management Analytics
How Can You Use the Lean Six Sigma Approach in Project
Management?
We will examine a hybrid approach by blending the DMAIC cycle with the project management life cycle, which project managers can use to find the root cause(s) of the following project path holes and recommend the appropriate corrective actions to fix them.
■
Schedule delays
■
Project scope creep
■
Cost overruns
■
Poor quality deliverables
■
Process variation
■
Stakeholder dissatisfaction
Analytic Hierarchy Process (AHP) Approach
Proposed by Thomas L. Saaty in 1980, the AHP is a popular and effective approach to
multi-criteria-driven decision-making. According to Saaty, both tangible and intangible
factors should be considered while making decisions. “Decisions involve many intangibles that need to be traded off. To do that, they have to be measured alongside tangibles
whose measurements must also be evaluated as to how well they serve the objectives of
the decision maker,” says Saaty.
You can use the AHP approach in any scenario that includes multiple factors in decisionmaking. For example:
■
Deciding which major to select after high school
■
Deciding which university to select after high school
■
Deciding which car to select for buying
■
Deciding which projects to select for inclusion in the portfolio
Often in decision-making, the intangible factors are either overlooked or the decisions
are just made based on subjective or intuitional criteria alone. The AHP approach is a
360o approach, which includes both subjective and objective criteria in decision-making.
The key characteristic of this approach is that it uses pairwise comparisons16 of all the
possible factors of the complex problem at hand and evaluates their relative importance
to the decision-making process. For example, project management decision-making
16
Pairwise comparisons include comparison of each factor in the decision-making criteria against every
other factor in the criteria.
Chapter 1 Project Management Analytics
19
criteria may include three factors: schedule flexibility, budget flexibility, and scope flexibility. To make a decision, the project manager must consider the relative importance
of each of the three factors against every other factor in the criteria. Schedule, budget,
and scope are the triple constraints of project management and a tradeoff often has to
be made to find the right balance among them based on the business need and/or the
project environment. For instance, less flexibility in scope requires schedule, budget, or
both to be relatively more flexible.
Chapter 6 covers the AHP approach in more detail. This book makes extensive use of this
approach in recommending data-driven methodology for making the most effective and
rational project management decisions, including the following:
■
Project selection and prioritization
■
Project risk identification and assessment
■
Selection of project risk response strategy
■
Vendor selection
■
Project resource allocation optimization
■
Project procurement management
■
Project quality evaluation
Summary
The mind map in Figure 1.9 summarizes the project management analytics approach.
Why is Analytics
important in Project
Management?
What is
Analytics?
Analytics ( aka Data
Analytics) involves
the systematic
quantitative analysis
of data or statistics to
obtain meaningful
information for better
decision-making
Analytics can help project
managers use the predictive
information to make better
decisions to keep the projects
on-schedule and on-budget
Analytics can be used in Project
Management to
Project Management
Analytics Overview
Which Analytics Approaches
can be used?
How can Analytics
be used in Project
Management?
• Statistical Approach
• Lean Six Sigma Approach
• Analytical Hierarchy Process
Approach
Figure 1.9 Project Management Analytics Approach Summary
20
Project Management Analytics
• Assess Feasibility
• Manage Data Overload
• Enhance Data Visibility and Control
via Focused Dashboards
• Analyze Project Portfolio for Project
Selection and Prioritization
ã Improve Project Stakeholder
Management
ơ3redict Project Schedule Delays and
Cost Overruns
ã Manage Project Risks
Improve Project Processes
Key Terms
Analytic Hierarchy Process (AHP)
Net Present Value (NPV)
Analytics
Normal Distribution
Beta Distribution
NORMDIST
Breakeven Analysis
Payback Period
Continuous Random Variable
PDSA Cycle
Cost-Benefit Analysis
Poisson Distribution
Critical Path Method (CPM)
Program Evaluation and Review
Technique (PERT)
Customer Relationship Management
(CRM)
Return on Investment (ROI)
Discrete Random Variable
SIPOC
DMAIC Cycle
Three-Point Estimating
Earned Value Analysis
Triangular Distribution
Empirical Rule
Uniform Distribution
Lean Six Sigma
Value Stream Mapping
Case Study: City of Medville Uses Statistical Approach to
Estimate Costs for Its Pilot Project
To encourage sports and fitness among students from kindergarten to 12th grade, the
education department of the city of Medville, Pennsylvania, conceived a 12-month pilot
project to provide special free training, nutrition, and sports gear to the students of a
select 10 schools. The goal of this project was to cover 70% of the student population
under the new program. The initial challenge was to figure out the funds required to run
this project and also the plan to carry out the project work.
For scope management, the project management committee divided the student population in different age groups and estimated the cost for students in each age group. Table
1.2 depicts the various student age groups and the cost estimates.
Chapter 1 Project Management Analytics
21
Table 1.2
Estimated Project Cost for Various Student Age Groups
Student Age Group
Estimated Cost Per Student
Less than 10 years old
$2,000
10 to 15 years old
$5,000
More than 15 years old
$3,000
The project assumed that the total population of students (2,000 students) was normally
distributed with a mean age of 12 and a standard deviation of 3. The following statistical
calculations for normal distribution were used to make decisions.
Determine Target Age Group for Initial Project Pilot
For normal distribution,
■
1 σ covers roughly 68% of the population, which implies 68% of the total 2,000
students fall in the age group 9 to 15 (12 +/– 3).
■
2 σ covers roughly 95% of the population, which implies 95% of the total 2,000
students fall in the age group 6 to 18 (12 +/– 6).
Because the goal of the pilot project was to cover 70% of the student population, students
in age group 6 to 18 were selected for the initial pilot.
Estimate Project Costs for the Target Age Group
The target age group contained student population from all three population bands listed
in Table 1.2. Thus, cost estimates pertaining to those population bands or age groups had
to be considered for calculating costs for the target age group (6 to 18 years old). The
project figured it out using the Excel NORMDIST17 function as follows:
Percentage of target students belonging to age group under 10 years (6 to 10 years
old) = NORMDIST (10, 12, 3, 1) – NORMDIST (6, 12, 3, 1) = 22.97%
Cost Allocation for 6- to 10-year old students = (2000 * 22.97% * 2000) = $918,970
Percentage of target students belonging to age group 10 to 15 years (10 to 15 years
old) = NORMDIST (15, 12, 3, 1) – NORMDIST (10, 12, 3, 1) = 58.89%
17
22
NORMDIST(x, μ, σ, 1), where x = random variable (upper or lower end of the age-group range),
μ = mean age in the age-group, σ = standard deviation, and 1 stands for cumulative.
Project Management Analytics
Cost Allocation for 10- to 15-years-old students = (5000 * 58.89% * 2000)
= $5,888,522
Percentage of target students belonging to age group over 15 years = 1 –
(22.97% + 58.89%) = 18.14%
Cost Allocation for over 15-year-old students = (3000 * 18.14% * 2000)
= $1,088,432
Total Estimated Cost for All Target Students for the Initial Pilot = $918,970 +
$5,888,522 + $1,088,432 = $7,895,924
Case Study Questions
1. What approach was used by the city of Medville to estimate the overall project
cost?
2. Define the scope of this project.
3. Do you think the city made a wise decision to use this approach for cost estimation? Why do you think so?
Chapter Review and Discussion Questions
1. Define analytics.
2. What is the difference between analytics and analysis?
3. What are advantages of using analytics in project management?
4. How can analytics be used in project selection and prioritization?
5. Describe briefly the 7 Cs of project stakeholder management.
6. What are the characteristics of normal distribution in terms of standard deviation?
7. When can Poisson distribution be used for project management? Provide some
examples.
8. Which statistical distribution is used for three-point estimation in project
management?
9. Describe briefly the various stages of the DMAIC cycle.
10. What does PDSA stand for?
11. What is the primary purpose of using the Lean Six Sigma approach in project
management?
12. List some of the applications of the AHP approach.
Chapter 1 Project Management Analytics
23
13. What is the empirical rule in normal distribution?
14. The mean duration of the activities of a project is 10 days with a standard deviation of 2 days. Using the empirical rule estimate the percentage of project activities with duration between 7 and 10 days.
15. Solve the preceding problem using Excel’s NORMDIST function.
Bibliography
Anbari, F.T. (1997). Quantitative Methods for Project Management. 59th Street, New York: International Institute for Learning, Inc.
Borror, C. (2009). “The Define Measure Analyze Improve Control (DMAIC) Process.” Retrieved
February 14, 2015, from />Deltek. (2013, September 11). “Deltek wInsight Analytics: Avoid Surprises and Quickly Discover
Trends and Issues in Your Earned Value Data.” Retrieved February 14, 2015, from http://www.
deltek.com/~/media/pdf/productsheets/govcon/winsight-ipm-ps.ashx
Ghera, B. (2011). “Project and Program Management Analytics.” Retrieved February 10, 2015,
from />Goodpasture, John C. (2003). Quantitative Methods in Project Management. Boca Raton, Florida,
USA: J. Ross Publishing.
Larson, R. and Farber, E. (2011). Elementary Statistics: Picturing the World, 5th ed. Upper Saddle
River, New Jersey: Pearson.
Mavenlink. (2013). “Using Analytics for Project Management.” Retrieved February 11, 2015, from
/>MDH QI Toolbox. (2014). “PDSA: Plan-Do-Study-Act.” Minnesota Department of Health.
Retrieved February 15, 2015, from />Pollard, W. (n.d.). BrainyQuote.com. Retrieved October 5, 2015, from BrainyQuote.com Web site:
/>Project Management Institute (2014). A Guide to the Project Management Body of Knowledge
(PMBOK® Guide), 5th ed. Newton Square, Pennsylvania: Project Management Institute (PMI).
Quora. (2014). What is the difference between “Business Analytics” and “Business Analysis”?
Retrieved September 4, 2015, from />Ramakrishnan, Dr. (2009). “CRM and Stakeholder Management.” 20th SKOCH Summit, Hyatt
Regency, Mumbai, July 16-17 2009.
Saaty, T.L. (2008). “Decision Making with Analytic Hierarchy Process.” International Journal of
Services Sciences, 1 (1), pp. 83–98.
24
Project Management Analytics