IT IS NECESSARY TO UNDERSTAND THE VALUE OF K DENSITY WHEN TESTING THE QUALITY OF NATURAL AGGREGATE LAYER IN ROAD COAT STRUCTURE IN THE SOUTH
Bạn đang xem bản rút gọn của tài liệu. Xem và tải ngay bản đầy đủ của tài liệu tại đây (894.26 KB, 11 trang )
Tạp chí Khoa học và Cơng nghệ, Số 43A, 2020
IT IS NECESSARY TO UNDERSTAND THE VALUE OF K DENSITY
WHEN TESTING THE QUALITY OF NATURAL AGGREGATE LAYER IN
ROAD COAT STRUCTURE IN THE SOUTH
LE TAN
Department of Civil Engineering, Industrial University of Ho Chi Minh City
Abstract. Density is an important parameter reflects the quality of the foundation and base
construction. Therefore, the exact determination of density parameters is extremely necessary in the work
of checking and accepting the work items. The paper presents the results of the research to determine the
density of the natural mix layer in the road coat structure with flexible and rational adjustment of the
oversized grain content - during standard compaction as well as sampling for field test of density to
overcome difficulties and obstacles when implementing the inspection of road structure.
Keywords. Density, standard compaction, oversized grain content, natural aggregate.
1 INTRODUCTION
The quality of the road foundation always plays an important role in improving the load capacity as well
as ensuring the stability of the pavement structure during the exploitation and use process. Therefore, the
control of input materials and the process of constructing the foundation structure are always paid special
attention by the managers.
With various material resources, natural aggregates are widely used in construction of transport works
in the southern region and neighboring provinces. Basically, the quality of natural aggregate after
construction must ensure that the technical requirements are within the allowable limits of the
prescribed standards, specifically:
a. Ingredients grained granules
b. Geometric dimensions
c. Elevation
d. Horizontal slope
e. Elastic modulus Eđh
f. K density
During the organization of construction and acceptance, the above specifications (from a to f) are
strictly controlled and ensured according to the technical process. Only the parameter of density
K is always causing difficulties and hardness for the acceptance of the work, although in reality, the
contractor has constructed in accordance with the provisions in the approved technical design dossier. In
many projects, natural aggregate works could not be accepted because K density does not meet the
requirements. Therefore, to find out the reason why the natural aggregate layer cannot reach the required
density during the inspection and acceptance while the other specifications are met is
an urgent requirement in current road construction work.
2 OVERVIEW OF STANDARD COMPACTION METHODS IN THE LABORATORY
2.1 Theoretical basis
The density K is determined by the formula [3]:
K
k
kmax
(2.1)
Inside:
© 2020 Trường Đại học Cơng nghiệp Thành phố Hồ Chí Minh
78
IT IS NECESSARY TO UNDERSTAND THE VALUE OF K DENSITY WHEN TESTING
THE QUALITY OF NATURAL AGGREGATE LAYER IN ROAD COAT STRUCTURE IN THE SOUTH
+ k: dry density of field materials (g/cm 3 ).
max
+ k : Maximum dry density of materials is determined by standard laboratory compaction
method (g/cm 3).
The dry density is determined by the formula [3]:
k
w
1 W
(2.2)
With:
+ W: the natural density of the material determined by the sand hopper method 22TCN 34606 (g/cm 3) [3]
+ W: natural moisture of material (%) [3]
max
Maximum dry density of materials k : determined based on the chart of relation between dry density
and moisture content of materials when conducting standard compaction [2].
2.2 Overview of standard compaction methods in the laboratory
Applying standard 22TCN333-06 in soil compaction, macadam. The basic contents of the method are as
follows [2]: Use the standard compaction method in the laboratory to determine the best compaction
moisture value and the largest dry volume weight of the material used as the base and foundations of
transport works. Compaction is done in two ways:
- Standard compaction: use 2.5kg compactor ram with the fall height of 305mm to compact the
samples.
- Advanced compaction: using 4.54kg compactor ram with the fall height of 457mm to compact the
sample.
Depending on the largest particle size while testing and the type of coil used in sample compaction,
each of compaction methods is divides into two types of compaction with symbol A and D. There are four
different compaction methods available with symbol I-A, II-A, I-D and II-D.
2.3 Steps of performance
2.3.1 Preparation of testing samples
2.3.1.1 Drying samples
If the sample is wet, it should be dried on the open air or placed in an oven, maintaining the oven
temperature of no more than 60°C until it is possible to loosened the materials. Use a rubber hammer to
beat lightly to loosen the material. Use a rubber ram to grind small particles to avoid altering the natural
composition of the sample.
2.3.1.2 Screening samples
Compaction test samples shall be screened to remove oversized particles. Based on the specified
compaction method to use the appropriate type of sieve:
+ With compacting method I-A and II-A: The materials are screened through 4.75mm sieve.
+ With compacting method I-D and II-D: Materials are screened through 19mm sieve.
2.3.1.3 Volume of necessary materials
Based on the specified compaction method, the minimum weight of materials needed for testing is
required as follows:
+ With compaction method I-A and II-A: 15kg of materials.
+ With compacting method I-D and II-D: 35kg of materials.
2.3.1.4 Moisturing samples
Taking the prepared sample amount to divide into 5 equal parts, each part is mixed with a suitable amount
of water to get a series of samples with a specified moisture distance, so that the best compacted moisture
© 2020 Trường Đại học Cơng nghiệp Thành phố Hồ Chí Minh
IT IS NECESSARY TO UNDERSTAND THE VALUE OF K DENSITY WHEN TESTING
79
THE QUALITY OF NATURAL AGGREGATE LAYER IN ROAD COAT STRUCTURE IN THE SOUTH
value found after being tested is in the middle of the 5 sample moisture values. Numbering materials from
1 to 5 in order of increasing sample moisture order. Place the moistly-mixed sample part in a closed
container for incubation, with an approximate 12-hour incubation period. For macadam aggregates, sandy
soil, the incubation time is about 4 hours.
Note: Refer to the following instructions for selecting the first sample moisture value and the humidity
range between samples.
+ For sandy soil: starting at 5% moisture, the moisture distance between samples is from 1% to 2%.
+ For clay soil: beginning from 8% moisture, the moisture distance between samples is 2% (for
clay soil) of from 4% to 5% (for clay).
+ With macadam gravel: starting from 1.5% moisture, the moisture content between samples is 1%
to 1.5%.
+ For macadam aggregates: beginning from 1.5% moisture, the moisture distance between samples
is from 1% to 1.5%.
2.3.2 Sample compaction
a. Preparing equipment and selecting compaction parameters.
b. Sample compaction sequences: a series of prepared samples will be compacted from the lowest
moisture sample to the highest moisture sample one by one.
c. The thickness of each layer and the total thickness after compaction: based on the required number of
compaction layers according to the compaction method to adjust the amount of materials of one layer to
be suitable, so that the thickness of each layer after compaction is about the same and the total thickness
of the sample after compacting is about 10mm.
d. First compaction mortar: to be carried out of the lowest moisture sample in the following order:
+ First compaction mortar: put the mortar in the firm position, not moving during compaction. Place an
appropriate volume of a sample part into the mortar, spread the sample evenly and preliminarily compact
with a ram or a tool with a diameter of about 50mm, gently compacting across the sample surface and
letting the ram freely after each compaction to distribute the compacting beat evenly across the sample
surface.
+ Compacting the next layers: repeat the as for the first layer.
+ After compacting, remove the mortar belt and flat the sample surface with steel rods, leveling it up to
the level of the mortar upper surface. Determine the volume of the sample and mortar, symbolized as
M1 (g).
+ Take sample to determine moisture content: take a representative amount of materials among the soil
mass, place in a moisturizing box, drying to determine the moisture, symbolized as W1 (%).
e. Compacting the remaining samples: repeat the process as described in item d for the remaining samples
in the ascending order of moisture until the series of 5 samples have been finished. The compaction
process will be completed when the wet volume value of W of the sample decreases or does not
increase. Normally, the compaction test is conducted for 5 compaction mortars. In case the weight of wet
volume W of the 5th sample still increases, the 6 th mortar and next motars should be tightly compacted.
2.3.3 Calculate experimental results
a. The moisture content of the sample is determined by the following formula:
W %
A B
x100%
B C
(2.3)
Inside:
+ W: moisture of sample (%).
+ A: weight of wet sample and moist box (g).
+ B: weight of dry sample and moist box (g).
+ C: weight of moisturizing box (g).
b. The wet mass of the sample is determined by the following formula:
© 2020 Trường Đại học Cơng nghiệp Thành phố Hồ Chí Minh
80
IT IS NECESSARY TO UNDERSTAND THE VALUE OF K DENSITY WHEN TESTING
THE QUALITY OF NATURAL AGGREGATE LAYER IN ROAD COAT STRUCTURE IN THE SOUTH
W
M1 M
V
(2.4)
Inside:
+ W: density of wet sample (g/cm3).
+ M1: weight of sample and mortar (g).
+ M: weight of mortar (g).
+ V: volume of mortar (cm3)
c. The dry mass of the sample is determined by the following formula:
k
w
1 W
(2.5)
Inside:
+ k: dry weight of the sample (g/cm3).
+ W: density of wet sample (g/cm3).
+ W: moisture of sample (%).
d. Drawing the moisture - dry volumetric relation graph: for 5 series of compacted samples, there will be
5 pairs of moisture value and corresponding mass. Express these pairs of points by the points on the
relative humidity and mass density graph, with the vertical axis representing the dry volume mass value
and the horizontal axis representing the moisture value. Draw smooth curves through the points on the
graph.
e. Determining the best compaction moisture value: The value on the horizontal axis corresponding to the
top of the curve is called the best compaction moisture content in a laboratory material, symbolized as
Wopt
f. Determination of the largest dry bulk mass value: the value on the vertical axis corresponding to the top
max
of the curve is called the largest dry mass of the laboratory material, symbolized as k
g. Correct the compaction test results in the room when the field materials contain oversized particle
sizes.
g.1 Determine the dry bulk mass of the standard particle and the oversized particle
- The dry mass of the standard particle is determined by the formula:
M ktc
100 M wtc
100 w tc
(2.6)
Inside:
+ Mktc: dry mass of the standard particle (g).
+ Mwtc: wet weight of standard particle (g).
+ Wtc: moisture content of standard particle (%).
- The dry weight of the oversized grain is determined by the formula:
M kqc
100M wqc
100 w qc
(2.7)
Inside:
+ Mkqc: dry weight of oversized grain (g).
+ Mwqc: wet weight of oversized grain (g).
+ Wqc: moisture content of oversized grain (%).
g.2 Determine the standard grain size and the oversize particle fraction.
- The ratio of standard grain is determined by the formula:
Ptc
100 M ktc
M ktc M kqc
- The ratio of oversized particles is determined by the formula:
© 2020 Trường Đại học Cơng nghiệp Thành phố Hồ Chí Minh
(2.8)
IT IS NECESSARY TO UNDERSTAND THE VALUE OF K DENSITY WHEN TESTING
81
THE QUALITY OF NATURAL AGGREGATE LAYER IN ROAD COAT STRUCTURE IN THE SOUTH
Pqc
100 M kqc
(2.9)
M ktc M kqc
Inside:
+ Mktc: dry mass of the standard particle (g).
+ Mwtc: wet weight of standard particle (g).
+ Ptc: standard seed rate (%).
+ Pqc : oversized grain percentage (%).
g.3 Determine the best compacting moisture and the corrected maximum dry bulk weight.
- The best adjusted compacted moisture content is determined by the formula:
Wopthc
Wopt .Ptc Wqc .Pqc
100
(2.10)
Inside:
hc
+ Wopt
: modified best compacted moisture (%).
+ Wopt : best compacted moisture according to the results of laboratory compaction (%).
+ Ptc : standard seed rate (%).
+ Pqc : oversized grain percentage (%).
+ Wqc : oversized grain moisture content (%).
- The best corrected volumetric mass is determined by the formula:
hc
k max
100. kmax .Gm . n
Gm . n .Ptc kmax .Pqc
(2.11)
Inside:
+ k max : the largest corrected dry bulk weight (g/cm3).
hc
+ k
max
: the largest dry volume according to the results of compaction in the room (g/cm 3 ).
+ Ptc: standard seed rate (%).
+ Gm: density of oversized particles.
+ n: volume separately of water (g/cm 3 ).
g.4 Calculate the compacting coefficient K.
- Actual dry mass of the field sample is determined by the formula:
ktt
wtt
(2.12)
1 Wtt
Inside:
+ ktt : actual dry weight of the field sample (g/cm 3 ).
+ W : actual wet weight of the field sample (g/cm 3 ).
+ W tt : actual moisture content of samples in the field (%).
- The density coefficient K is determined by the formula:
K
ktt
khcmax
(2.13)
Inside:
+ k max : the largest corrected dry bulk weight (g/cm3).
hc
+ K: compacting coefficient (%).
+ ktt: actual dry weight of the field sample (g/cm3).
© 2020 Trường Đại học Cơng nghiệp Thành phố Hồ Chí Minh
82
IT IS NECESSARY TO UNDERSTAND THE VALUE OF K DENSITY WHEN TESTING
THE QUALITY OF NATURAL AGGREGATE LAYER IN ROAD COAT STRUCTURE IN THE SOUTH
3 APPLICATION CALCULATION RESULTS FOR SPECIFIC CONSTRUCTION
The author uses compaction data in the laboratory and results of determining K density in the field of two
specific works, performed by the Center for Geological Testing of Foundations [4] as a number. Data
input for computational research.
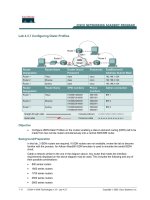
3.1 Project: Road from Cultural Area to Ta Lai, Tan Phu Town, Dinh Quan Province, Dong Nai
3.1.1 Test results of particle aggregate particle size [1]
Figure 1: The results of analyzing the grain composition of the natural grading test sample according to the domain
of type C (TCVN 8857-2011)
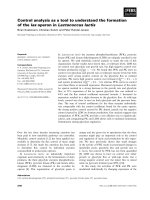
3.1.2 Determination of moisture and density relations [2]
Figure 2: Results of a standard compaction test of a natural mating sample
© 2020 Trường Đại học Cơng nghiệp Thành phố Hồ Chí Minh
IT IS NECESSARY TO UNDERSTAND THE VALUE OF K DENSITY WHEN TESTING
83
THE QUALITY OF NATURAL AGGREGATE LAYER IN ROAD COAT STRUCTURE IN THE SOUTH
3.1.3 Result of determining K density in the field [3]
Table 1: Determination of density K at site [3]
Correction
Weight
Surface
of
Density
Density
of
Pit
Required
correction excavation
of wet Humidity of dry Density
No. Process Location
material volume
density Comment
holes
volume (%) volume (%)
in hole (cm 3 )
(%)
3
3
(g/cm )
(g/cm )
M1 M2 M3 M4
(g)
(g)
(g) (g) (g)
1 Km0+000 Right 9231 7604 9204 5120 3488 1723 2024
9.12
1.855 0.919 0.95
Unsatisfactory
2 Km0+500 Left
9146 7492 9183 5096 3567
1706
2.091
10.58
1.891
0.937 0.95
Unsatisfactory
3 Km1+000 Center
9027 7322 8986 4702 3713
1809
2.053
8.07
1.9
0.941 0.95
Unsatisfactory
4 Km1+500 Right
8953 7269 8917 4802 3559
1705
2.088
10.33
1.892
0.938 0.95
Unsatisfactory
5 Km2+000 Left
8862 7229 8834 4883 3324
1626
2.045
10.71
1.847
0.915 0.95
Unsatisfactory
6 Km2+500 Center
8693 6984 8649 4296 3715
1854
2.004
7.25
1.868
0.926 0.95
Unsatisfactory
7 Km3+000 Right
8574 6906 8529 4529 3296
1635
2.015
8.87
1.851
0.917 0.95
Unsatisfactory
8 Km3+500 Left
8467 6815 8424 4082 3967
1886
2.103
9.28
1.924
0.954 0.95
Satisfactory
9 Km4+000 Center
8382 6743 8351 4264 3574
1717
2.082
10.44
1.885
0.934 0.95
Unsatisfactory
10 Km4+500 Right
8146 6434 8103 3695 3811
1891
2.016
7.96
1.867
0.925 0.95
Unsatisfactory
11 Km4+950 Left
8054 6395 8019 3954 3509
1687
2.08
9.58
1.898
0.94 0.95
Unsatisfactory
12 Km5+000 Center
7961 6229 7887 3706 3501
1717
2.039
8.13
1.885
0.934 0.95
Unsatisfactory
13 Km5+450 Right
7758 5982 7716 3559 3398
1670
2.035
10.05
1.849
0.916 0.95
Unsatisfactory
3
Standard sand density γc = 1,426g/cm
The authors found that the experimental step compaction standards and determine the density at the scene,
the Center T U consulting K Score is the A. Ia substance N EN nail C he works are done carefully and
methodically. However, the omission of the determination of oversized grain content (greater than 19mm)
at the locations during the density test has led to an inaccurate estimation when calculating results of
density K in the field (table 1).
To overcome this problem, the author has collaborated with the foundation geological testing and
consulting center to perform the following steps:
a. At the locations where the density test was conducted, punching materials to get the same volume of
excavated holes with the determined density of K.
b. Take all material samples to the lab, determine the exact amount of oversized particles in each
excavation pit.
c. When determining the density K, each test site must be used
calculation. Specifically:
kmax or khcmax suitable
for
max
- At the test site, if there are no oversized particles: use k for calculation.
- At the test site, if there are oversized particles: use k max it for calculation.
d. Results of density adjustment K in the field after adding oversized grain content are shown in Table 2
hc
© 2020 Trường Đại học Cơng nghiệp Thành phố Hồ Chí Minh
84
IT IS NECESSARY TO UNDERSTAND THE VALUE OF K DENSITY WHEN TESTING
THE QUALITY OF NATURAL AGGREGATE LAYER IN ROAD COAT STRUCTURE IN THE SOUTH
Table 2:Results of K density determination at site after calibration [3]
No.
Correction of Weight
excavation
of
Pit
holes
Process Location
material volume
in hole (cm3)
(g)
M 1 (g) M 2 (g) M 3 (g) M 4 (g)
Surface
correction
Density
Density Oversized Maximum
Required
of wet Humidity of dry
grain
dry bulk Density
density Comment
volume
(%)
volume content weight
(%)
(%)
(g /cm3)
(g/ cm3)
(%)
(g/cm3)
1 Km0+000 Right
9231
7604
9204
5120
3488
1723
2.024
9.12
1.855
3.4
1.929
0.96
0.95
Satisfactory
2 Km0+500
9146
7492
9183
5096
3567
1706
2.091
10.58
1.891
6.5
1.947
0.97
0.95
Satisfactory
3 Km1+000 Center
9027
7322
8986
4702
3713
1809
2.053
8.07
1.9
6.1
1.944
0.98
0.95
Satisfactory
4 Km1+500 Right
8953
7269
8917
4802
3559
1705
2.088
10.33
1.892
7.7
1.953
0.97
0.95
Satisfactory
5 Km2+000
8862
7229
8834
4883
3324
1626
2.045
10.71
1.847
2.9
1.927
0.96
0.95
Satisfactory
6 Km2+500 Center
8693
6984
8649
4296
3715
1854
2.004
7.25
1.868
10.7
1.97
0.95
0.95
Satisfactory
7 Km3+000 Right
8574
6906
8529
4529
3296
1635
2.015
8.87
1.851
4.6
1.936
0.96
0.95
Satisfactory
8 Km3+500
8467
6815
8424
4082
3967
1886
2.103
9.28
1.924
13.8
1.988
0.98
0.95
Satisfactory
9 Km4+000 Center
8382
6743
8351
4264
3574
1717
2.082
10.44
1.885
12.1
1.978
0.95
0.95
Satisfactory
10 Km4+500 Right
8146
6434
8103
3695
3811
1891
2.016
7.96
1.867
6.6
1.947
0.96
0.95
Satisfactory
11 Km4+950
8054
6395
8019
3954
3509
1687
2.08
9.58
1.898
8.3
1.957
0.97
0.95
Satisfactory
12 Km5+000 Center
7961
6229
7887
3706
3501
1717
2.039
8.13
1.885
7.9
1.954
0.96
0.95
Satisfactory
13 Km5+450 Right
7758
5982
7716
3559
3398
1670
2.035
10.05
1.849
4.2
1.934
0.96
0.95
Satisfactory
Left
Left
Left
Left
To ensure reliability when calculating K density, the author used the standard compaction result of the
max
testing unit to determine the largest dry volume k , only adjusting the largest dry volume. When there
is an oversized particle content involved k max at specific experimental sites according to formula
hc
(3.9). Therefore, the flexible and reasonable application k or k max for each experimental site has
made a clear difference in the assessment of the quality of natural graded layer compaction, as shown by
the K density test results. (Table 2)
max
© 2020 Trường Đại học Cơng nghiệp Thành phố Hồ Chí Minh
hc
IT IS NECESSARY TO UNDERSTAND THE VALUE OF K DENSITY WHEN TESTING
85
THE QUALITY OF NATURAL AGGREGATE LAYER IN ROAD COAT STRUCTURE IN THE SOUTH
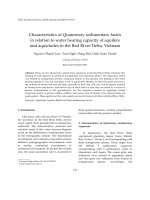
3.2 Project: Renovating road from Dac Lua to Dang Ha, Dac Lua, Dinh Quan province, Dong Nai.
3.2.1 Results of particle composition analysis [1]
Figure 3: Results of grain composition analysis of natural graded laboratory samples by type C domain (TCVN
8857-2011)
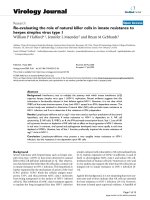
3.2.2 Standard compaction results [2]
Figure 4: Results of the standard compaction experiment of natural mating sample
© 2020 Trường Đại học Cơng nghiệp Thành phố Hồ Chí Minh
86
IT IS NECESSARY TO UNDERSTAND THE VALUE OF K DENSITY WHEN TESTING
THE QUALITY OF NATURAL AGGREGATE LAYER IN ROAD COAT STRUCTURE IN THE SOUTH
3.2.3 Results of density K at site
Table 3:Determination of density K at site [3]
Surface correction
No
Process
Location
M 1 (g)
1
2
3
4
5
6
7
8
9
10
11
Km0 +
050
Km0 +
500
Km1 +
000
Km1 +
500
Km2 +
000
Km2 +
500
Km3 +
000
Km3 +
500
Km4 +
000
Km4 +
500
Km4 +
950
Heart
8873
M 2 (g)
Correction of
excavation holes Weight of
Pit
material in volume
M 3 (g) M 4 (g) hole (g) (cm 3 )
Density
Density
of wet Humidity of dry Density Required
volume
(%)
volume
(%) density (%)
(g / cm 3 )
(g / cm 3 )
Comment
7168
8818
4801
3376
1621
2.082
11.37
1,870
0.929
0.95
Unsatisfactory
Left
8749
6916
8705
4498
3357
1665
2.016
9.06
1.849
0.919
0.95
Unsatisfactory
Right
8631
6937
8577
4263
3812
1837
2,075
10.59
1,876
0.933
0.95
Unsatisfactory
Heart
8519
6897
8483
4311
3546
1788
1,983
7.63
1.842
0.916
0.95
Unsatisfactory
Left
8397
6549
8346
4174
3358
1630
2,060
8.87
1,893
0.941
0.95
Unsatisfactory
Right
8265
6503
8224
3975
3616
1744
2,073
10.05
1,884
0.937
0.95
Unsatisfactory
Heart
8136
6257
8106
3778
3635
1717
2,117
9.91
1,926
0.957
0.95
Satisfactory
Left
8006
6193
7951
3560
3786
1808
2,094
11.04
1,886
0.938
0.95
Unsatisfactory
Right
7873
6213
7840
3806
3397
1665
2,040
8.83
1,875
0.932
0.95
Unsatisfactory
Heart
7724
6085
7693
3542
3569
1762
2.026
10.19
1,839
0.914
0.95
Unsatisfactory
Left
7609
6012
7554
3574
3459
1671
2,070
9.65
1,888
0.93 8
0.95
Unsatisfactory
Standard sand density γc = 1,426g / cm 3
Use the same procedure as in 3.1.3 . Results of density adjustment K in the field after adding
oversized grain content are shown in Table 4.
Table 4: Results of K density determination at site after calibration [3]
Correction of Weight
Density
Density Oversized Maximum
of
Pit
Required
excavation
of wet Humidity of dry
grain
dry bulk Density
No. Process Location
material volume
density
holes
volume
(%)
volume content
weight
(%)
in hole (cm3)
(%)
(g/cm3)
(g/cm3)
(%)
(g/cm3)
(g)
M 1 (g) M 2 (g) M 3 (g) M 4 (g)
Surface
correction
Comment
1
Km0 +
000
Right
8873
7168
8818
4801
3376
1621
2.082
11.37
1,870
4.8
1.96 1
0.95
0.95
Satisfactory
2
Km0 +
500
Left
8749
6916
8705
4498
3357
1665
2.016
9.06
1.849
2.2
1.9 46
0.9 5
0.95
Satisfactory
3
Km1 +
000
Heart
8631
6937
8577
4263
3812
1837
2,075
10.59
1,876
3.2
1.9 52
0.9 6
0.95
Satisfactory
4
Km1 +
500
Right
8519
6897
8483
4311
3546
1788
1,983
7.63
1.842
1 .3
1.9 41
0.9 5
0.95
Satisfactory
5
Km2 +
000
Left
8397
6549
8346
4174
3358
1630
2,060
8.87
1,893
3.6
1.9 54
0.9 7
0.95
Satisfactory
6
Km2 +
500
Heart
8265
6503
8224
3975
3616
1744
2,073
10.05
1,884
4.7
1,960
0.96
0.95
Satisfactory
7
Km3 +
000
Right
8136
6257
8106
3778
3635
1717
2,117
9.91
1,926
12.6
2.0 05
0.96
0.95
Satisfactory
8
Km3 +
500
Left
8006
6193
7951
3560
3786
1808
2,094
11.04
1,886
3.5
1.9 5 3
0.9 7
0.95
Satisfactory
9
Km4 +
000
Heart
7873
6213
7840
3806
3397
1665
2,040
8.83
1,875
6.5
1,970
0.9 5
0.95
Satisfactory
© 2020 Trường Đại học Cơng nghiệp Thành phố Hồ Chí Minh
IT IS NECESSARY TO UNDERSTAND THE VALUE OF K DENSITY WHEN TESTING
87
THE QUALITY OF NATURAL AGGREGATE LAYER IN ROAD COAT STRUCTURE IN THE SOUTH
10
Km4 +
500
Right
7724
6085
7693
3542
3569
1762
2.026
10.19
1,839
1.4
1,942
0.95
0.95
Satisfactory
11
Km4 +
950
Left
7609
6012
7554
3574
3459
1671
2,070
9.65
1,888
8.7
1,983
0.95
0.95
Satisfactory
* Comment:
- Result of K density density implemented by the Advisory Center for geotechnical investigation on the
project of Road from Cultural Area to Ta Lai, Tan Phu Town, Dinh Quan Province, Dong Nai
and Renovating road from Dac Lua to Dang Ha, Dac Lua, Dinh Quan province, Dong Nai was
mostly unsatisfactory (K<0.95) along the entire test (each project has only 01 inspection position meets
the required density: K0.95).
- With reasonable and scientific adjustments at each experimental site (the author presented above), the
density value of natural grading layer has changed markedly, all meeting design standards.
(K0.95). Thus, the obstacles of the projects have been removed. Since the quality of
compaction (through the density value K) of the route was not satisfactory (K<0.95), it was now
guaranteed (K0.95). It is possible to conduct pre-acceptance test and transfer to the next stage of
construction.
4 CONCLUSION
From the actual result, the author realized that in order to ensure the accuracy in determining the density
K of the natural gradation in the pavement structure, the following requirements must be ensured:
a. At each position of the density test, it is imperative to determine the amount of oversized particles
contained in the composition of the excavated volume
b. It is not recommended k
max
or used k max to calculate K density for all test sites.
hc
c. Must be used k or k max suitable for each testing site through the accurate determination of the
oversized particle content.
max
hc
REFERENCES
[1] The process of construction and acceptance of the pavement structure layers with natural gradients (TCVN8857:
2011)
[2] The process of compaction of soil and macadam in the laboratory (22BC 333-06)
[3] Experimental procedure for determining foundation, road foundation by sand hopper (22BC 346-06)
[4] The results tested by the Center T U consulting K Score is the A. In substance N EN nail C he Procedure
CẦN HIỂU ĐÚNG GIÁ TRỊ ĐỘ CHẶT K KHI KIỂM ĐỊNH CHẤT LƯỢNG
LỚP CẤP PHỐI THIÊN NHIÊN TRONG KẾT CẤU ÁO ĐƯỜNG Ô TƠ
Ở KHU VỰC PHÍA NAM
Tóm tắt. Độ chặt là thơng số quan trọng phản ánh chất lượng thi công nền móng cơng trình. Vì vậy, việc
xác định chính xác thơng số độ chặt là vô cùng cần thiết trong công tác kiểm tra, nghiệm thu hạng mục
cơng trình. Bài báo trình bày kết quả nghiên cứu xác định độ chặt lớp cấp phối thiên nhiên trong kết cấu
áo đường mềm với sự điều chỉnh linh hoạt và hợp lý hàm lượng hạt quá cỡ trong quá trình đầm nén tiêu
chuẩn cũng như q trình lấy mẫu thí nghiệm độ chặt tại hiện trường nhằm tháo gỡ những khó khăn,
vướng mắc khi triển khai công tác kiểm định kết cấu đường ô tô.
Từ khóa. Độ chặt, đầm nén tiêu chuẩn, hàm lượng hạt quá cỡ, cấp phối thiên nhiên.
Ngày nhận bài: 29/10/2019
Ngày chấp nhận đăng: 26/02/2020
© 2020 Trường Đại học Cơng nghiệp Thành phố Hồ Chí Minh