- Trang chủ >>
- Văn Mẫu >>
- Văn Bản Mẫu
SỬ DỤNG LƯỢNG THIỆT HẠI KHOẢNG CÁCH ĐỂ ƯỚC LƯỢNG MỨC BỨC XẠ NGOÀI BĂNG GÂY BỞI BỘ KHUẾCH ĐẠI CÔNG SUẤT LỚN PHI TUYẾN TRONG CÁC HỆ THỐNG TRUYỀN THÔNG CỦA CHUẨN 802-11N
Bạn đang xem bản rút gọn của tài liệu. Xem và tải ngay bản đầy đủ của tài liệu tại đây (502.06 KB, 8 trang )
<span class='text_page_counter'>(1)</span><div class='page_container' data-page=1>
<b>USING THE DISTANCE DEGRADATION TO ESTIMATE THE OUT-OF-BAND </b>
<b>EMISSION LEVEL (OBE) CAUSED BY NONLINEAR HIGH POWER </b>
<b>AMPLIFIER IN COMMUNICATION SYSTEMS OF 802-11N STANDARD </b>
<b>Doan Thanh Hai1*, Nguyen Van Vinh2</b>
<i>1</i>
<i>University of Technology – TNU, </i>
<i>2 </i>
<i>Hung Yen University of Technology and Education</i>
ABSTRACT
In M-QAM-OFDM systems, nonlinear High Power Amplifiers (HPAs) increase dramatically
unwanted out-of-band emission that can cause strong Adjacent Channel Interference (ACI) to
other systems. In this paper, empirical formulae to calculate quickly the level of Out-Of-Band
emission (OBE) is found for 16-QAM-OFDM systems of 801-11n standard. OBE calculated by
this formula would help in defining requirements for the stop-band attenuation of the transmitter
<b>filter in system design to ensure the spectral mask of the system. </b>
<i><b>Keywords: Out-Of-Band Emission, non-linear distortion, High Power Amplifier, OFDM, 802-11n </b></i>
INTRODUCTION*
The nonlinear distortion mainly caused by the
transmitter HPA in Orthogonal Frequency
Division Multiplexing (OFDM) systems
affects more severely on the system
performance because of the high
Peak-to-Average Power Ratio (PAPR) of OFDM
signals. The effects of nonlinear distortion are
not only to degrade dramatically the inband
performance of the system, but also to cause
much higher out-of-band emission that can
violate the required spectral mask and make
Adjacent Channel Interference (ACI) to the
neighbor systems unacceptable.
Analysis of out-of-band emission and in-band
interference caused by OFDM techniques as
well as the techniques for compressing
out-of-band radiation have been introduced in [1, 2,
3]. However, the authors had not yet taken the
effects of nonlinear HPA and modulation
schemes into account [1] or not yet mentioned
out-of-band emission caused by nonlinear
HPA, but just had completed research on the
in-band performance of the system in the
paper [2].
The parameters described the nonlinearity of
HPAs could be BO (Back-Off), 1
*
<i>Email: </i>
compression point, IM3 (third-order
InterModulation), IM5 or IP3 (third-order
Intercept Point) [2, 3]. However, it was
difficult to use these parameters to calculate
directly Bit Error Rate (BER) or Power
Spectrum Density (PSD) analytically. If was
done, calculated results were too hard to use
in system design calculations or practical
applications [3] or those were not monovalent
[2]. Being considered to be the most feasible
system theory method and simulation
estimation have been accepted and applied
around the world in extremely expensive
experimental equipment conditions except
giant research corporations. So system theory
and simulation evaluation are determined in
this research.
A nominal parameter of HPA’s nonlinearity,
<i>distance degradation dd, had been proposed </i>
since 1995 [4]. By using this parameter and
simulating systems with many nonlinear
HPAs, empirical formulae had been found for
estimating the effects of nonlinear distortion
on the system performance in single carrier
<i>M-QAM (M = 16, 64, 256) SISO (Single </i>
Input Single Output) [4-6] or 16-QAM
MIMO (Multiple Input Multiple Output) [7]
and 16-QAM-OFDM [8] systems.
</div>
<span class='text_page_counter'>(2)</span><div class='page_container' data-page=2>
<i>parameter dd was used to find out the </i>
<i>empirical formula for calculating OBE under </i>
the effects of nonlinear HPA for the
16-QAM-OFDM system with some different
numbers of subcarriers [10]. The relationship
<i>between OBE and dd, however, depends on </i>
the number of subcarriers, M-ary schemes.
Continuous this background and motivated by
the limitations of these above works to
comprehensively estimate the effect of
nonlinear distortion caused by HPA
out-of-band of the 802-11n system, the relationship
<i>between OBE and was investigated and </i>
<i>empirical formulae to calculate OBE as a </i>
<i>function of dd were presented in this paper. </i>
The paper, after the introduction, is organized
as follows: The main conceptions (Model of
system to be considered, Definition of the
<i>nonlinearity parameter dd, Level of </i>
<i>Out-Of-Band emission OBE) are presented in Section </i>
2; Simulation results for a number of
unintentionally chosen TWT
(Traveling-Wave Tube) HPAs and the empirical
<i>formulae between OBE and subcarrier </i>
number are given in Section 3, Section 4 is
used for the conclusion and discussions.
MAIN CONCEPTIONS
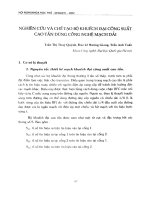
<i><b>System Model </b></i>
<i>The M-QAM-OFDM system of 802-11n </i>
standard to be considered as modeled in Fig.
1a. Single Carrier (SC) system also as
depicted in Fig. 1b. The transmitter nonlinear
HPA is taken into account. In addition, the
pulse shaping filters (square-root raised
cosine filters) are also included in the
simulation system.
(a)
<i><b>Figure 1. (a) Model of M-QAM-OFDM system of 802-11n with HPA </b></i>
<i>(b) Model of M-QAM-SC system with HPA </i>
HPA is described by the curves of AM/AM and AM/PM conversions. If the input symbol is
<i>j</i>
<i>s</i><i>re</i> , the output signal can be expressed in polar coordinates as:
( )
ˆ
( )
<i>j</i> <i>r</i> <i>j</i>,
</div>
<span class='text_page_counter'>(3)</span><div class='page_container' data-page=3>
2
2 2
( )
; ( )
,
1
1
<sub></sub>
<i>p</i>
<i>a</i>
<i>a</i> <i>p</i>
<i>r</i>
<i>r</i>
<i>A r</i>
<i>r</i>
<i>r</i>
<i>r</i>
(2)
where
<i><sub>a</sub></i>,
<i><sub>a</sub></i>and
<i><sub>p</sub></i>,
<i><sub>p</sub></i>are the parameters of Saleh model. These parameters of 3 HPAsselected unintentionally [1, 4...] are listed in Table 1.
<i><b>Table 1. The parameter of HPA according to Saleh model </b></i>
<i><b>Name of HPA The parameter </b></i> <b>HPA267 [4] </b> <b>HPA1371 [4, 11] </b> <b>HPA1373 [4, 11] </b>
<i>αa </i> 2 1.9638 2.1587
<i>βa </i> 1 0.9945 1.1517
<i>αp </i> π/3 2.5293 4.0033
<i>βp </i> 1 2.8168 9.1040
<i><b>Distance Degradation (dd) </b></i>
HPA causes the signal state displacements,
the higher nonlinearity of the HPA, the
greater displacements of the signal points.
Under the effects of the displacements, the
signal states are shifted closely to the decision
boundaries on the <i>M-QAM </i> signal
constellation and the BER becomes higher.
The degradation of the distance from the
signal states to the nearest decision boundary
averaging on all of signal set is defined as
<i>distance degradation, dd, and can be </i>
calculated from the HPA’s characteristics as
follows [4]:
<i>dd</i>
<i>M</i> <i>i j</i> <i>ddi j</i>
<i>M</i>
4
1
2
,
,
/
(3)
<b>Figure 2.</b><i>Defining d22 (for symmetry, only a </i>
<i>quadrant of signal constellation is shown)</i>
<i>where ddi,j</i> = 1<i> di,j, the distance di,j</i> from the
<i>signal point [i, j] to the nearest boundary can </i>
be calculated directly from the characteristics
<i>of HPA and a given BO,. For each HPA, the </i>
characteristics of gain decrease <i>G(Pout</i>) and
phase rotation <i>(Pout</i>) as functions of output
<i>power Pout are given by the manufacturer. </i>
From these characteristics and the given BO,
<i>Gij</i> and <i>ij for every signal point [i, j] can be </i>
<i>easily determined and by using geometry, ddi,j</i>
<i>can be easily calculated, i, j = 1, 2,…, </i> <i>M</i> / 2
, as shown in Figure 2.
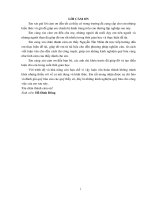
<i><b>Figure 3. Explaination of calculating OBE </b></i>
<i><b>Level of Out-Of-Band Emission (OBE) </b></i>
</div>
<span class='text_page_counter'>(4)</span><div class='page_container' data-page=4>
other hand. This out-of-band emission can
interfere the adjacent channels (the so-called
ACI). In general, the Taylor series of HPA
characteristics can be truncated to the 3rd order
and the output signal spectrum is often 3
times-wider than the one of the input signal. It
means that at the output, the signal spectrum is
added a signal bandwidth to both sides.
We called the normalized out-of-band
<i>emission (OOBE) bandwidth as Boob-norm </i>[9].
<i>Boob-norm</i> is determined from the point from
which the signal spectrum starts to extend
comparing to the case of completely linear
system, and the width of normalized OOBE
<i>Boob-norm</i> equals to the normalized in-band
<i>bandwidth Bib-norm (Fig. 3). Bib-norm</i> depends on
<i>M and the number of subcarriers. </i>
<i><b>The level of OBE </b></i>
<i>The magnitude of OOBE depends on dd. The </i>
<i>larger dd, the more nonlinear HPA, then the </i>
greater is the radiation power of OOBE due to
nonlinear distortion. The level of OOBE can
be characterized by the difference between
the outside PSD (Power Spectrum Density) of
output signal in the case of existing nonlinear
HPA and the normalized in-band PSD (PSD
ib-norm) of linear system. Because PSD is not a
constant in the frequency range of OOBE, in
[9] we recommended taking the difference
between PSDib-norm and the average PSD over
the OOBE range (PSDmean-oob-norm, Fig. 3) as a
parameter characterized for OBE:
<i>ib norm</i> <i>mean oob norm</i> <i>mean oob norm</i>
<i>OBE</i><i>PSD</i> <sub></sub> <i>PSD</i> <sub></sub> <sub></sub> <i>PSD</i> <sub></sub> <sub></sub>
[dB] (4)
<i>Of course, the greater dd, the higher the </i>
HPA’s nonlinearity, the higher the
<i>out-of-band emission, and the smaller is the OBE. </i>
SIMULATION RESULTS
Many simulations are performed to estimate
<i>BER and calculate OBE in the practical range </i>
<i>of nonlinear distortion dd. Configuration of </i>
system is shown in Fig.3. 802-11n system has
a length of IFFT/FFT equal to 64; the number
of subcarriers=52, the length of cyclic prefix
is 1/5 of integral period. Square-root raised
cosine filters at the transmitter and receiver:
Delay = 10, Rolloff factor = 0.5, in/output
sampling rates Fd = 1, Fs = 8 (in order to
ensure no spectrum distortion in calculation
when the output signal spectrum is expanded
at least 3 times). Because we investigate only
the impact of nonlinear distortion, the channel
is AWGN, synchronization of the system is
assumed to be perfect. The amplifiers have
parameters of Saleh model as shown in Table
1. The BO is taken according to the peak
power (called Ppeak) of HPA’s input signal.
<i><b>Range of dd corresponding to the useful </b></i>
<i><b>range of IBO </b></i>
With the same values IBO (input BO),
different HPAs express different
nonlinearities. Given smaller IBO, the HPA
operates in area closer to the saturation point
<i>then distortion is greater and dd is higher. </i>
With large enough IBO, HPA can be
considered as linear. The investigated and
<i>useful ranges of IBO and dd are listed in </i>
Table 2 for OFDM systems of 802-11n
standard and Table 3 for SC systems. The
useful range of IBO (and thus the normal
<i>range of dd) is the range, in which the system </i>
is not outaged (BER ≤ 10-3
<i>), but OBE is still </i>
not too high (HPA is not too linear).
<i><b>Table 2. Ranges of dd and IBO, IBOs are taken with steps of 0.5 dB in 802-11n system </b></i>
<b>Range of IBO </b> <b>HPA267 </b> <b>HPA1371 </b> <b>HPA1373 </b>
Investigated range of IBO:
IBOmin-IBOmax
0-16.5 0-20 0-21
Useful range of IBO 4.5-12.5 6-15 7-17
<i>Range of dd corresponding to the </i>
</div>
<span class='text_page_counter'>(5)</span><div class='page_container' data-page=5>
<i><b>Table 3. Ranges of dd and IBO, IBOs are taken with steps of 0.5 dB in SC system </b></i>
<b>Range of IBO </b> <b>HPA267 </b> <b>HPA1371 </b> <b>HPA1373 </b>
Investigated range of IBO: IBOmin
-IBOmax
0-16.5 0-20 0-21
Useful range of IBO 7.5-15 8.5-18 9-18.5
<i>Range of dd corresponding to the </i>
<i>useful range of IBO </i> <b>0.0215 – 0.1247 </b> <b>0.0190 - 0.1687 </b> <b>0.0217 - 0.1782 </b>
<i><b>The bit error rate BER and PSD of systems </b></i>
<b> </b>
<b>(a) </b> <b>(b) </b>
<i><b>Figure 4. (a) Simulated BER performance and (b) Simulated PSD of the QAM of HPA 1373. </b></i>
Simulated BER (see Fig 3a) and PSD (see Fig
3b) are compare with system without the
effects of HPA.
<i><b>The empirical formula between OBE and </b></i>
<i><b>number of subcarriers </b></i>
<i>PAPR in M-QAM-OFDM systems is very </i>
high because it includes the PAPR of OFDM
modulation scheme and the inherent PAPR of
<i>M-QAM signal. When the number of </i>
<i>modulation level M and the number of </i>
subcarriers vary, resulting in changes in
<i>PAPR, OBE will change. </i>
<b>16-QAM-OFDM </b> <b>systems </b> <b>of </b> <b>802-11n </b>
<b>standard </b>
<i>The OBE caused by nonlinear HPA in </i>
16-QAM-OFDM systems of 802-11n standard
<i>when the subcarrier number Nc equal to 64. dd </i>
changes in the useful range (Table 2) with 35
calculated points.
From our investigation, this relationship is
<i>shown in Fig.5, OBE is a 1st-order function of </i>
<i>dd when the BO is taken according to Pmax </i>of
HPA’s input signal:
16, 6452 45, 4064
<i>OBE</i> <i>dd</i> RMSE=0.33 (5)
<i>This relationship between OBE and dd is </i>
<i>shown in Fig.6, OBE is a 1st-order function of </i>
<i>dd when the BO is taken according to the </i>
average power (Pmean) of HPA’s input signal:
227, 4411 45,1890
<i>a</i> <i>dd</i>
RMSE=0,37 (6)
<b>16-QAM-SC systems </b>
<i>This relationship between OBE caused by </i>
nonlinear HPA in 16-QAM-SC systems and
<i>dd is shown in Fig.6, OBE is a 1st-order </i>
<i>function of dd when the BO is taken </i>
according to Pmax of HPA’s input signal:
42, 2967 46, 2572
<i>a</i> <i>dd</i>
RMSE=0,29 (7)
<i>This relationship between OBE caused by </i>
nonlinear HPA in 16-QAM-SC systems and
<i>dd is shown in Fig.6, OBE is a 1st-order </i>
<i>function of dd when the BO is taken </i>
according to Pmean of HPA’s input signal:
164,0188 45,7209
<i>a</i> <i>dd</i>
</div>
<span class='text_page_counter'>(6)</span><div class='page_container' data-page=6>
<i><b>Figure 5. The relationship between OBE and dd </b></i>
<i>when IBO is taken according to Pmean</i>
<i><b>Figure 6. The relationship between OBE and dd </b></i>
<i>when IBO is taken according to Pmax</i>
It is easy to see that in the case of BO taken according to Pmean of HPA’s input signal (system
<i>operating in nonlinear condition) the OBE of 802-11n system is worse (belower) than that of the </i>
<i>SC system (Fig 5). In a position on the other side of OBE in case of BO taken according to P</i>max of
<i>HPA’s input signal (system operating in linear condition) the OBE of SC system is worse </i>
(belower) than that of the 802-11n system (Fig 6).
In addition, OBE and dd can be approximated by a polynomial function of 2nd order with smaller
errors as shown in Table 4.
<i><b>Table 4. Relationship between OBE and dd by a polynomial function of 2</b>nd order in SC and 802-11 systems </i>
<i>when BO is taken according to Pmax or Pmean of HPA’s input signal </i>
<b>Relationship in systems </b> <b>0-order coe. </b> <b>1st-order coe. </b> <b>2nd-order coe. </b> <b>RMSE </b>
<i>OBE(dd) in 802-11 P</i>max 45.93 -26.15 30.7 0.28
<i>OBE(dd) in 802-11 P</i>mean 45.80 -372.48 6199 0.21
<i>OBE(dd) in SC P</i>max 46.93 -63.60 121.90 0.30
OBE(dd) in SC Pmean 46.47 -269.36 2733.8 0.21
CONCLUSION AND DISCUSSION
In this paper, the empirical formulae to
determine the zero- and first-order
<i>coefficients of the relationship between OBE </i>
<i>and dd in 16-QAM-OFDM in 802-11n </i>
standard are found by simulation. These
coefficients of polynomial are listed in
formulae (5-8) for 1st order function and 2nd
ones in Table 4. The nominal parameter of
<i>HPA’s nonlinearity, dd, which can be </i>
determined if BO is given and the
characteristics of HPA are provided by the
manufacturer.
Depending on the required accuracy, we can
use the 1st or 2nd order polynomial to calculate
<i>OBE. In order to evaluate separately the effect </i>
of the nonlinear HPA, it is possible to
investigate the 802-11n system under BO
conditions taking into account the average
power of HPA’s input signal.
<i>OBE of the 16-QAM-OFDM system of </i>
802-11n standard can be calculated simply and
<i>quickly by those formulae. OBE calculated by </i>
this way would help in system design (for
determining the stop-band attenuation of the
transmitter filter to ensure the spectral mask
of the system).
REFERENCES
1. M. Mohamad, R. Nilsson, and J. V. D Beek
<i>(2015), “An analysis of out-of-band emission and </i>
<i>in-band interference for precoded and classical </i>
<i>OFDM systems”, European Wireless 2015, </i>
Proceedings of 21th European Wireless
Conference, pp. 1-5.
</div>
<span class='text_page_counter'>(7)</span><div class='page_container' data-page=7>
<i>Multicarrier Waveforms”, EURASIP Journal on </i>
Wireless Communications and Networking, vol.
2008 ID 437801.
<i>3. H. Xiao, Q. Wu, and F. Li (1999), “Measure a </i>
<i>power amplifier’s fifth-order interception point”, </i>
RF Design, pp. 54-56.
4. Binh N. Q., Bérces J. and Frigyes I. (1995),
<i>“Estimation of the Effect of Nonlinear High Power </i>
<i>Amplifier in M-QAM Radio-Relay Systems”, </i>
Periodica Polytechnica Electrical Engineering,
Technical University of Budapest, vol. 39.
5. N. T. H. Nga, N. Q. Binh and N. H. Ngoc
<i>(2001), “Signal-to-Noise Ratio Degradation as a </i>
<i>Function of the Distance Degradation Caused by </i>
<i>the Nonlinear Distortion in 16-QAM System”, 4th </i>
Info-Communications Techno-Economics
Seminar (ETRI & PTIT), Hanoi.
6. N. Q. Binh, N. T. Bien and N. T. Thang (2008),
<i>“The Usability of Distance Degradation in </i>
<i>Estimation of Signal to Noise Ratio Degradation </i>
<i>Caused by the Effect of Nonlinear Transmit </i>
<i>Amplifiers and Optimum Additional Phase Shift in </i>
<i>256-QAM Systems”, International Conference on </i>
Advanced Technologies for Communications,
ATC 2008, pp. 258-261.
7. N. T. Nam, N. Q. Binh and N. Thanh (2015),
<i>“Evaluating Separate Effects of Non-linear </i>
<i>Distortion Caused by High Power Amplifier in </i>
<i>MIMO 2xnR STBC Systems”, Journal of Science </i>
and Technology, Section on Information and
Communication Technology No. 7 (10- 2015), pp.
58-73, in Vietnammes.
<i>8. D. T. Hai and N. Q. Binh (2016), “Estimation of </i>
<i>Separate Effect of The Non-linear Distortion </i>
<i>Caused by HPA in OFDM Systems” Journal of </i>
Military Science and Technology, No. 43
(06-2016), pp. 74-83, in Vietnammes.
<i>9. D. T. Hai and N. Q. Binh (2017), “Using </i>
<i>Distance Degradation for Fast Etimating Level of </i>
<i>Out-Of-Band Emission Caused by Non-linear </i>
<i>High Power Amplifiers in 16-QAM-OFDM </i>
<i>Systems”, Journal of Science and Technology, </i>
Military Technical Academy, No.182 (02-2017),
pp.40-50, in Vietnammes.
10. Doan Thanh Hai, Nguyen Quoc Binh, Nguyen
<i>Van Vinh (2018), “Relationship between </i>
<i>Out-Of-Band Emission and Number of Subcarriers in </i>
<i>16-QAM-OFDM Systems with Nonlinear High Power </i>
<i>Amplifier”, Journal of Science and Technology, </i>
Military Technical Academy, No.191 (6-2018),
pp.75-82.
<i>11. Saleh A. A. M. (1981), </i>
<i>“Frequency-Independent and Frequency Dependent Nonlinear </i>
<i>Models of TWT Amplifiers”, IEEE Transactions on </i>
Communications, Vol. 29, 1981, pp. 1715-1720.
TÓM TẮT
<b>SỬ DỤNG LƯỢNG THIỆT HẠI KHOẢNG CÁCH ĐỂ ƯỚC LƯỢNG MỨC BỨC </b>
<b>XẠ NGOÀI BĂNG GÂY BỞI BỘ KHUẾCH ĐẠI CÔNG SUẤT LỚN PHI TUYẾN </b>
<b>TRONG CÁC HỆ THỐNG TRUYỀN THÔNG CỦA CHUẨN 802-11N </b>
<b>Đoàn Thanh Hải1* <sub>, Nguyễn Văn Vĩnh</sub>2 </b>
<i>1<sub>Trường Đại học Kỹ thuật Công nghiệp – ĐH Thái Nguyên; </sub></i>
<i> 2<sub>Trường Đại học Sư phạm Kỹ thuật Hưng Yên </sub></i>
Trong cá hệ thống M-QAM-OFDM, Các bộ khuếch đại công suất phi tuyến làm tăng nghiêm trọng
bức xạ không mong muốn ở ngoài băng tần của hệ thống gây nhiễu kênh lân cận lớn tới các hệ
thống khác. Trong bài báo này, các công thức thực nghiệm nhằm ước lượng nhanh mức bức xạ
ngoài băng được xác định cho các hệ thống 16-QAM-OFDM của chuẩn 802-11n. Mức bức xạ
ngồi băng tính theo công thức này đặt ra các yêu cầu về tiêu hao băng chắn của mạch lọc máy
phát trong thiết kế hệ thống để đảm bảo mặt nạ phổ của hệ thống.
<i><b>Từ khóa: Out-Of-Band Emission, méo phi tuyến, HPA, OFDM, 802-11n </b></i>
<i> </i>
<i><b>Ngày nhận bài: 27/8/2018; Ngày phản biện: 17/9/2018; Ngày duyệt đăng: 12/10/2018</b></i>
*
</div>
<span class='text_page_counter'>(8)</span><div class='page_container' data-page=8></div>
<!--links-->