Khả năng hấp phụ ion Cr(VI) của vật liệu Fe3O4@SiO2 với SiO2 từ tro trấu
Bạn đang xem bản rút gọn của tài liệu. Xem và tải ngay bản đầy đủ của tài liệu tại đây (582.25 KB, 12 trang )
<span class='text_page_counter'>(1)</span><div class='page_container' data-page=1>
<i>DOI: 10.22144/ctu.jen.2020.024 </i>
<b>Adsorption of chromium (VI) ion using adsorbent derived from lignin extracted coir pith </b>
Luong Huynh Vu Thanh*<sub>,</sub><sub>Tran Nguyen Phuong Lan, Tran Thi Bich Quyen, Ha Quoc Nam and </sub>
Cao Luu Ngoc Hanh
<i>College of Engineering Technology, Can Tho University, Vietnam </i>
<i>*Correspondance: Luong Huynh Vu Thanh (email: ) </i>
<b>Article info. </b> <b> ABSTRACT </b>
<i>Received 11 Aug 2020 </i>
<i>Revised 08 Oct 2020 </i>
<i>Accepted 30 Nov 2020</i>
<i><b> In this study, coconut coir pith (cellulose-lignin compound) was first </b></i>
<i>treated with water and sodium hydroxide solution to remove lignin and </i>
<i>impurities, then lignin-extracted coir pith was calcined at 200C for 6 h. </i>
<i>The obtained adsorbent was applied to remove Cr(IV) ions by using </i>
<i>adsorption method. Some analytical methods such as thermal gravimetric </i>
<i>analysis (TGA), Fourier Transform Infrared Spectroscopy (FT-IR), </i>
<i>Brunauer–Emmett–Teller analysis (BET), X-ray powder diffraction </i>
<i>analysis (XRD), pHpzc analysis, Boehm titration, and potentiometric </i>
<i>titration were employed to characterize structure, specific surface area, </i>
<i>functional groups, and surface charge of the adsorbent. Adsorption results </i>
<i>showed that 95.23% of Cr(IV) was removed from solution of 100 mg.L-1<sub> by </sub></i>
<i>using a certain amount of adsorbent at pH 2.0 within 20 min at room </i>
<i>temperature. Kinetics of Cr(VI) adsorption from aqueous solution on </i>
<i>adsorbent fit to Pseudo-second-order kinetic equation and adsorption </i>
<i>isotherm of Cr(IV) followed to the Freundlich model. </i>
<i><b>Keywords </b></i>
<i>Adsorbent, adsorption, Cr(VI) </i>
<i>ion, coir pith </i>
Cited as: Thanh, L.H.V., Lan, T.N.P., Quyen, T.T.B., Nam, H.Q. and Hanh, C.L.N., 2020. Adsorption of
chromium (VI) ion using adsorbent derived from lignin extracted coir pith. Can Tho University
<i>Journal of Science. 12(3): 54-65. </i>
<b>1 INTRODUCTION </b>
Among industrial wastewaters, electroplating
efflu-ent discharged is one of the most dangerous
wastewaters, which normally contains high
concen-tration of heavy metal ions such as Cr(VI), Cr(III),
Cu(II), Zn(II), and Ni(II), etc. due to low yields of
<i>electroplating process (Zhao et al., 1999). Those </i>
ions are non-biodegradable, toxic, and carcinogenic,
leading to an extremely environmental concern on
the wastewater. Compared to other ions, Cr(VI) ions
have obtained plenty of interest from researchers
owing to its negative effects and commercial value
<i>(Kimbrough et al., 1999; Silva et al., 2006; Cavaco </i>
<i>et al., 2007). From the environmental point of view, </i>
</div>
<span class='text_page_counter'>(2)</span><div class='page_container' data-page=2>
ratio of 1:2 (w/w), and then calcined at 700C for 1
h. The product possessed high cationic exchange
ability (1.614 mEq.g-1<sub>) with specific surface area of </sub>
910 m2<sub>.g</sub>-1<sub> (Namasivayam and Sangeetha, 2006). </sub>
One study reported that CCP calcined at different
temperatures of 400, 600, and 800o<sub>C, respectively </sub>
created different specific surface areas (346, 392,
and 507 m2<sub>.g</sub>-1<sub>) (Namasivayam and Kadirvelu, </sub>
1997). The surface areas increased with rising
cal-cined temperature, but carbon generated yields
de-creased from 60 to 55.2% as temperature inde-creased
from 400 to 800o<sub>C (Namasivayam and Kadirvelu, </sub>
1997). In order to reutilize CCP, the present work
was conducted to produce activated carbon. The
ad-sorbent was then applied to remove Cr(VI) ion in
aqueous solution with various affecting parameters.
<b>2 MATERIALS AND METHODS </b>
All chemicals used in this work such as sodium
hy-droxide pellets, potassium dichromate, phosphoric
acid, sodium bicarbonate were analytical reagents
and purchased from Xilong Scientific. CCP was
bought from Ben Tre province, Vietnam. Distilled
water was used.
<b>2.1 Adsorbent preparation </b>
CCP collected was pretreated to remove tannin and
lignin by sinking into water and NaOH solution for
a desired time. CCP was first sunk in water for 24 h
to remove tannin, and then dropped into NaOH 5%
solution for 24 h. The solid after that was washed
until pH of the solution was neutral. The CCP was
dried at 60°C for 48 h using Memmert SFE 600
dryer before calcining by Thermolyne 47900
fur-nace at 200°C for 6 h, with the ratio of CCP to
H3PO4 of 1:4. After calcination, the solid was sunk
into NaHCO3 1% solution for 12 h and then washed
with distilled water several times to neutralize the
surface of particles. Those particles were
conse-quently dried at 60°C until the weight of solid was
unchanged.
the quantity of functional groups and the amount of
charge on carbon surface.
<b>2.3 Adsorption experiments </b>
The desired amount of adsorbent was poured into a
250-mL Erlenmeyer flask containing 100 mL of
solution with various concentrations of Cr(VI) ion.
The pH values of solution varied from 1.0 to 8.0
while temperature of solution changed from 25 to
60°C. A certain amount of solution was sampled at
different time intervals. The concentration of Cr(VI)
ion in samples was determined by using Jenway’s
6800 Spectrophotometer (Keison). All experiments
were triplicated. The removal yield H(%) was
cal-culated by the following equation:
H(%) = [C0− Ct
C<sub>0</sub> ] × 100% (1)
Where H, C0 and Ct were the adsorption yield (%),
initial concentration of Cr(VI) ion (mg.L-1<sub>) and </sub>
con-centration of Cr(VI) ion at sampling time (mg.L-1<sub>), </sub>
respectively.
In this study, the adsorption model was built by
us-ing Langmuir and Freundlich isotherm models as
follows:
Langmuir isotherm model:
C<sub>e</sub>
qe
= Ce
qmax
+ 1
qmaxKL
(2)
Freundlich isotherm model:
logqe= logKF+ (
1
n) logCe (3)
where qe, KF, n and Ce were mass of adsorbed ions
at the equilibrium (mg.g-1<sub>), the Freundlich constant, </sub>
the index number of Freundlich equation, and
con-centration of solution at the equilibrium (mg.L-1<sub>), </sub>
re-spectively, qmax is described the maximum mass of
adsorbed ions (mg.g-1<sub>), K</sub>
</div>
<span class='text_page_counter'>(3)</span><div class='page_container' data-page=3>
<b>3 RESULTS AND DISCUSSION </b>
<b>3.1 Adsorbent preparation </b>
Table 1 showed that 20 g of CCP generated 10.93 g,
10.56 g, and 10.03 g of adsorbents in triplicated
ex-periments. Consequently, the calcination yield was
about 52.54% in this study. In comparison with the
study of Namasivayam and Sureshkumar (1997),
the carbonization yield in this work is lower by
3.0-7.0%. The reasons could be that the yield was
cal-culated based on dried weight of CCP in this work
and CCP was also pretreated before carbonizing
process. In the meantime, the previous study did not
conduct a pretreatment experiment and calculated
the carbonization yield by a ratio of carbon to dried
raw material. In addition, the authors carbonized
CCP for 1 h at higher temperatures (400-800°C)
without removing tiny particles after calcination so
it could cause a slightly higher yield compared to
this work.
<b>Table 1: The yield of adsorbent preparation at </b>
<b>200°C for 6 h with CCP:H3PO4 = 1:4 (w/v) </b>
<b>1st<sub> trial 2</sub>nd<sub> trial 3</sub>rd<sub> trial </sub></b>
<b>Dried CCP (g) </b> 20 20 20
<b>Dried adsorbent (g) </b> 10.93 10.56 10.03
<b>Yield (%) </b> 54.66 52.80 50.16
<b>Average yield (%) </b> 52.54 ± 2.26
<b>3.1 Adsorbent characterization </b>
The adsorbent was analyzed by TGA to understand
weight change, and the result was presented in
Fig-ure 1. It can be seen that when temperatFig-ure increased
from 30°C to 100°C, the weight of adsorbent
de-creased by 11.17%. If the temperature continuously
increased to 250°C, a decrease of the weight was
6.43%. The total of 17.6% decrease in weight can be
considered as moisture of adsorbent, consisting of
11.17% of water physical bonding and 6.43% of
wa-ter chemical bonding. Figure 1 showed that in the
range of 250-600°C, the weight of adsorbent
de-creased by 28.8% due to degradation of
hydrocar-bon compounds into CO and CO2 gases. The cause
of this decrease was contributed to non-complete
carbonization of CCP, which occurred at relatively
low temperature (200°C) for 2 h.
XRD result of adsorbent in Figure 2 showed a low
intensity peak at 2θ = 25°-26°, which represented an
amorphous carbon phase. Similar conclusions could
<i>be observed in reports of Das et al. (2000) and </i>
<i>Tong-poothorn et al. (2011). Besides, no other peaks </i>
could be found in the XRD pattern, so it can be
con-cluded that phosphoric acid or other phosphate
com-pounds were totally removed by washing right after
calcination.
Temperature /oC
100 200 300 400 500 600
T
G
/
%
50
60
70
80
90
100
</div>
<span class='text_page_counter'>(4)</span><div class='page_container' data-page=4>
<b>Figure 2: XRD pattern of the adsorbent </b>
Phosphoric acid was employed in this study to
car-bonize CPP; thus, it could play an important role in
the carbonization process. Phosphoric acid can be an
acidified agent and/or functionalized agent. This
was clarified by FT-IR spectra. The spectra in
Fig-ure 3 showed that peak at 3415.82 cm-1<sub> was a </sub>
broad-band of -OH group, belonging to hydrogen-bonded
alcohols or phenols. Stretching vibration of C-H
(ar-omatic rings) and vibration of C=O group
(carbox-ylic acids or aldehydes) were bands located at
2923.57 cm-1<sub> and 1617.40 cm</sub>-1<sub>, respectively. The </sub>
C–O stretching vibration in carboxylate groups
caused the band at 1385.45 cm-1<sub>. Finally, the O–H </sub>
out-of-plane bending vibration caused the band
lo-cated at 565.20 cm-1<sub>. Similar results can be found in </sub>
<i>the previous works of Bansal et al. (2009) and Yang </i>
and Qiu (2010). From all the above-mentioned
groups, some positions on surface of the adsorbent
were functionalized to acidic groups. In other
words, carbons on the edge of adsorbent were
acid-ified to functional groups to improve their
adsorp-tion ability, especially counter-charged solutes. No
phosphate groups could be observed in FT-IR
spec-tra of the adsorbent. It was once again concluded
that phosphoric acid only played a role of acidified
agent and supported carbonization agent, which
could not create any bonding between phosphorus
and surface of the adsorbent.
</div>
<span class='text_page_counter'>(5)</span><div class='page_container' data-page=5>
Result of specific surface area measurement was
presented in Figure 4. It can be seen that 48.56 m2<sub>.g</sub>
-1<sub> is a measured specific surface area of the adsorbent </sub>
and this value is relatively low compared to 877
m2<sub>.g</sub>-1<sub> (Santhy and Selvapathy 2004) calcining at </sub>
700-750°C in presence of KOH 10% solution or 346
m2<sub>.g</sub>-1<sub>, 392 m</sub>2<sub>.g</sub>-1<sub>, and 507 m</sub>2<sub>.g</sub>-1<sub> (Namasivayam </sub>
and Kadirvelu, 1997) calcining at 400°C, 600°C,
and 800°C, respectively. It could be stated that
tem-perature greatly affects specific surface area of
ad-sorbent obtained from calcination of CCP. The
higher calcining temperature applied, the stronger
carbonization of CCP happened, leading to damage
of internal structure of CCP to generate more pores
and improve surface area of adsorbent. In addition
to surface area determination, diameter of the pores
was an essential factor for adsorption treatment and
adsorption selectivity of adsorbent. In this study, the
average pore size of the adsorbent was 10.2 nm. This
could be considered as meso-pores, so several tens
square meters per gram surface area of the adsorbent
measured was reasonable.
<b>Figure 4: BET measurement of the adsorbent </b>
Determination of acidic points on surface of
adsor-bent plays an essential role in prediction adsorption
ability of an adsorbent. Figure 5 revealed that acidic
points on adsorbent’s surface were mostly
neutral-ized after 8 h by NaOH 0.018 M solution. When
re-action time was kept to 24 h, the difference in NaOH
use was tiny. The quantity of acidic points on
sur-face of the adsorbent using Boehm titration was
cal-culated as 1.74 .1021<sub> point.g</sub>-1<sub>. This result was </sub>
com-pared to the study of Dai (2000), and the difference
was presented in Table 2. It can be seen that the
amount of acidic points on surface of the adsorbent
was 10 times higher than that of commercial
acti-vated carbon, and approximately 1.5 times
com-pared to that of commercial activated carbon
associ-ated with HNO3 concentrated treatment. It
illus-trated that phosphoric acid helps to generate more
acidic points on surface of carbon than other acids
do. Finally, high amount of acidic point on surface
of the adsorbent in this study could predictably
ben-efit the adsorbent in adsorption ions in aqueous
so-lution. Surface charge of an adsorbent is an
im-portant factor allowing to predict adsorption ability
of an adsorbent at different pH solutions. Point of
zero charge of the adsorbent was pH 5.7, which can
be observed in Figure 6. In other words, the
adsor-bent could adsorb negatively charged solutes as pH
solution was lower than 5.7, and adsorbed positively
charged solutes as pH solution was higher than 5.7.
<b>Table 2: Quantity of acidic points on surface of the adsorbents </b>
<b>Acidic point (point.g-1<sub>) </sub></b>
Adsorbent (this work) 1.74 .1021
Activated carbon + HNO3conc. (heated in 4 h) 1.68 .1021
Activated carbon + HNO3conc. (heated in 2 h) 1.20 .1021
</div>
<span class='text_page_counter'>(6)</span><div class='page_container' data-page=6>
<b>Figure 5: Boehm titration of the adsorbent </b>
<b>Figure 6: Potentiometric titration of the adsorbent </b>
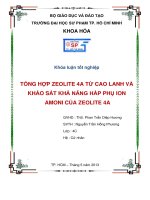
<b>3.1 Cr(VI) ion adsorption </b>
pH plays a vital role in adsorption of ions in aqueous
solution because it determines speciation of solutes
in aqueous solution. Effects of pH solution on
ad-sorption yield were presented in Figure 7. When pH
was at 1.0, Cr(VI) ions removal was 99.62%. It
slightly decreased to 95.23% when pH increased to
2.0. The decrease became more significant when pH
continuously went to neutral point. In fact, the yield
decreased by 53.89%, 65.76%, 80.25, and 79.87%
when pH was respectively at 3.0, 4.0, 5.0 and 6.0.
The lowest removal yield (8.71%) was observed at
pH 8.0. Those observations can be caused by the fact
that increase in pH leads to reduce acidic points on
surface of the adsorbent, and rise the quantity of OH
group in the solution as well. Moreover, based on
speciation of Cr(VI) ion presented in Figure 8,
Cr(VI) ion was dominant in Cr2O72- form, and small
</div>
<span class='text_page_counter'>(7)</span><div class='page_container' data-page=7>
charge was more negative and became dominant in
alkaline pH solution. From all above viewpoints, the
change of pH solution from acidic to basic range
caused the decrease in Cr(VI) ions adsorption on
surface of the adsorbent.
Effects of contact time on Cr(VI) ion adsorption
were presented in Figure 9. Cr(VI) ions were mostly
removed after 90 min. Approximate 73% of Cr(VI)
was adsorbed in the first 3 min. The removal yield
increased to 95.23% when contact time was 20 min,
and then slightly rose to 96.30%, 98.95%, and
99.23% after 30, 60, and 90 min adsorption,
respec-tively. Based on the above result, kinetics of Cr(VI)
adsorption was calculated and presented in Figure
10 and Table 3. Compared to Pseudo-first-order
ki-netic equation, Pseudo-second-order kiki-netic
equa-tion presented a good agreement to experimental
re-sults. In fact, equilibrium adsorption capacity in
Pseudo-second-order equation almost equaled to
practical one (331.51 mg.g-1<sub>) presented in Table 3. </sub>
Besides, R2<sub> = 1 was a strong illustration for this </sub>
agreement. From the Pseudo-second-order kinetic
equation, it can be seen that the slope is small (a =
0.0199). In other words, ratio t/qt was low or qt is
high. High qt means a significant adsorption
capac-ity of an adsorbent. It again confirmed that the
sorbent carbonized from CCP possesses a high
ad-sorption capacity to Cr(VI) ions in aqueous solution
at acidic pH solution.
<b>Figure 7: Effects of pH on Cr(VI) ions adsorption [ions concentration = 100 mg.L-1; amount of </b>
<b>adsor-bent = 0.2 g; contact time = 20 min; stirring speed = 180 rpm; temperature = 25°C] </b>
pH
0 2 4 6 8 10 12 14
0.0
0.2
0.4
0.6
0.8
1.0
HCrO4
-CrO4
2-Cr2O7
2-H2CrO4
</div>
<span class='text_page_counter'>(8)</span><div class='page_container' data-page=8>
<b>Figure 9: Effects of contact time on Cr(VI) ions adsorption [ions concentration = 100 mg.L-1<sub>; amount </sub></b>
<b>of adsorbent = 0.2 g; pH 2.0; stirring speed = 180 rpm; temperature = 25°C] </b>
</div>
<span class='text_page_counter'>(9)</span><div class='page_container' data-page=9>
<b>Table 3: Kinetic parameters for Cr(VI) ions adsorption </b>
<b>a </b> <b>b </b> <b>qe </b>
<b>(mg.g-1<sub>) </sub></b>
<b>k1 </b>
<b>(1.min-1<sub>) </sub></b>
<b>k2 </b>
<b>(g.mg-1<sub>.min</sub>-1<sub>) </sub></b> <b>R2</b>
Pseudo-first-order -0.0762 2.5205 331.51 -0.0762 - 0.9827
Pseudo-second-order 0.0199 0.0233 50.25 - 0.0174 1
<b>Table 4: Effects of initial concentrations on </b>
<b>Cr(VI) ions adsorption </b>
<b>C0</b>
<b>(mg.L-1<sub>) </sub>Ce (mg.L-1) </b> <b>Yield (%) qe (mg.g-1) </b>
50 0.40 99.20±0.01 24.80
75 1.03 98.97±0.05 36.99
100 4.77 95.23±0.05 47.62
125 9.53 92.37±0.28 57.73
150 17.56 88.20±0.44 66.22
175 23.57 86.53±0.39 75.72
200 34.36 82.82±0.53 82.82
225 53.93 76.03±0.65 85.54
250 58.25 76.70±0.36 95.87
275 71.56 73.98±0.29 101.72
300 78.33 73.89±0.48 110.83
Initial concentration of Cr(VI) ions showed a
mod-erate influence on adsorption performance of the
ad-sorbent, and the results were revealed in Table 4.
From Table 4, an increase of initial concentration of
Cr(VI) ions caused the relative decrease in
adsorp-tion yield, but the remarkable increase in adsorpadsorp-tion
capacity. When C0 was 50 mg.L-1, the yield and qe
were 99.20% and 24.80 mg.g-1<sub>, respectively. The </sub>
yield decreased to 95.23% as C0 was 100 mg.L-1
while qe increased to 47.62 mg.g-1 at the same initial
concentration of Cr(VI) ions. A slight decrease
could be observed in yield when C0 was varied from
100 to 200 mg.L-1<sub> meanwhile q</sub>
e showed a notable
increase at identical condition. When C0
continu-ously increased to 300 mg.L-1<sub>, both yield and q</sub>
e
moderately varied to 73.89% and 110.83 mg.g-1<sub>, </sub>
re-spectively. From the above observations, it can be
stated that adsorption capacity continuously
in-creased when increasing initial concentration of
Cr(VI) ions while the amount of adsorbent was kept
unchanged. It implied that Cr(VI) ions adsorbed on
the surface of adsorbent via multi-layer adsorption.
</div>
<span class='text_page_counter'>(10)</span><div class='page_container' data-page=10>
aqueous solution, Table 5 might help to clarify the
concern. As can be seen from Table 5, the red mud ions.
<b>Table 5: Adsorption capacity of adsorbents derived from various agricultural by-products </b>
<b>Raw materials </b> <b>Activated agents </b> <b>Activated conditions </b> <b>qmax (mg.g-1) References </b>
RHA HCHO 30o<sub>C, 5 h </sub> <sub>59.52 Tinh (2011) </sub>
Tea leaves KOH - <i>52.08 Huong et al. (2016) </i>
Red mud H2SO4 80oC, 1 h <i>2.34 Dung et al. (2015) </i>
Cow dung H2SO4 120oC, 24 h <i>4.50 Das et al. (2000) </i>
CCP H2SO4 80oC, 12 h <i>3.46 Selvi et al. (2010) </i>
CCP H3PO4 200oC, 6 h 110.83 This work
To understand nature of Cr(VI) ions adsorption by
CCP activated by H3PO4, Temkin and D-R models
were employed and the results are presented in
Fig-ure 12. The Temkin constant was calculated as
0.1621 kJ.mol-1<sub> in Figure 12 (a). This low value </sub>
pre-sented a weak interaction between adsorbent and
ad-sorbed, which can be considered as physical
adsorp-tion. The bonding energy between Cr(VI) ions and
the calculated adsorbent via D-R model was 1.955
kJ.mol-1<sub>. This value was smaller than 8 kJ.mol</sub>-1<sub>, </sub>
meaning that the interaction between adsorbent and
adsorbed in this study was physical interaction.
In-fluences of temperature on Cr(VI) ions adsorption
were shown in Figure 13. The adsorption efficiency
in Figure 13 slightly increased from 92.23 to
99.16% when temperature increased from 25 to
35°C. The change in efficiency was almost zero as
long as temperature continuously increased from 35
to 60°C. It again determined that the main
mecha-nism of Cr(VI) ions adsorption in this study is
phys-ical interaction.
</div>
<span class='text_page_counter'>(11)</span><div class='page_container' data-page=11>
<b>Figure 12: Sorption models for adsorption of Cr(VI) ions (a) Temkin (b) D–R </b>
<b>Figure 13: Effects of temperature on Cr(VI) ions adsorption [ion concentration = 100 mg.L-1<sub>; amount </sub></b>
<b>of adsorbent = 0.2 g; pH 2.0; stirring speed = 180 rpm; contact time = 20 min] </b>
<b>4 CONCLUSIONS </b>
In this study, coconut coir pith was partially
carbonized at temperature of 200C for 6 h with
cal-cination yield of 52.54%. The adsorbent obtained
possessed moderate surface area (48.56 m2<sub>.g</sub>-1<sub>) with </sub>
pore size of 10.2 nm, but high acidic points on the
surface (1.74 .1021 <sub>point.g</sub>-1<sub>). The result of </sub>
potentiometric titration showed that the surface of
adsorbent was positive at pH lower than 5.7, and
negative at pH higher 5.7. The adsorbent was then
used to adsorb Cr(IV) ions in aqueous solution.
Ad-sorption results showed that 0.2 g of adsorbent
ad-sorbed 95.23% of Cr(IV) in the solution containing
100 mgCr.L-1<sub> at pH 2.0 within 20 min at 25°C. </sub>
Adsorption isotherm of Cr(IV) ions and adsorption
kinetics of Cr(VI) ions in aqueous solution
respec-tively obeyed Freundlich isotherms model and
Pseudo-second-order kinetic equation.
<b>REFERENCES </b>
Bansal, M., Singh, D. and Garg, V.K., 2009. A
compara-tive study for the removal of hexavalent chromium
</div>
<span class='text_page_counter'>(12)</span><div class='page_container' data-page=12>
Do Tra Huong, Dang Van Thanh, Mai Thanh Khue and
Nguyen Thi Kim Ngan, 2016. Adsorption of Cr (VI)
from aqueous solution using spent tea leaves
modi-fied with KOH. Vietnam Journal of Chemistry 54:
74-80 (in Vietnamese).
Kimbrough, D.E., Cohen, Y., Winer, A.M., Creelmen, L.
and Mabuni, C., 1999. A critical assessment of
chro-mium in the environment. Critical Reviews in
Envi-ronmental Science and Technology 29(1): 1-46.
Le Thi Tinh, 2011. Study of Cr adsorption using rice
husk ash and application of Cr removal from
wastewater, Master thesis. Can Tho University, Can
Tho city (in Vietnamese).
Namasivayam, C. and Kadirvelu, K., 1997. Activated
carbons prepared from coir pith by physical and
chemical activation methods. Bioresource
Technol-ogy 62(2): 123-127.
Namasivayam, C. and Sangeetha, D., 2006. Recycling of
agricultural solid waste, coir pith: removal of anions,
heavy metals, organics and dyes from water by
ad-sorption onto ZnCl2 activated coir pith carbon.
Jour-nal of Hazardous Materials 135: 449-452.
Nguyen Tuan Dung, Vu Xuan Minh, Nguyen Thanh M
and Le Thi Mai Huong, 2015. Study of activation of
moval of hexavalent chromium using distillery
sludge. Bioresource Technology 89(2): 207-211.
Selvi, K., Pattabhi, S. and Kadirvelu, K., 2001. Removal of
Cr (VI) from aqueous solution by adsorption onto
acti-vated carbon. Bioresource Technology 80(1): 87-89.
Silva, P.T.S., Mello, N.T. and Duarte, M.M.M., 2006.
Extraction and recovery of chromium from
electro-plating sludge. Journal of Hazardous Materials
128(1): 39–43.
Tongpoothorn, W., Sriuttha, M., Homchan, P., Chanthai,
S. and Ruangviriyachai, C., 2011. Preparation of
ac-tivated carbon derived from Jatropha curcas fruit
shell by simple thermo-chemical activation and
char-acterization of their physico-chemical properties.
Chemical Engineering Research and Design 89(3):
335-340.
Yang, J. and Qiu, K., 2010. Preparation of activated
car-bons from walnut shells via vacuum chemical
activa-tion and their applicaactiva-tion for methylene blue removal.
Chemical Engineering Journal 165(1): 209-217.
Zhao, M., Duncan, J.R. and van Hille, R.P., 1999.
</div>
<!--links-->