NGHIÊN CỨU XÂY DỰNG BIỂU ĐỒ ỔN ĐỊNH GIA CÔNG PHAY DỰA VÀO ĐỘNG LỰC HỌC CỦA MŨI DAO
Bạn đang xem bản rút gọn của tài liệu. Xem và tải ngay bản đầy đủ của tài liệu tại đây (796.73 KB, 6 trang )
<span class='text_page_counter'>(1)</span><div class='page_container' data-page=1>
<b>A STUDY ON CREATING STABILITY LOBE DIAGRAM BASED </b>
<b>ON TOOL TIP DYNAMICS </b>
<b>Tran Minh Quang1,2*, Chun-Hui Chung2</b>
<i>1</i>
<i>University of Technology - TNU </i>
<i>2</i>
<i>National Taiwan University of Science and Technology </i>
ABSTRACT
Creating stability lobe diagram has an important role in optimizing the maximum depth of cut at
the highest available spindle speed without chatter. Thus, this study was carried out to determine
the stability lobe diagram of a milling machine tool. Firstly, the dynamics of tool tip were
investigated by impact tests that applied impulse loads and the signals then were obtained by using
MetalmaxTM. The TXFTM was utilized to achieve the modal parameters by using modal fit. Finally,
a simulation was accomplished by using a MatlabR program to carry out the stability lobe diagram
with Fourier series approach. The result obtained from simulation agrees with that comes from the
software.
<i><b>Keywords: Chatter, stability lobe diagram, tool tip dynamics, machining dynamics </b></i>
INTRODUCTION*
Machine tool chatter is a self-excited
vibration that causes machining instability, it
results in poor surface roughness, and
increasing tool wear in machining [1, 2].
Therefore, this phenomenon should be
avoided during the mechining processes to
improve the productivity. In general, a
stability lobe diagram based on regenerative
chatter theory is a simple and useful way to
predict and control chatter, the diagram
represents the relationship between critical
chip width and spindle speed [1-3]. It has two
regions, stable and unstable zones, which are
separated by a boundary created by a series of
intersected stability lobes. Thus, higher depth
of cut and material removal rates can be
achieved by using this method [4-6].
Investigation ofthe dynamics of the tool tip is
required for creating the stability lobe
diagram, and it could be measured using
impact tests and modal analysis [7].
In this study, the impact tests are used to
determine mode shapes and natural
frequencies of an end milling. The model
parameters and stability lobe diagram were
obtained by using the MetalmaxTM. Another
stability lobe diagram was obtained by using
*
<i>Email: </i>
a MatlabR program with Fourier series
approach, a comparison of both approaches
will be done to analysis the factor that effect
on the machining stability.
EXPERIMENTAL SETUP
In this work, the tool tip dynamics will be
determined by applying the impulse load at
the tip of tool. The arrangement is shown in
Fig. 1(a). The tests are achieved using a
carbide end mill cutter, the tool’s parameters
and its setup are shown in table 1.
The frequency response function (FRF) of the
<i>tool-holder-spindle assembly in x and y </i>
directions can be obtained by Eq. (1).
( )
( )
( )
<i>xx</i>
<i>x</i>
<i>X</i>
<i>G</i>
<i>F</i>
;
<sub>( )</sub> ( )( )
<i>yy</i>
<i>y</i>
<i>Y</i>
<i>G</i>
<i>F</i>
(1)
<i>where X(ω) and Y(ω)are the measured </i>
<i>response in the frequency domain in x and y </i>
<i>directions, respectively; and Fx,y(ω)are the </i>
</div>
<span class='text_page_counter'>(2)</span><div class='page_container' data-page=2>
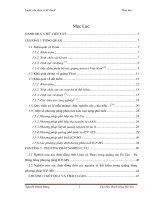
<i><b>Fig.1. Experimental modal analysis set-up (a), </b>output of TXFTM -FRF in x and y directions (b)</i>
<i><b>Table 1. Cutting tool’s parameters</b></i>
Cutting Tool Diameter
<i>(mm) </i> Cutting edges
Cutting edge
length
<i>(mm) </i>
Stickout length
<i>(mm) </i>
Carbide End Mill 12 2 30 40
MODE SHAPES
min max
2
<i>real</i> <i>i</i> <i>real</i> <i>i</i>
<i>qi</i>
<i>ni</i>
(2)
1
min Im
2
<i>qi</i>
<i>i</i> <i>qi</i>
<i>k</i>
<i>FRF</i>
<sub>(3) </sub>
2
<i>qi</i>
<i>qi</i>
<i>ni</i>
<i>k</i>
<i>m</i>
(4)
2
<i>qi</i> <i>qi</i> <i>qi</i> <i>qi</i>
<i>c</i>
<i>k m</i>
(5)
</div>
<span class='text_page_counter'>(3)</span><div class='page_container' data-page=3>
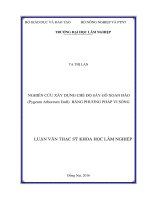
<b>(a) </b>
<b>(b) </b>
<i><b>Fig. 2. FRFs_Real and their model fit in x and y directions</b></i>
<i><b>Table 2. Pick the peak values of imaginary parts and the corresponding values of frequencies for each </b></i>
<i>mode in x direction</i>
<b>X </b>
<b>direction </b>
<b>Re(FRF)_max </b> <b>Re(FRF)_min </b> <b>Im(FRF)_min </b>
<b>Value </b>
<i><b>(m/N) </b></i>
<b>Frequency </b>
<i><b>(Hz) </b></i>
<b>Value </b>
<i><b> (m/N) </b></i>
<b>Frequency </b>
<i><b>(Hz) </b></i>
<b>Value </b>
<i><b> (m/N) </b></i>
<b>Frequency </b>
<i><b>(Hz) </b></i>
<i>Mode 1 </i> 1.659e-7 751 9.455e-8 817 -1.045e7 787
Mode 2 1.485e-7 920 -3.245e-8 1023 -1.957e7 970
Mode 3 1.314e-7 2769 9.752e-8 2887 -4.607e8 2830
Mode 4 1.603e-6 4113 -1.441e-6 4185 -3.068e6 4149
Mode 5 -1.140e-7 4452 -5.068e-7 4537 -5.103e7 4493
<i><b>Table 3. Pick the peak values of imaginary parts and the corresponding values of frequencies for each </b></i>
<i>mode in y direction</i>
<b>Y </b>
<b>direction </b>
<b>Re(FRF)_max </b> <b>Re(FRF)_min </b> <b>Im(FRF)_min </b>
<b>Value </b>
<i><b>(m/N) </b></i>
<b>Frequency </b>
<i><b>(Hz) </b></i>
<b>Value </b>
<i><b> (m/N) </b></i>
<b>Frequency </b>
<i><b>(Hz) </b></i>
<b>Value </b>
<i><b> (m/N) </b></i>
<b>Frequency </b>
<i><b>(Hz) </b></i>
<i>Mode 1 </i> 2.544e-7 770 1.510e-8 837 -2.512e7 804
Mode 2 1.485e-7 920 -3.245e-8 1023 -1.957e7 970
Mode 3 1.603e-6 4113 -1.441e-6 4185 -3.068e6 4149
</div>
<span class='text_page_counter'>(4)</span><div class='page_container' data-page=4>
qi
0 0.2 0.4 0.6 0.8 1 1.2 1.4 1.6 1.8 2
x 104
0
5
10
15
20
(rpm)
b lim
(m
m
)
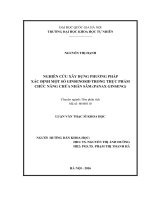
Stability lobe diagram with Fourier series approach
<i><b>Fig. 3. The stability lobe diagram from Simulation </b></i>
In addition, from peak picking modal fit, the
model parameters can be calculated by using
equations from (2) to (5). These model
parameters in x and y directions are
represented in Table 4 and 5, respectively.
RESULTS AND DISCUSSIONS
The direct FRF in x and y directions can be
reconstructed by using model
parametersobtained by peak picking modal fit
that have been presented in [1]. In this present
work, the slot milling on a block of
Aluminum 7050-T7H51 were supposed, for
the force angle β = 65.91°, and the specific
<i>cutting force coefficient Ks</i> = 800 N/mm2. A
stability lobe diagram then was obtained by
using Fourier series approach [3] shown in
Figure 3. Figure 4 represents the stability lobe
diagram that obtained from TXFTM software.
In general, the simulation results are quite
close to that of the software.
</div>
<span class='text_page_counter'>(5)</span><div class='page_container' data-page=5>
<i><b>Fig. 4. The stability lobe diagram from TXF</b>TM </i>
CONCLUSIONS
In this study, the impact tests with impulse
loads were used to determine mode shapes
and natural frequencies of an end milling. The
model parameters and stability lobe diagram
were obtained by using the MetalmaxTM.
Another stability lobe diagram was obtained
by using a MatlabR program with Fourier
series approach. A comparison of both
approaches was done and shown that the
simulation result is very close to that of the
software.Thispresent work also contributes to
a better understanding to create the stability
lobe diagram.
REFERENCES
<i>1. Schmitz, L., Smith S., (2008), Machining </i>
<i>Dynamics: Frequency Response to Improved </i>
<i>Productivity, Springer Science & Business Media. </i>
2. Altintas, Yusuf (2012), <i>Manufacturing </i>
<i>automation: Metal cutting mechanics, machine </i>
<i>tool vibrations, and CNC design. Cambridge </i>
university press.
3. Tobias A., Fishwick W. (1958), “Theory of
<i>regenerative machine tool chatter”, The engineer, </i>
205 (7), pp. 199-203.
4. Abele E., Fiedler U. (2004), “Creating Stability
<i>Lobe Diagrams during Milling”, CIRP Annals - </i>
<i>Manufacturing Technology, 53, pp. 309-312. </i>
5. Jianping Yue (2006), “Creating a Stability Lobe
Diagram”, <i>Proceedings </i> <i>of </i> <i>the </i> <i>IJME </i> <i>– </i>
<i>INTERTECH Conference. </i>
6. Altintas Y., Budak E. (1995), “Analytical
<i>prediction of stability lobes in milling”, CIRP </i>
<i>Annals - Manufacturing Technology, 44 (1), pp. </i>
357-362.
</div>
<span class='text_page_counter'>(6)</span><div class='page_container' data-page=6>
Metalmax . Phần mềm TXF sau đó được sử dụng nhằm xác định các thông số động lực học
của mũi dao phay. Cuối cùng, thông qua một chương trình mơ phỏng trên MatlabR<sub>, biểu đồ ổn </sub>
định gia công đã được xây dựng sử dụng phương pháp chuỗi Fourier. Kết quả mô phỏng thu được
phù hợp với các kết quả từ phần mềm TXFTM<sub>. </sub>
<i><b>Từ khóa: Tự rung trong gia công, Biểu đồ ổn định gia công, Động lực học mũi dao phay, Động </b></i>
<i>lực học quá trình cắt </i>
<i><b>Ngày nhận bài: 01/11/2017; Ngày phản biện: 15/11/2017; Ngày duyệt đăng: 05/01/2018 </b></i>
</div>
<!--links-->