A comparative study on the horizontal coefficient of consolidation (Cr) obtained from lab and field tests
Bạn đang xem bản rút gọn của tài liệu. Xem và tải ngay bản đầy đủ của tài liệu tại đây (6 MB, 93 trang )
<span class='text_page_counter'>(1)</span><div class='page_container' data-page=1>
VIETNAM NATIONAL UNIVESITY, HANOI
<b>VIETNAM JAPAN UNIVERSITY</b>
<b>Hanoi, 2020 </b>
<b>TRAN QUYNH GIAO </b>
<b>A COMPARATIVE STUDY ON </b>
<b>THE HORIZONTAL </b>
<b>COEFFICIENT OF </b>
<b>CONSOLIDATION (C</b>
<b>r</b>
<b>) OBTAINED </b>
<b>FROM LAB TESTS </b>
</div>
<span class='text_page_counter'>(2)</span><div class='page_container' data-page=2>
VIETNAM NATIONAL UNIVESITY, HANOI
<b>VIETNAM JAPAN UNIVERSITY</b>
<b>Hanoi, 2020</b>
<b>TRAN QUYNH GIAO </b>
<b>A COMPARATIVE STUDY ON </b>
<b>THE HORIZONTAL </b>
<b>COEFFICIENT OF </b>
<b>CONSOLIDATION (C</b>
<b>r</b>
<b>) OBTAINED </b>
<b>FROM LAB TESTS </b>
<b>MASTER’S THESIS </b>
<b>MAJOR: INFRASTRUCTURE ENGINEERING</b>
<b>CODE: 8900201.04 QTD</b>
</div>
<span class='text_page_counter'>(3)</span><div class='page_container' data-page=3>
i
<b>ABSTRACT </b>
When a soft ground is improved by PVDs, consolidation takes place under the
condition of drainage in both horizontal and vertical directions. Naturally,
<i>horizontal coefficient of consolidation (c</i>r) is larger than the vertical coefficient of
<i>consolidation (c</i>v<i>) by a factor of 3 to 5. The c</i>v value is commonly interpreted from
consolidation test using incremental loading method [1]. However, up to date, there
have not been any similar standards for the consolidation test with horizontal
drainage (using incremental loading method).
The key goals of the research are: (1) determine the most reliable methods among
the proposed methods for determining the horizontal coefficient of consolidation
<i>(c</i>r<i>) in the literature; (2) determine correlations between c</i>r values obtained from
central drain (CD) test and peripheral drain (PD) test; (3) determine correlations
<i>between vertical coefficients of consolidation (c</i>v<i>) and radial c</i>r for a number of test
sites in Vietnam.
A desk study is carried out to secure the following: (1) a literature review on
<i>equipment used for the test and existing methods used to evaluate the cr</i> value; (2)
the thesis using data collected from the following sources literature review and test
site in Vietnam.
Overall, The most reliable methods for determining the horizontal coefficient of
<i>consolidation (cr) is non-graphical method and the root t can be used to determine </i>
<i>the radial (horizontal) coefficient of consolidation (cr</i>).
<i>c</i>r,PD<i> is less than the c</i>r,CD by a factor of 0.32 to 0.64 from intact samples and 0.33 to
0.58 from remolded samples.
<i> c</i>r PD<i> is larger than the c</i>v<i> by a factor of 0.90 to 2.33, c</i>r CD<i> is larger than the c</i>v by a
<i>factor of 2.14 to 5.12 from intact samples. c</i>r PD<i> is less than the c</i>v by a factor of 0.35
</div>
<span class='text_page_counter'>(4)</span><div class='page_container' data-page=4>
ii
<b> ACKNOWLEDGEMENTS </b>
I would like to express my sincere appreciation for the lecturers of Master of
Infrastructure Engineering Program for their help during my undergraduate at
Vietnam Japan University (VJU).
My thesis supervisor Dr. Nguyen Tine Dung for his enthusiasm, patience, advice
and continuous source of ideas for me. Dr. Dung is always ready to answer my
questions. His support in professional matters is invaluable.
I would like to acknowledge the sincere inspiration from Prof. Nguyen Dinh Duc
and Prof. Hironori Kato. Their lectures covered not only specialist knowledge but
also the responsibility and mission of a new generation of Vietnam. I am grateful to
Dr. Phan Le Binh for his support in the last two years since I have studied at
Vietnam Japan University. Thanks to him, I have learned the professional courtesy
of Japanese people as well as Japanese culture.
</div>
<span class='text_page_counter'>(5)</span><div class='page_container' data-page=5>
iii
<b>TABLE OF CONTENTS </b>
Page
ABSTRACT ... i
ACKNOWLEDGEMENTS ... ii
TABLE OF CONTENTS ... iii
LIST OF TABLES ... vi
LIST OF FIGURES ... vi
LIST OF ABBREVIATIONS ... viii
CHAPTER 1. INTRODUCTION ... 1
1.1 Problem statement ... 1
1.2 Necessity of study ... 3
1.3 Objectives ... 4
1.4 Scope of study ... 4
1.5 Structure of thesis ... 4
CHAPTER 2. LITERATURE REVIEW ... 6
2.1 Introduction ... 6
2.1.1 Consolidation Theory with Horizontal Drainage ... 8
2.1.2 Solution of the governing equation (2.2) for a central drain (CD) under
equal strain loading (ESL) condition ... 8
2.1.3 Solution of the governing equation (2.2) for a peripheral drain (PD)
under free strain loading (FSL) condition ... 9
2.1.4 Solution of the governing equation (2.2) for a peripheral drain (PD)
under equal strain loading (ESL) condition ... 9
2.2 Existing methods for determining cr from consolidation test with a peripheral
drain using incremental loading ... 10
2.2.1 Root t method [6] ... 10
2.2.2 Inflection point method [9] ... 11
2.2.3 Full – match method [10] ... 13
2.3 Existing methods for determining cr from consolidation test with a central
drain using incremental loading method ... 15
2.3.1 Root t method [11] ... 15
2.3.2 Matching log (de2/t) and Ur method [12] ... 16
2.3.3 Inflection point method [13] ... 17
2.3.4 Non-graphical method [14] ... 18
2.3.5 Log - log method [15] ... 19
2.3.6 Steepest tangent fitting method [16] ... 20
2.3.7 Log t method [17]... 22
2.3.8 Full – match method [10] ... 24
2.4 Summary of methods for determining cr ... 25
2.5 Linear regression analysis ... 25
2.6 Log normal distribution method ... 26
</div>
<span class='text_page_counter'>(6)</span><div class='page_container' data-page=6>
iv
3.1 Introduction ... 27
3.2 Data collection ... 28
3.3 Improvement for inflection point methods ... 28
3.3.1 Theoretical development ... 28
3.3.2 The procedure for this method ... 29
3.4 Analysis of Time – Compression curve ... 29
3.5 Procedure to select the best methods ... 30
3.6 Procedure to determine ratios of cr PD /cr CD or cr /cv ... 31
CHAPTER 4. TEST RESULTS & DISCUSSIONS ... 33
4.1 Introduction ... 33
4.2 Summary of database ... 33
4.2.1 Data collected from the literature ... 33
4.2.2 Data collected from test sites in Vietnam ... 34
4.2.3 Summary of test data ... 37
4.3 Evaluation and selection the best methods on intact samples ... 38
4.3.1 Graph results on intact samples ... 38
4.3.2 Summary of results on intact samples... 40
4.3.3 Summary of rank method on intact samples ... 47
4.4 Evaluation and selection the best methods on literature data ... 49
4.4.1 Graph results on literature data ... 49
4.4.2 Summary of results on literature data ... 51
4.4.3 Summary of rank method on literature data... 52
4.5 Evaluation and selection the best methods on remolded samples ... 54
4.5.1 Graph results on remolded samples ... 54
4.5.2 Summary of results on remolded samples ... 56
4.5.3 Summary of rank method on remolded samples ... 62
4.6 Comparison of cr CD and cr PD on intact samples ... 64
4.6.1 Graph results on intact samples ... 64
4.6.2 Summary of results on intact samples... 64
4.7 Comparison of cr CD and cr PD on remolded samples ... 66
4.7.1 Graph results on remolded samples ... 66
4.7.2 Summary of results from remolded samples... 66
4.8 Comparison of cv and cr PD on intact samples... 68
4.8.1 Graph results on intact samples ... 68
4.8.2 Summary of results on intact samples... 68
4.9 Comparison of cv and cr CD on intact samples ... 70
4.9.1 Graph results on intact samples ... 70
4.9.2 Summary of results on intact samples... 70
4.10 Comparison of cv and cr PD on remolded samples ... 72
4.10.1 Graph of results on remolded samples ... 72
4.10.2 Summary of results on remolded samples ... 72
4.11 Comparison of cv and cr CD on remolded samples ... 74
4.11.1 Graph results on remolded samples ... 74
</div>
<span class='text_page_counter'>(7)</span><div class='page_container' data-page=7>
v
</div>
<span class='text_page_counter'>(8)</span><div class='page_container' data-page=8>
vi
<b>LIST OF TABLES </b>
Page
Table 2.1. Boundary condition ... 9
Table 2.2. Existing methods for determining cr from radial consolidation ... 25
Table 4.1. Summary of data from literature for the PD – ESL condition ... 33
Table 4.2. Summary of data from literature for the CD – ESL condition ... 34
Table 4.3. Summary of tests done on intact samples ... 37
Table 4.4. Summary of tests done on remolded samples ... 37
Table 4.5. Summary of results from PD tests on intact samples ... 40
Table 4.6. Summary of results from CD tests on intact samples ... 42
Table 4.7. Rank of each criterion with each pressure from PD tests on intact
samples... 44
Table 4.8. Rank of each criterion with each pressure for CD case on intact samples
... 45
Table 4.9. Summary of rank for each method from PD tests on intact samples ... 47
Table 4.10. Summary of rank on each meth1od from CD tests on intact samples ... 48
Table 4.11. Summary of results from PD tests on literature for 8 methods. ... 51
Table 4.12. Summary of results from CD tests on literature for 8 methods. ... 52
Table 4.13. Summary of rank on each method from PD tests on literature ... 52
Table 4.14. Summary of rank on each method from CD tests on literature ... 53
Table 4.15. Summary results from PD tests on remolded samples for 8 methods ... 56
Table 4.16. Summary of results from CD tests on remolded samples for 8 methods
... 58
Table 4.17. Rank of each criterion with each pressure from PD tests on remolded
samples for 8 methods ... 59
Table 4.18. Rank of each criterion with each pressure from CD tests on remolded
samples for 8 methods ... 61
Table 4.19. Summary of rank each method from PD tests on remolded samples .... 62
Table 4.20. Summary of rank each method from CD tests on remolded samples .... 63
Table 4.21. Summary of results from PD and CD tests on intact samples ... 65
Table 4.22. Summary of boundary for PD and CD case on intact samples ... 65
Table 4.23. Summary of correlations for CD and PD case on remolded samples .... 67
Table 4.24. Summary of boundary for CD and PD case on remolded samples ... 67
Table 4.25. Summary of correlations for PD case on intact samples ... 69
Table 4.26. Summary of boundary for PD case on intact samples ... 69
Table 4.27. Summary of correlation for CD case on intact samples ... 71
</div>
<span class='text_page_counter'>(9)</span><div class='page_container' data-page=9>
vii
Table 4.29. Summary of correlations for PD case on remolded samples ... 73
Table 4.30. Summary of boundary for PD case on remolded samples ... 73
Table 4.31. Summary of correlations for CD method on remolded samples ... 75
</div>
<span class='text_page_counter'>(10)</span><div class='page_container' data-page=10>
viii
<b>LIST OF FIGURES </b>
Page
Figure 1.1. Map of distribution of major soil types in Indochinese ... 1
Figure 1.2. Soil phase diagram [3] ... 2
Figure 1.3. An Illustration of soft ground improved by PVDs ... 2
Figure 2.1. Research direction of the thesis [5] ... 7
Figure 2.2. Illustration of flow conditions for equal-strain case [6] ... 7
Figure 2.3. Time - deformation plot during consolidation for a given load increment
[3] ... 8
Figure 2.4. Consolidation curve relating square - Root time factor to for drainage
radially outwards to periphery with equal strain loading [6]. ... 11
Figure 2.5. Log (Ur/Tr) - log Ur relationship [10] ... 13
Figure 2.6. Determine the value of intersection point in full – match method ... 14
Figure 2.7. Theoretical log(de2/t) versus Ur curves [12] ... 16
<i>Figure 2.8. (a) Theretical U</i>r<i> - log T</i>r<i> curve and (b) d(U</i>r<i>)/dlog T</i>r plot [13] ... 17
Figure 2.9. Log( - 0) versus log t plot [15] ... 20
Figure 2.10. Steepest tangent fitting method for determination of cr ... 21
Figure 3.1. Flow chart of the study ...
Figure 3.2. Experimental data [9] ... 28
Figure 3.3. Flowchart of identifying the best methods ... 30
Figure 3.4. Flowchart of identifying the best methods ... 31
Figure 4.1. Locations of test sites in Viet Nam (VSIP site, DVIZ site, Kim Chung
site) ... 34
Figure 4.2. Test location at Kim Chung site ... 35
Figure 4.3. Test location at VSIP site ... 35
Figure 4.4. Test location at DVIZ site ... 35
Figure 4.5. Soil profile at DVIZ ... 36
Figure 4.6. Soil profile at VSIP ... 36
Figure 4.7. Soil profile at KC ... 36
Figure 4.8. Results from PD tests on intact samples (at 800 kPa) for 8 methods ... 38
Figure 4.9. Results from CD tests on intact samples (at 800 kPa) for 8 methods .... 39
Figure 4.10. Results from PD tests on intact samples (at 800 kPa) for 8 methods ... 49
Figure 4.11. Results from CD tests on literature for 8 methods ... 50
Figure 4.12. Results from PD tests on remolded samples (at 800 kPa) for 8 methods
... 54
</div>
<span class='text_page_counter'>(11)</span><div class='page_container' data-page=11>
ix
<i>Figure 4.15. Comparison of cr CD and cr PD </i>obtained from non-graphical method at all
data ... 64
<i>Figure 4.16. Comparison of c</i> r,CD<i> and c</i>r,PD<i> obtained from root t method at all data 66</i>
<i>Figure 4.17. Comparison of c</i>r CD<i> and c</i>r PD obtained from non-graphical method at
all data ... 66
<i>Figure 4.18. Comparison of c</i>v<i> and c</i>r,PD<i> obtained from root t method at all data ... 68</i>
<i>Figure 4.19. Comparison of c</i>v<i> and c</i>r,PD obtained from non-graphical method at all
data ... 68
<i>Figure 4.20. Comparison of c</i>v<i> and cr CD, obtained from root t method at all data .... 70</i>
<i>Figure 4.21. Comparison of c</i>v<i> and c</i>r CD obtained from non-graphical method at all
data ... 70
<i>Figure 4.22. Comparison of c</i>v<i> and c</i>r,PD<i> obtained from root t method at all data .... 72</i>
<i>Figure 4.23. Comparison of c</i>v<i> and c</i>r,PD obtained from non-graphical method at all
data ... 72
<i>Figure 4.24. Comparison of c</i>v<i> and c</i>r,CD<i> obtained from root t method at all data .... 74</i>
</div>
<span class='text_page_counter'>(12)</span><div class='page_container' data-page=12>
x
<b>LIST OF ABBREVIATIONS </b>
<i>c</i>r Horizontal coefficient of consolidation
<i>c</i>r,CD Horizontal coefficient of consolidation under for a central
drain (CD) condition
<i>c</i>r,PD
Horizontal coefficient of consolidation under for a
peripheral drain (PD) condition
<i>c</i>r,Root CD Horizontal coefficient of consolidation form root t method
under for a central drain (CD) condition
<i>c</i>r,NG PD
Horizontal coefficient of consolidation form non-graphical
method under for a peripheral drain (PD) condition
<i>c</i>v Vertical coefficient of consolidation
<i>d</i>e Diameter of the soil sample
<i>d</i>w Drain diameter
<i>f </i> Source/sink term; function; cyclic load natural frequency
<i>n </i> Ratio of influence radius to drain radius
<i>r </i> Radial coordinate
<i>t </i> Time
<i>t50</i> Time required to reach 50% consolidation
<i>t90</i> Time required to reach 90% consolidation
<i>t66</i> Time required to reach 66% consolidation
<i>tinf</i> <i>Time at d(U</i>r<i>) /dlog T</i>r the maximum.
<i>Tr</i> Time factor for horizontal consolidation
<i>T90</i> Time factor for horizontal consolidation to reach 90% <sub>consolidation </sub>
<i>T66</i> Time factor for horizontal consolidation to reach 66% <sub>consolidation </sub>
<i>Tv</i> Time factor for vertical consolidation
<i>U </i> Degree of consolidation
<i>u </i> Pore-water pressure
<i>Δu </i> Change in pore pressure
0 Initial settlement
100 Finally settlement at Primary consolidation
t Settlement at time t
p Predicted settlement
m Measured settlement
</div>
<span class='text_page_counter'>(13)</span><div class='page_container' data-page=13>
xi
<i>k</i>v Permeability coefficient from vertical consolidation
<i>m</i>r Soil stiffness from radial consolidation
<i>m</i>v Soil stiffness from vertical consolidation
</div>
<span class='text_page_counter'>(14)</span><div class='page_container' data-page=14>
1
<b>CHAPTER 1. INTRODUCTION </b>
<b>1.1 Problem statement </b>
Fig. 1.1 shows a typical map of distribution of major soil types in Viet Nam.
Among the soil types, the soft and young deposits distributed in major deltas in
Vietnam (Red River Delta, Mekong Delta and Saigon – Dongnai River delta) and
along the coast are very much concerned in construction of the infrastructure
system.
</div>
<span class='text_page_counter'>(15)</span><div class='page_container' data-page=15>
2
In this area, civil constructions and seaports must take measures to treat the ground
before construction.
The objectives of ground treatment are:
- To increase bearing capacity of the ground
- To decrease the permeability of soil
Therefore, there are many methods used to reinforce or to increase the stiffness of
the soft soil, in which consolidating the soft soil is one of the methods. According to
soil mechanics theory, soil is formed from two or three phases (see Figure 1.2). The
voids surrounding the soil particles are filled by water, air or a combination of both.
Consolidation is the process of contraction of voids under the applied load in
association with the process of water drainage.
Figure 1.2. Soil phase diagram [3]
Among several common ground improvement methods in practice, ground
improvement by Prefabricated Vertical Drain (PVD) is one of the methods most
commonly applied in practice. Fig. 1.3 shows a typical configuration of ground
improved by PVDs.
</div>
<span class='text_page_counter'>(16)</span><div class='page_container' data-page=16>
3
Under the surcharge loading, drainage in the ground improved by PVDs takes place
in two directions (as show in Figure 1.3): vertical direction and horizontal (radial)
direction. The consolidation settlement of the ground therefore happens due to both
vertical and horizontal drains.
<b>1.2 Necessity of study </b>
When a soft ground is improved by PVDs, consolidation takes place under the
condition of drainage in both horizontal and vertical directions. Naturally,
<i>horizontal coefficient of consolidation (c</i>r) is larger than the vertical coefficient of
<i>consolidation (c</i>v) by a factor of 3 to 5. In addition, in many cases, when the soft
clay layer is thick, the consolidation would happen mainly due to the horizontal
drainage. The cr value is therefore very important for the design, sometimes much
more important than the cv value.
<i>Currently, the c</i>v value is commonly interpreted from consolidation test using
incremental loading method [1]. This is because the method is simple and
applicable in routine laboratories around the world. However, up to date, there have
not been any similar standards for the consolidation test with horizontal drainage
(using incremental loading method). Although cr value might be determined from
some Constant Rate of Strain (CRS) tests (e.g., Chung 2019, Sridharan 1996…), the
<i>equipment and test procedures are too complicated to apply in routine tests. Thus, c</i>r
value is mostly obtained from empirical correlations, for example from cv value.
<i> In the literature, there are about 10 methods suggested to determine c</i>r value
obtained from result of the consolidation test with horizontal drainage using
incremental loading. However, it is unclear as which methods are the best. In
<i>addition, there have been no systematic studies on c</i>r value of soft clay in the North
of Vietnam. It is therefore very necessary to make a comparative study on the
<i>methods to determine the c</i>r value and the value for soft clay in the North of
</div>
<span class='text_page_counter'>(17)</span><div class='page_container' data-page=17>
4
<b>1.3 Objectives </b>
The main objectives of the study are:
1. To determine the most reliable methods among the proposed methods for
<i>determining the horizontal coefficient of consolidation (c</i>r) in the literature;
<i>2. To determine correlations between c</i>r values obtained from central drain (CD)
test and peripheral drain (PD) test;
<i>3. To determine correlations between vertical coefficients of consolidation (c</i>v) and
<i>radial c</i>r for a number of test sites in Vietnam.
<b>1.4 Scope of study </b>
The scope of the study is limited to the following:
- Collect existing data in the literature and data from experiments of the
supervisor‟s research program.
- Perform analytical analyses to obtain the three objectives described above.
Test data on consolidation test with radial drainage (using incremental loading
method) are collected from the following sources:
- Existing data from the literature (remolded samples);
- Test site in Kim Chung – Di Trach (Hanoi) (both remolded and intact
samples).
- Test site in Dinh Vu Industrial Zone (DVIZ) (Hai Phong) test data (intact
samples).
- Test site in Vietnam Singarpore Industrial Park (VSIP) (Hai Phong) (both
remolded and intact samples).
<b>1.5 Structure of thesis </b>
The rest of the thesis is organized as follows.
</div>
<span class='text_page_counter'>(18)</span><div class='page_container' data-page=18>
5
- Chapter 3: Describes the methodologies used to evaluate the coefficients and
correlations
- Chapter 4: Methodology provides methods for determining cr values for PD
& CD cases and provides evaluation methods to select the best methods.
- Chapter 5: Outlines, discusses the results obtained and describes the
</div>
<span class='text_page_counter'>(19)</span><div class='page_container' data-page=19>
6
<b>CHAPTER 2. LITERATURE REVIEW </b>
<b>2.1 Introduction </b>
When a soil layer is subjected to a compressive stress, such as during the
construction of a structure, it will exhibit a certain amount of compression. This
compression is achieved through a number of ways, including rearrangement of the
soil solids or extrusion of the pore air and/or water. Terzaghi (1943) recommends,
“A decrease of water content of a saturated soil without replacement of the water by
air is called a process of consolidation”.
Terzaghi (1943) first suggested the one-dimensional consolidation testing
procedure. This test performed in a consolidometer (sometimes referred to as an
Odometer).
Baron [4] (1948) presented the basic theory of sand drains. In key study of sand
drains, the author has two fundamental cases.
- Free-strain case: When the surcharge applied at the ground surface is of a
flexible nature, there will be equal distribution of surface load. This will
result in an uneven settlement at the surface.
- Equal-strain case: When the surcharge applied at the ground surface is rigid,
the surface settlement will be the same all over. However, this will result in
an unequal distribution of stress.
</div>
<span class='text_page_counter'>(20)</span><div class='page_container' data-page=20>
7
Figure 2.1. Research direction of the thesis [5]
A peripheral drain (PD) case A central drain (CD) case
Figure 2.2. Illustration of flow conditions for equal-strain case [6]
To obtain a coefficient of consolidaiton, a curve of time vesus deformation (Figure
2.3) obtained from consolidation test is taken into analysis. The curve has three
distinct stages described as follows [3]:
- Stage I: Initial compression, which is caused mostly by preloading.
- Stage II: Primary consolidation, during which excess pore water pressure
gradually is transferred into effective stress because of the expulsion of pore
water.
</div>
<span class='text_page_counter'>(21)</span><div class='page_container' data-page=21>
8
Figure 2.3. Time - deformation plot during consolidation for a given load increment [3]
<i><b>2.1.1 Consolidation Theory with Horizontal Drainage </b></i>
Barron [4] (1948) developed the basic theory of consolidation. The governing
differential equation for the dissipation of excess pore water pressure in both
horizontal and vertical drainage directions under the equal strain loading (ESL)
condition is:
2 2
2 2
w w
1
1
<i>v</i> <i>v</i>
<i>r</i> <i>k</i> <i>a</i>
<i>k</i> <i>u</i> <i>u</i> <i>u</i> <i>u</i>
<i>r r</i> <i>r</i> <i>z</i> <i>e</i> <i>t</i>
<sub></sub> <sub></sub> <sub></sub>
<sub></sub> <sub></sub> <sub></sub> <sub></sub> <sub></sub>
<sub> </sub> <sub> </sub> <sub> </sub>(2.1)
<i>In case of only horizontal drainage direction (k</i>v = 0), Eq. (2.1) becomes:
2
2
1
<i>r</i>
<i>u</i> <i>u</i> <i>u</i>
<i>c</i>
<i>r r</i> <i>r</i> <i>t</i>
<sub></sub> <sub></sub> <sub></sub>
<sub> </sub> <sub> </sub>(2.2)
<i><b>2.1.2 Solution of the governing equation (2.2) for a central drain (CD) under </b></i>
<i><b>equal strain loading (ESL) condition </b></i>
</div>
<span class='text_page_counter'>(22)</span><div class='page_container' data-page=22>
9
<sub></sub>
<i>n</i>
<i>F</i>
<i>T</i>
<i>u</i>
<i>u</i>
<i>U</i> <i>r</i>
<i>r</i>
8
exp
1
1
0
(2.3)
where the Time factor (Tr) is defined as follows:
2
/
<i>r</i> <i>r</i> <i>e</i>
<i>T</i> <i>c t d</i> (2.4)
<i>where de is the diameter of the soil sample, and the function F(n) is defined as </i>
follows:
<sub></sub>
2 2<sub></sub>
2 2
3 1
ln
4
1
<i>n</i>
<i>n</i>
<i>F n</i> <i>n</i>
<i>n</i>
<i>n</i>
<i> </i>
(2.5)
/
<i>e</i> <i>w</i>
<i>n d d</i> <i><sub> (2.6) </sub></i>
<i>where n = spacing ratio, d</i>w = diameter of the drain
<i><b>2.1.3 Solution of the governing equation (2.2) for a peripheral drain (PD) under </b></i>
<i><b>free strain loading (FSL) condition </b></i>
For a PD under free strain loading (FSL) condition, Silverira [7] (1951) solved the
governing equation (Eq. 2.2) using the following boundary conditions.
Table 2.1. Boundary condition
<b>No. </b> <b>Condition </b> <b>Result </b>
1 <i>t = 0, d</i>e<i> ≥ r ≥ 0.</i> <i>u = u</i>o
3 <i>t 0, r = d</i>e/2 <i>u = 0</i>
4 <i>t 0, r = 0.</i> u<i>(r,t)/</i>r = 0
The solution is expressed as follows:
<i>n</i> <i>r</i>
<i>n</i>
<i>n</i> <i>n</i>
<i>r</i> <i>B</i> <i>T</i>
<i>B</i>
<i>u</i>
<i>u</i>
<i>U</i> 2
1 2
0
4
exp
1
4
1
1
<sub> </sub>(2.7)
<i><b>2.1.4 Solution of the governing equation (2.2) for a peripheral drain (PD) under </b></i>
<i><b>equal strain loading (ESL) condition </b></i>
For a PD under the equal strain loading (ESL) condition, the solution of the
governing equation is expressed as follows [8].
<i><sub>r</sub></i>
<i>r</i> <i>T</i>
<i>u</i>
<i>u</i>
<i>U</i> 1 1 exp 32
</div>
<span class='text_page_counter'>(23)</span><div class='page_container' data-page=23>
10
<i><b>2.2 Existing methods for determining cr from consolidation test with a </b></i>
<b>peripheral drain using incremental loading </b>
<i><b>2.2.1 Root t method [6] </b></i>
<i> Introduction </i>
<i>2.2.1.1</i>
The method proposed based on the equation for the equal vertical strain condition
[4]. Settlement and volume – change measurements govern by the deformation of
the sample, as a whole analysis is dependent on an overall “average” behavior.
Some method of “curve fitting” is necessary for graph base on these measurements
relate to the conditions at a particular point [6].
<i>In PD case, slope factor is 1.17 and the value of T</i>90 is 0.288 [6].
The radial (horizontal) coefficient of consolidation is determined in this case:
2
90
0.288 <i><sub>e</sub></i>
<i>r</i>
<i>d</i>
<i>c</i>
<i>t</i>
<i> </i>
(2.9)
<i> The procedure for determine cr </i>
<i>2.2.1.2</i>
- Step 1: Graph with <i> - t</i>0.5<i> then finding a straight line within U</i>r = 20% to
<i>U</i>r = 60% on the curve
- Step 2: Drawing a second line with the ratio of the length of vertical axis is
<i>(second line / the straight line in step 1) = 1.17. </i>
- Step 3: Find the intersection of a second line (Step 2) and consolidation
<i>curve. This point is t</i>90.
</div>
<span class='text_page_counter'>(24)</span><div class='page_container' data-page=24>
11
Figure 2.4. Consolidation curve relating square - Root time factor to for drainage
radially outwards to periphery with equal strain loading [6].
<i> Evaluation of the method </i>
<i>2.2.1.3</i>
<b>Advantages </b>
- This method is easy to practice for all engineers.
<i>- Determination of c</i>r in this method does not require the determination of 0
and 100.
<i>- The definition is a straight line within U</i>r<i> = 20% to U</i>r = 60% on the curve
<b>Disadvantages </b>
<i>- c</i>r,90 is influenced by secondary consolidation.
<i><b>2.2.2 Inflection point method [9] </b></i>
<i> Introduction </i>
<i>2.2.2.1</i>
Ganesalingam [9] (2013) solved the governing equation for the relationship
<i>U</i>r<i> = f[log (T</i>r<i>)]. The value of U</i>r maximum is the position of the derivative
<i>d(U</i>r<i>)/dlog T</i>r<i> the maximum. Chung (2019) redefines the value of T</i>r<i> with dU/d(lnt). </i>
<i>The value of T</i>r is 1/32 = 0.03125.
<i>In thesis, the author recommends that the value of T</i>r<i> calculated with dU/logT</i>r.
<i>Time factor can determine with value of y. </i>
log <i><sub>r</sub></i>
<i>y</i> <i>T</i>
<i> </i>(2.10)
In which
10 ln10<i>y</i>
<i>r</i>
<i>dy dT</i>
</div>
<span class='text_page_counter'>(25)</span><div class='page_container' data-page=25>
12
Substituting of Eq. (2.4) from Eq. (2.10). The settlement (<i>) collateral t is expressed </i>
100 0
1 exp( 32.10 ) 0<i>y</i>
<sub></sub> <sub></sub>
<i> </i>(2.12)
<i>Derivative of v = -32.10</i>y
32.10 ln10<i>y</i>
<i>dv</i> <i>dy</i>
<i> </i>(2.13)
<i>The derivative for Eq. (2.13) with the variable T</i>r
100 0
exp 32.10
32.10 .ln 10
log( )
<i>y</i> <i>y</i>
<i>r</i>
<i>d</i> <i>d</i> <i>d dv</i>
<i>d</i> <i>T</i> <i>dy</i> <i>dv dy</i>
<sub></sub> <sub></sub> <sub> </sub><sub></sub> <sub></sub> <sub></sub><sub></sub> <sub></sub> <sub> </sub><sub></sub> <sub></sub>
100 0
exp 32.
32. .ln 10
log( )<i><sub>r</sub></i> <i>r</i> <i>r</i>
<i>d</i> <i>d</i> <i>d dv</i>
<i>T</i> <i>T</i>
<i>d</i> <i>T</i> <i>dy</i> <i>dv dy</i>
<sub></sub> <sub></sub> <sub></sub><sub></sub> <sub></sub> <sub></sub><sub></sub> <sub></sub> <sub> </sub> <sub></sub>
<i> </i>
(2.14)
<i>Substituting of u, v </i>
100 0
exp 32.10
<i>y</i>
<i>u</i>
100 0
32.10 ln 10 exp 32.10
<i>y</i> <i>y</i>
<i>du</i>
<sub></sub> <sub></sub>
32.10 ln 10<i>y</i>
<i>v </i> <sub></sub><i><sub>dv</sub></i><sub></sub>32.10 ln 10<i>y</i><sub></sub>
<sub></sub>2<i><sub>dy</sub></i> <sub> </sub>(2.15)
<i>The derivative for Eq. (2.15) with the variable T</i>r
2 2
2
log( )<i><sub>r</sub></i>
<i>d uv</i>
<i>d</i> <i>d</i> <i>du</i> <i>dv</i>
<i>v u</i>
<i>dy</i> <i>dy</i> <i>dy</i> <i>dy</i>
<i>d</i> <i>T</i>
<sub></sub> <sub></sub> <sub></sub> <sub></sub>
2 2
2
2 exp 32.10 32.10 . ln 10 1 32.10
log( )
<i>y</i> <i>y</i> <i>y</i>
<i>r</i>
<i>d</i> <i>d</i>
<i>dy</i>
<i>d</i> <i>T</i>
<sub></sub> <sub></sub><sub></sub> <sub></sub> <sub></sub> <sub></sub> <sub></sub> <sub></sub>
2 2
2
2 exp 32 32. . ln 10 1 32.
log( )<i><sub>r</sub></i> <i>r</i> <i>r</i> <i>r</i>
<i>d</i> <i>d</i>
<i>T</i> <i>T</i> <i>T</i>
<i>dy</i>
<i>d</i> <i>T</i>
<sub></sub> <sub></sub><sub></sub> <sub></sub> <sub></sub> <sub></sub> <sub></sub> <sub></sub>
<i> </i>
(2.16)
<i>The last term (1 – 32T</i>r) should be zero to obtain d2<i>/d(log T</i>r)2 = 0. Therefore
r,inf
1
0.03125
32
<i>T</i>
<i> </i>
(2.17)
The radial (horizontal) coefficient of consolidation is determined in this case:
2
inf
0.03125 <i><sub>e</sub></i>
<i>r</i>
<i>d</i>
<i>c</i>
<i>t</i>
<i> </i>
(2.18)
<i> The procedure for determine cr </i>
<i>2.2.2.2</i>
</div>
<span class='text_page_counter'>(26)</span><div class='page_container' data-page=26>
13
<i>- Step 2: Plot (U</i>r<i> - log T</i>r<i>) to t then find time max value (U</i>r<i> - log T</i>r). This is
<i>the value t</i>inf.
<i>- Step 3: c</i>r is calculated using Eq.(2.18).
<i> Evaluation of the method </i>
<i>2.2.2.3</i>
<b>Advantages </b>
<i>- Determination of c</i>r in this method does not require the determination of 0
and 100.
<i>- The infection point method can find t</i>inf.
<b>Disadvantages </b>
<i>- There is no method to find t</i>inf from experimental data.
- The accuracy of results depends on the time distance between measurement
results
<i><b>2.2.3 Full – match method [10] </b></i>
<i> Introduction </i>
<i>2.2.3.1</i>
This method combines two methods: graphical method and non – graphical
<i>matching method. The relationship between [log(U</i>r<i>/T</i>r<i>) & logU</i>r] studied to
characterize for between the two straight lines in primary consolidation and
secondary compression.
Figure 2.5. Log (Ur/Tr) - log Ur relationship [10]
</div>
<span class='text_page_counter'>(27)</span><div class='page_container' data-page=27>
14
The theoretical solutions (PD case and CD case) are rearranged in terms of time:
100
1 exp( )
<i>m</i> <i>o</i>
<i>r</i>
<i>ult</i> <i>o</i>
<i>U</i> <i>t</i>
<i><sub> </sub></i>(2.19)
The radial (horizontal) coefficient of consolidation is determined in this case:
2
32
<i>e</i>
<i>r</i>
<i>d</i>
<i>C</i>
<i> </i> <i> </i>
(2.20)
<i> The procedure for determine cr from Full – match method </i>
<i>2.2.3.2</i>
<i>- Step 1: A log (δ/t) – log δ graph is plotted using the monitored data, and an </i>
<i>intersection (δ</i>int) between two straight lines is determined.
<i>- Step 2: A selected δ – t data range (0 – δ</i>int) is substituted into Eq. (2.19) and
<i>the unknowns (δ</i>0<i> & η) are appropriately determined using the Microsoft </i>
Excel Solver.
<i>- Step 3: With η, d</i>e<i> ,F</i>n<i> and c</i>r is calculated using Eq. (2.20)
Figure 2.6. Determine the value of intersection point in full – match method
<i> Evaluation of the Full – match method </i>
<i>2.2.3.3</i>
<b>Advantages </b>
- It inherits the advantages of method a graphical method.
<i>- Value an ultimate settlement δ</i>ult is determined exactly.
Log <i> (mm) </i>
</div>
<span class='text_page_counter'>(28)</span><div class='page_container' data-page=28>
15
<b>Disadvantages </b>
- The way to choose two straight lines is relative.
<i>- Determining the value of δ</i>ult on the logarithmic coordinate system is often
difficult
<i><b>2.3 Existing methods for determining cr from consolidation test with a central </b></i>
<b>drain using incremental loading method </b>
<i><b>2.3.1 Root t method [11] </b></i>
<i> Introduction </i>
<i>2.3.1.1</i>
The method proposed based on the equation for the equal vertical strain condition
<i>[4]. In Eq. (2.3) have U</i>r<i> = f[T</i>r<i>, F(n)] then the author can find T</i>r <i>= f[U</i>r<i>, F(n)]. </i>
(n) ln(1 U )
8
<i>r</i>
<i>r</i>
<i>F</i>
<i>T</i>
<i> </i> <i> </i>
(2.21)
<i>T</i>90<i> is the time factor at 90% average degree of consolidation so the value of T</i>90 can
<i>calculated by F(n), U</i>r.
Berry (1969) commented that all the curve show linear portions between about 20%
- 60% average degree of consolidation. Thus a straight line is drawn through the
experimental volume change –t0.5 results between about 20% to 60% consolidation,
and a second line is then constructed having an abscissa 1.17 time that of the first
[11].
The radial (horizontal) coefficient of consolidation is determined in this case:
2
90
90
<i>e</i>
<i>r</i>
<i>T d</i>
<i>c</i>
<i>t</i>
<i> </i> <i> </i> <i> </i>
(2.22)
<i> The procedure for determine cr </i>
<i>2.3.1.2</i>
The steps for determining the radial (horizontal) coefficient are the same as
described in section.2.2.1.2
<i> Evaluation of the method </i>
<i>2.3.1.3</i>
<b>Advantages </b>
</div>
<span class='text_page_counter'>(29)</span><div class='page_container' data-page=29>
16
<i>- Identify a straight line within U</i>r<i> = 20% to U</i>r = 60% on the curve.
- This method does not need to find value 0 and 100.
<b>Disadvantages </b>
- Straight line depends on the subjective evaluation of data processing
engineers
<i><b>2.3.2 Matching log (d</b><b>e</b><b>2</b><b>/t) and U</b><b>r</b><b> method [12] </b></i>
<i> Introduction </i>
<i>2.3.2.1</i>
The method proposed based on the equation for the equal vertical strain condition
<i>[4]. This approach solves the equation of Eq. (2.3) to find the dependence of T</i>r on
<i>U</i>r<i> & F(n) then replaces T</i>r <i>= f[U</i>r<i>, F(n)] into Eq.(2.4). </i>
<i>Thus, the radial (horizontal) coefficient of consolidation (c</i>r) is determined
2 <sub>8</sub>
( ) ln(1 U )
<i>e</i> <i>r</i>
<i>r</i>
<i>d</i> <i>c</i>
<i>t</i> <i>F n</i> <sub> </sub> <sub> </sub>(2.23)
<i> The procedure for determine cr </i>
<i>2.3.2.2</i>
<i>- Step 1: Plot log (d</i>e2<i>/t) versus U</i>r<i> curve considering the δ - t data </i>
on Figure 2.7.
- Step 2: Identify a zone where the experimental curve is parallel to
the theoretical curves
<i>- Step 3: Using graphical or Eq. (2.23) can be determined c</i>r.
</div>
<span class='text_page_counter'>(30)</span><div class='page_container' data-page=30>
17
<i> Evaluation of the method </i>
<i>2.3.2.3</i>
<b>Advantages </b>
<i>- c</i>r can determine easily by the graph.
<b>Disadvantages </b>
- Matching between theoretical and experimental curve does not always occur
<i>- The variable U</i>r needs to determine exact values for 0 &100.
<i><b>2.3.3 Inflection point method [13] </b></i>
<i> Introduction </i>
<i>2.3.3.1</i>
The method was developed based on [13] and [4]. Eq. (2.3) can show the
<i>relationship U</i>r<i> = f[log (T</i>r)].
<i>According to the mathematical definition, the value of U</i>r maximum when the
<i>derivative d(U</i>r<i>)/dlog T</i>r the maximum.
<i>Figure 2.8. (a) Theretical U</i>r<i> - log T</i>r<i> curve and (b) d(U</i>r<i>)/dlog T</i>r plot [13]
In this case, The degree of consolidation at the inflection point also the same for all
<i>the curves at U</i>r<i> = U</i>r,inf = 63,21% with maximum derivative .
</div>
<span class='text_page_counter'>(31)</span><div class='page_container' data-page=31>
18
r,inf
(n)ln(1 0.631) (n)
8 8
<i>F</i> <i>F</i>
<i>T</i>
(2.24)
The radial (horizontal) coefficient of consolidation is determined in this case:
2
inf
( )
8
<i>e</i>
<i>r</i>
<i>d</i>
<i>F n</i>
<i>c</i>
<i>t</i>
(2.25)
<i> The procedure for determine cr </i>
<i>2.3.3.2</i>
<i>- Step 1: Plot (U</i>r<i> - log t) to t then finding time at max value (U</i>r<i> - log t). This is </i>
<i>the value t</i>inf.
<i>- Step 2: c</i>r<i> can be determined c</i>r by Eq.(2.25)
<i> Evaluation of the method </i>
<i>2.3.3.3</i>
<b>Advantages </b>
- 0, 100 does not need to be identified.
<i>- In this method, the author finds t</i>inf value.
<b>Disadvantages </b>
- There is no method yet to find tinf from Experimental data.
- The accuracy of results depends on the time distance between measurement
results.
<i><b>2.3.4 Non-graphical method [14] </b></i>
<i> Introduction </i>
<i>2.3.4.1</i>
The method proposed based on the equation for the equal vertical strain condition
[4].
<i>The laboratory time (t) – compression </i>r is described by the equation.
100 0
<i>r</i> <i>Ur</i>
(2.26)
<i>U</i>r is change in Eq. (2.26) from [4].
100 ,0
2 08
1 exp
( )
<i>r</i>
<i>r</i> <i>r</i>
<i>e</i>
<i>C t</i>
<i>F n</i> <i>d</i>
<sub></sub> <sub></sub> <sub></sub><sub></sub>
(2.27)
<i>Combine Eq of (2.27) and constant values of d</i>e and 100<i>, </i>0<i>. F(n) can be found by </i>
</div>
<span class='text_page_counter'>(32)</span><div class='page_container' data-page=32>
19
<i> The procedure for determine cr </i>
<i>2.3.4.2</i>
<i>Finding c</i>r with100<i>, </i>0<i>, F(n), d</i>e and r<i> – t curve by A source code or program on Eq. </i>
(2.27).
<i> Evaluation of the method </i>
<i>2.3.4.3</i>
<b>Advantages </b>
- Use a coding program to resolve results independent of the implementer.
Therefore, the value has high accuracy.
- Results processing time is fast.
<b>Disadvantages </b>
- Matching between theoretical and experimental curve does not always occur
- The value depends on the data range.
<i>- Eq of (2.27) variable U</i>r needs to determine the exact values for 0 and 100.
<i><b>2.3.5 Log - log method [15] </b></i>
<i> Introduction </i>
<i>2.3.5.1</i>
The value of o<i> can be calculated by selecting two time – settlement in the range </i>
<i> U</i>r < 20% at experimental data(1<i>, t</i>1<b>) & (</b>2<i>, t</i>2).
2 2
1 1
<i>o</i>
<i>o</i>
<i>t</i>
<i>t</i>
<sub></sub>
<sub></sub>
(2.28)
Two straight lines depicted in Figure 2.9. The radial (horizontal) coefficient of
consolidation is determined in this case:
2
,66
66
(T )<i><sub>r</sub></i> <i><sub>e</sub></i>
<i>r</i>
<i>d</i>
<i>c</i>
<i>t</i>
(2.29)
<i> The procedure for determine cr </i>
<i>2.3.5.2</i>
- Step 1: Calculate the initial compression (0) using Eq. (2.28) from the time
– compression data by choosing two points in the early stages of
consolidation. The value of 0 can be calculated by selecting two time –
</div>
<span class='text_page_counter'>(33)</span><div class='page_container' data-page=33>
20
- Step 2: Plot the time t – corrected settlement ( – 0) in a log – log plot.
- Step 3: Identify the initial linear portion and draw line.
- Step 4: Identify the linear secondary compression portion by drawing a line
and extending it to intersect the initial straight line. The time at the point of
<i>intersection (t</i>66) corresponds to a degree of consolidation of 66%.
<i>- Step 5: c</i>r can be determined by Eq. (2.29)
Figure 2.9. Log( - 0<i>) versus log t plot [15] </i>
<i> Evaluation of the method </i>
<i>2.3.5.3</i>
<b>Advantages </b>
- This method can determine 0 & 66<b>. </b>
- Methods Inheriting advantages of graphical method.
<b>Disadvantages </b>
- From Experimental data the value of 0<i> within U</i>r < 20% is not constant
<i><b>2.3.6 Steepest tangent fitting method [16] </b></i>
<i> Introduction </i>
<i>2.3.6.1</i>
The method Inflection point in Section 2.3.3 has disadvantages, Inflection point is
difficult to determine exactly with experimental data. Vinod (2010) found a straight
line through an Inflection point [16].
The equation of tangent through Inflection point on the semi-log graph (Figure
2.10) is determined:
<i> = b - alog(t) </i>
</div>
<span class='text_page_counter'>(34)</span><div class='page_container' data-page=34>
21
<i>where a, b = constant and (t, </i>) value of experimental data.
One log cycle, the author chooses value (1<i>, t</i>1), (2<i>, t</i>2<i>) on the condition (t</i>1 = 10
<i>time), (t</i>2 = 100 time) & (1 - 2<i> = h). Substituting (</i>1<i>, t</i>1), (2<i>, t</i>2) into Eq. (2.30)
1 <i>= b – a & </i>2 <i>= b – 2a Thus </i>1 - 2<i> = a = h</i>
(2.31)
<i>Put a from Eq. (2.31). </i>
<i> = b - hlog(t)</i>
(2.32)
P(o<i>, t</i>o<i>) is the corrected initial experimental data (Figure 2.10). Put b with P(</i>o<i>, t</i>o)
from Eq. (2.32).
= [0<i> + hlog(t</i>0<i>)]- alog(t) = </i>0<i> + hlog(t</i>0 <i>/ t) </i>
(2.33)
<i>Figure 2.10. Steepest tangent fitting method for determination of c</i>r
<i>Similarly, a straight line through Inflection point on U</i>r<i>-log T</i>r<i> and d(U</i>r<i>) /dlog T</i>r as
<i>shown Figure 2.8. Function for tangent on U</i>r<i> - log T</i>r.
<i>U</i>r <i>= c - Slog(T</i>r)
(2.34)
<i>where c is constant and (T</i>r<i>, U</i>r) value of predicted curve.
<i>The value of S is defined by Section 2.3.3. </i>
r,inf
0.847
63.2%
(log )
<i>r</i>
<i>r</i>
<i>dU</i>
<i>S</i>
<i>U</i>
<i>d</i> <i>T</i>
<sub> </sub>(2.35)
Similarly, The corrected initial P(0<i>, t</i>0<i>, T</i>r,0<i>, U</i>r,0<i>) is given by U</i>r,0<i> = c - Slog(T</i>0)
<i>Substituting b with P(</i>0<i>, t</i>0<i>, T</i>r,0<i>, U</i>r,0)
<i>U</i>r<i> = [U</i>r,0<i> + Slog(T</i>r,0<i>)] - Slog(T</i>r<i>) = U</i>r,0<i> + Slog(T</i>r,0<i> / T</i>r)
</div>
<span class='text_page_counter'>(35)</span><div class='page_container' data-page=35>
22
<i>(U</i>r<i> - U</i>r,0<i>) / S = x / S = log(T</i>r,0<i> / T</i>r<i>) = log(t</i>0<i> / t)</i>
(2.37)
<i>Eq. (2.37) and put log(t</i>o<i> / t) from Eq. (2.33). Thus, function for steepest tangent is </i>
described as follows:
<i>x </i>= 0<i> + h x / S</i>
(2.38)
Author (Vinod, 2010) has determined the value of o as follows:
1 1
0 1 2
2 2
/ 1
<i>t</i> <i>t</i>
<i>t</i> <i>t</i>
<sub></sub><sub></sub> <sub> </sub><sub> </sub> <sub></sub><sub></sub>
(2.39)
<i> The procedure for determine cr </i>
<i>2.3.6.2</i>
- Step 1: Plot the dial reading against time on semi log graph as show in Figure
2.10.
- Step 2: Determine o in Eq. (2.39)
- Step 3: Draw a tangent PQ to the steepest part of the consolidation curve.
<i>- Step 4: Find h, which is the slope of the tangent PQ. </i>
- Step 5: Find x use Eq.(2.38)
<i>- Step 6: c</i>r is calculated using Eq. (2.35).
<i> Evaluation of the method </i>
<i>2.3.6.3</i>
<b>Advantages </b>
- This method finds the 0<b> values. </b>
<i>- Only conduct experiments to U</i>r = 60%.
- Overcoming method disadvantages Inflection point.
<b>Disadvantages </b>
- Experimental data the value of 0 is not constant.
<i><b>2.3.7 Log t method [17] </b></i>
<i> Introduction </i>
<i>2.3.7.1</i>
</div>
<span class='text_page_counter'>(36)</span><div class='page_container' data-page=36>
23
,t0
100 0
8
1 exp <i>Tr</i>
<i>F n</i>
<sub> </sub>
<sub></sub> <sub></sub> <sub></sub>
(2.40)
<i>Replace t time in t</i>1<i>, t</i>2<i> and 2t</i>1<i> = t</i>2
,1
1 0
1
100 0
8
1 exp <i>Tr</i> 1 exp <i><sub>A</sub></i>
<i>F n</i>
<sub> </sub> <sub> </sub>
<sub></sub> <sub></sub> <sub></sub>
(2.41)
,2
2 0
2
100 0
8
1 exp <i>Tr</i> 1 exp <i><sub>A</sub></i>
<i>F n</i>
<sub> </sub> <sub> </sub>
<sub></sub> <sub></sub> <sub></sub>
<i>Substituting A</i>1<i>, A</i>2 with Eq.(2.42)
1 0 100 11
100 0 100 0
exp <i>A</i> 1
<sub></sub> <sub></sub>
(2.42)
2 0 100 22
100 0 100 0
exp <i>A</i> 1
<sub></sub> <sub></sub>
Then
100 1
1
100 0
ln
<i>A</i>
<sub></sub>
(2.43)
100 2
2
100 0
ln
<i>A</i>
<sub></sub>
<i>Substituting A</i>1<i>,/A</i>2 with Eq.(2.43)
100 1
100 0
2
1 100 2
100 0
ln
2
ln
<i>A</i>
<i>A</i>
<sub></sub>
<sub></sub>
(2.44)
In Eq. (2.44)
2
100 1 100 2 100 2
100 0 100 0 100 0
ln 2ln ln
<sub></sub> <sub></sub> <sub></sub>
(2.45)
2
100 1 100 2
100 0 100 0
<sub></sub> <sub></sub>
Then
2
100 1 2 1
100 2
(2 )
<i>o</i>
<sub></sub> <sub></sub>
<sub></sub>
</div>
<span class='text_page_counter'>(37)</span><div class='page_container' data-page=37>
24
<i>T</i>r relationship fits approximately as a straight line within 0 < Ur<i> < 20%. </i>
The initial compression may be also determined graphically.
<i>If the data points are selected such that t</i>2<i> = 2t</i>1, then Eq. (2.28) can show that
2 – 1 = 1 – 0
(2.47)
The radial (horizontal) coefficient of consolidation is determined in this case:
2
50
50
(T )<i><sub>r</sub></i> <i><sub>e</sub></i>
<i>r</i>
<i>d</i>
<i>c</i>
<i>t</i>
(2.48)
<i> The procedure for determine cr </i>
<i>2.3.7.2</i>
<i>- Step 1: Plot the time (t) – settlement (</i><i>) in a log t – plot. </i>
- Step 2: Draw a tangent through the inflection point.
- Step 3: identify the asymptotic secondary compression portion, draw a line,
and extend it to intersect the tangent line. The point of intersection
corresponds to a degree of consolidation of 100 % (100).
- Step 4: The value of 0 can be obtained using Eq. (2.28) or graphically using
Eq.(2.46).
<i>- Step 5: c</i>r is calculated using Eq. (2.48).
<i> Evaluation of the method </i>
<i>2.3.7.3</i>
<b>Advantages </b>
- The value 0<b> can determine in this method. </b>
<i>- Only conduct experiments to U</i>r = 60%.
- Overcoming method disadvantages Inflection point.
<b>Disadvantages </b>
- Experimental data the value of 0 is not constant.
<i><b>2.3.8 Full – match method [10] </b></i>
This method is identical for both CD & PD. The method is mentioned in the section
(2.2.3)
</div>
<span class='text_page_counter'>(38)</span><div class='page_container' data-page=38>
25
2
8
<i>n e</i>
<i>r</i>
<i>F d</i>
<i>c</i>
(2.49)
<i><b>2.4 Summary of methods for determining cr </b></i>
<i>The author summarizes the methods for determining c</i>r as follows.
<i>Table 2.2. Existing methods for determining c</i>r from radial consolidation
Group No. Peripheral drain Central drain
Section-based
1 Root t method [6] Root t method [11]
2 Matching log (de
2
/t) and Ur method
[12]
One-
point
3 Log - log method [15]
4 Log t method [17]
5 Inflection point method [9] Inflection point method [13]
6 Steepest tangent fitting method [16]
Full-match
7 Full – match method [10] Full – match method [10]
8 Non graphical matching method [14]
<b>2.5 Linear regression analysis </b>
<i>Suppose that from some experiment of n observations, i.e. values of a dependent </i>
<i>variable y measured at specified values of an independent variable x, have been </i>
<i>collected. In other words, we have set data points (x</i>1<i>, y</i>1<i>), (x</i>2<i>, y</i>2<i>), (x</i>3<i>, y</i>3<i>),… , (x</i>n<i>, y</i>n)
<i>for i = 1, 2, .. n. The function for linear y = bx with in intercept = 0 through n point </i>
<i>can be determined. </i>
Slope of linear
1
2
1
<i>n</i>
<i>i i</i>
<i>i</i>
<i>n</i>
<i>i</i>
<i>i</i>
<i>y x</i>
<i>b</i>
<i>x</i>
</div>
<span class='text_page_counter'>(39)</span><div class='page_container' data-page=39>
26
Coefficient of determination
2
2 1
2
2 1
1
1
<i>n</i>
<i>i</i>
<i>i</i>
<i>n</i>
<i>i</i>
<i>n</i>
<i>i</i>
<i>i</i>
<i>i</i>
<i>e</i>
<i>R</i>
<i>y</i>
<i>y</i>
<i>n</i>
(2.51)
where
<i>t</i> <i>i</i> <i>i</i>
<i>e</i> <i>y</i> <i>bx</i>
(2.52)
<b>2.6 Log normal distribution method </b>
The bell shaped curve appearing in figure 3.6 is generated using the probability
density function [18].
2 2
( ) /2
1
( )
2
<i>x</i>
<i>f x</i> <i>e</i>
</div>
<span class='text_page_counter'>(40)</span><div class='page_container' data-page=40>
27
<b>CHAPTER 3. METHODOLOGY </b>
<b>3.1 Introduction </b>
The studies for this thesis belong to experimental research focusing on the
evaluation of radial (horizontal) coefficient of consolidation of soil. The general
methodology of the research shows in Figure 3.1. Literature review provides
<i>methods for determining c</i>r values for PD & CD cases and provides evaluation
methods to select the best methods.
The focus of the research is to evaluate and select the Best methods for determining
<i>the radial (horizontal) coefficient of consolidation and find correlations of c</i>r,CD &
<i>c</i>r,PD <i> as well as correlations between c</i>r,CD<i> (and c</i>r,PD<i>) and c</i>v.
Literature review Problem identification
Data collection and analyses
<i>Coefficient of consolidation (c</i>r<i>, c</i>v)
Correlations of
<i>c</i>r CD<i> & c</i>r PD
Conclusion
Find best methods
for <i>determining c</i>r
Figure 3.1. Flow chart of the study
<i>Correlations of c</i>r CD
</div>
<span class='text_page_counter'>(41)</span><div class='page_container' data-page=41>
28
<b>3.2 Data collection </b>
In this study, the author does not directly perform field and laboratory tests. In fact,
the author collected data of consolidation test with radial drainage, which have been
published in the literature. More remarkably, most of the data used for the thesis
were obtained from the laboratory test program of the supervisor. From this source,
consolidation test results from DVIZ, VSIP, and Kim Chung (KC) were used for the
analyses. Fig. 3.2 shows an example of raw data, settlement & time curve, obtained
from consolidation test with a peripheral drain (PD) [9].
Figure 3.2. Experimental data [9]
<b>3.3 Improvement for inflection point methods </b>
<i><b>3.3.1 Theoretical development </b></i>
The author has commented in Inflection point method as follows and substituting of
<i>Eq. (2.14) from T</i>r in Eq. (2.4).<sub> </sub>
In PD case
100 0
exp 32. 2 32. 2.ln 10
log( )
<i>r</i> <i>r</i>
<i>r</i> <i>e</i> <i>e</i>
<i>c t</i> <i>c t</i>
<i>d</i>
<i>d</i> <i>T</i> <i>d</i> <i>d</i>
<sub></sub> <sub></sub>
<sub></sub> <sub></sub> <sub> </sub><sub></sub> <sub></sub>
<i>(3.1) </i>
In CD case
100 0
8 8
exp . . .ln 10
log( )<i><sub>r</sub></i> ( ) <i>r</i> ( ) <i>r</i>
<i>d</i>
<i>T</i> <i>T</i>
<i>d</i> <i>T</i> <i>F n</i> <i>F n</i>
<sub></sub> <sub></sub>
<sub></sub> <sub></sub> <sub> </sub><sub></sub> <sub></sub>
</div>
<span class='text_page_counter'>(42)</span><div class='page_container' data-page=42>
29
<i><b>3.3.2 The procedure for this method </b></i>
A. Determine the value of <i> /logT</i>r from Experimental data
Constant values of o, ult<i>, the author can calculate the value of U</i>r corresponding to
<i>log (t) with Experimental data. </i>
100
<i>o</i>
<i>r</i>
<i>o</i>
<i>U</i>
<sub> </sub>(3.3)
<i>Find the average rate of change (Slope) of U</i>r <i>and log t. </i>
<sub></sub>
<sub></sub>
, 1 , , 1 , , 1 ,
1 1 , 1 ,
ope=
log log log log / log / T log
<i>r n</i> <i>r n</i> <i>r n</i> <i>r n</i> <i>r n</i> <i>r n</i>
<i>r</i> <i>r</i>
<i>n</i> <i>n</i> <i>n</i> <i>n</i> <i>r n</i> <i>r n</i> <i>r</i>
<i>Sl</i>
<i>t</i> <i>t</i> <i>t</i> <i>t</i> <i>t</i> <i>T</i> <i>T</i>
<sub> </sub>(3.4)
B. Determine the predict curve from theory
In PD, case uses Eq. (3.3) and CD case using Eq. (3.4).
C. Finding the predict curve from Experimental data
Using curve-fitting method: least squares method both the slope of test data and the
slope of curve prediction. The author finds the most optimal curve for the data
series.
<i>From the prediction cure equation, c</i>r can be determined.
<b>3.4 Analysis of Time – Compression curve </b>
</div>
<span class='text_page_counter'>(43)</span><div class='page_container' data-page=43>
30
<b>3.5 Procedure to select the best methods </b>
Figure 3.3. Flowchart of identifying the best methods
<i>As in section 3.4, the author has determined the coefficient c</i>r values from which the
<i>author can calculate the value of predicted settlement for each method as well as for </i>
each experiment.
<b>Input from each test </b>
<i>- Predicted Settlement - Measured settlement </i>
<b>Step 1: Each site </b>
<b>Combine data in each site </b>
<i>- Predicted Settlement - Measured settlement </i>
<b>Step 2: All data </b>
<b>Combine data in all data </b>
<i>- Predicted Settlement - Measured settlement </i>
<b>Step 3: Find correlation: </b>
- <b>p = a </b><b>m</b>
<i>- R2 square </i>
<b>Step 4: Find the best method </b>
<b>The conditions to find the optimal method: </b>
</div>
<span class='text_page_counter'>(44)</span><div class='page_container' data-page=44>
31
<i>The purpose of the methods the author is studying is to determine the coefficient c</i>r
<i>values. In practice, it is to find the forecast curve predicted settlement of measured </i>
<i>settlement. Therefore, the choice of the Best methods is to choose which method </i>
<i>yields the predicted settlement results closest to reality. </i>
Based on the data in the table, the author proposed using method ranking based on
optimal point‟s multi criteria decision-making method for the evaluation.
The author chooses the criteria:
<i>1. The method for finding the coefficient a nearest 1. </i>
<i>2. The method for finding the coefficient R2</i> nearest 1.
The author ranked the criteria in the same pressure with the rankings from 1 to 8. 1
point corresponds to the method with the best results in the selection criteria and the
score drops to 8 according to the results of the selection criteria.
The author summarizes all evaluation points for each method. The best method is
the method that gives the lowest total score.
<i><b>3.6 Procedure to determine ratios of cr PD /cr CD or cr /cv </b></i>
Figure 3.4. Flowchart of identifying the best methods
<b>Input from each test </b>
<i>- c</i>r PD <i> & c</i>r CD <i> or c</i>v
<b>Step 1: Each site </b>
<b>Combine data in each site </b>
<i>- c</i>r PD <i>& c</i>r CD <i> or c</i>v
<i>- </i>
<b>Step 2: All data </b>
<b>Combine data in all data </b>
<i>- c</i>r PD <i>& c</i>r CD <i> or c</i>v
<i>- </i>
</div>
<span class='text_page_counter'>(45)</span><div class='page_container' data-page=45>
32
<i>As in section 3.4, Author has determined the coefficient c</i>r values. Procedure to
<i>determine ratio of c</i>r PD<i>/c</i>r CD <i>or c</i>r <i>/c</i>v as shown in Figure 3.4.
<i>The author uses Log normal distribution method for ratio of c</i>r PD<i>/c</i>r CD <i>or c</i>r <i>/c</i>v to
eliminate values that cause interference to data and then find relationships in a
straight line:
<i>- For c</i>r PD <i>and c</i>r CD<i>. The correlations is c</i>r PD<i> = c</i>r CD
<i>- For c</i>r PD <i>and c</i>v<i>. The correlations is c</i>r PD<i> = c</i>v
</div>
<span class='text_page_counter'>(46)</span><div class='page_container' data-page=46>
33
<b>CHAPTER 4. TEST RESULTS & DISCUSSIONS </b>
<b>4.1 Introduction </b>
This chapter illustrates the results derived from laboratory tests. Section 4.2 briefly
describes the data used in the project. This chapter presents the results estimated
from the Experimental data by using different analytical methods and correlations
<i>of c</i>r CD<i> and c</i>r PD <i>as well as correlations between c</i>r CD<i> (and c</i>r PD)/cv.
<b>4.2 Summary of database </b>
<i><b>4.2.1 Data collected from the literature </b></i>
In the thesis, author has collected data from papers in the literature. Table 4.1 and
Table 4.2 summarize test data collected from the literature.
<i>Table 4.1. Summary of data from literature for the PD – ESL condition </i>
No Soil type Pressure
(kPa) Reference
PD-ESL 1 Brisbane dredged mud 230 Ganesalingam et al. (2013) (Fig. 4a)
PD-ESL 2 Brisbane dredged mud 60 Ganesalingam et al. (2013) (Fig. 6a)
PD-ESL 3 Brisbane dredged mud 120 Ganesalingam et al. (2013) (Fig. 6b)
PD-ESL 4 Brisbane dredged mud 235 Ganesalingam et al. (2013) (Fig. 6c)
PD-ESL 5 Brisbane dredged mud 470 Ganesalingam et al. (2013) (Fig. 6d)
PD-ESL 6 Townsville dredged mud 60 Ganesalingam et al. (2013) (Fig. 6a)
PD-ESL 7 Townsville dredged mud 120 Ganesalingam et al. (2013) (Fig. 6b)
PD-ESL 8 Townsville dredged mud 235 Ganesalingam et al. (2013) (Fig. 6c)
</div>
<span class='text_page_counter'>(47)</span><div class='page_container' data-page=47>
34
<i>Table 4.2. Summary of data from literature for the CD – ESL condition </i>
No Soil type Pressure
(kPa) Reference
CD-ESL 1 Black cotton soil 400 Sridharan et al. (1996) (Fig. 5)
CD-ESL 2 Black cotton soil 25 Robinson (1997) (Fig. 3)
CD-ESL 3 Black cotton soil 50 Robinson and Allam (1998) (Fig. 3)
CD-ESL 4 Kaolinite 50 Robinson (2009) (Fig. 9)
CD-ESL 5 Singapore marine clay 100 Robinson (2009) (Fig. 9)
CD-ESL 6 IIT Madras lake clay 50 Sridhar and Robinson (2011) (Fig. 7)
<i><b>4.2.2 Data collected from test sites in Vietnam </b></i>
<b>Location of the test sites </b>
In the thesis, author has collected data from test sites in Vietnam. Figure 4.1 and
Figure 4.2, Figure 4.3 presents the location of test sites..
Figure 4.1. Locations of test sites in Viet Nam (VSIP site, DVIZ site, Kim Chung site)
<b>Kim Chung site </b>
<b>VSIP site</b>
</div>
<span class='text_page_counter'>(48)</span><div class='page_container' data-page=48>
35
<b>Figure 4.2. Test location at Kim Chung site </b>
<b>Figure 4.3. Test location at VSIP site </b>
Figure 4.4. Test location at DVIZ site
</div>
<span class='text_page_counter'>(49)</span><div class='page_container' data-page=49>
36
<b>Geological profiles at the test site </b>
Figure 4.5 presents the geological conditions at DVIZ site. The site has 7 soil layers
and the ground water level is at 0.9 m below ground surface.
Figure 4.5. Soil profile at DVIZ
Figure 4.6. Soil profile at VSIP Figure 4.7. Soil profile at KC
0.0
5.0
10.0
15.0
20.0
25.0
30.0
35.0
40.0
45.0
50.0
55.0
60.0
Elastic silt, mixed with oganic
Sandy silt, clayed sand
Lean clay with sand
Poorly graded sand
Sandy lean clay
Lean clay, fat clay
= 16.6 KN/m3
e0 = 1.53,
Ip = 32.9%
Soil profile Description
Sand with silt
45.0
50.0
55.0
60.0
Back fill
Silty clay stone
Sandy Lean clay
Elastic silt with sand, very soft
= 16.40 KN/m3
e<sub>0</sub> = 1.50, I<sub>p</sub> = 14.1%
Fat clay, somewhere elastic silt,
mixed, fine gravee0 = 0.93,
= 18.60 KN/m3<sub>, I</sub>
p = 20%
Soil profile Description
0.0
5.0
10.0
15.0
20.0
25.0
30.0
35.0
40.0
Silty sandstone
Clay loam
= 18.1 KN/m3
e0 = 0.97
Ip = 21.4%
Description
Soil profile
0.0
5.0
10.0
15.0
20.0
25.0
30.0
35.0
40.0
45.0
50.0
55.0
60.0
Gravel, = 2.65 g/cm3
Back fill
</div>
<span class='text_page_counter'>(50)</span><div class='page_container' data-page=50>
37
Figure 4.6 presents the geological conditions at DVIZ site. The site has 5 soil layers
and the groundwater level is at 1.5 m below ground surface.
Figure 4.7 presents the geological conditions at KC site. The site has 5 soil layers
and the ground water level is at 15.80 m below ground surface.
<i><b>4.2.3 Summary of test data </b></i>
Besides data collected from the literature, test data from the supervisor were also
collected for analyses. Table 4.3 and Table 4.4 summarize test data obtained from
the supervisor.
<i>Table 4.3. Summary of tests done on intact samples </i>
<b>Source </b>
<b>VD </b> <b>CD </b> <b>PD </b>
<b>Samples Data curves Samples Data curves Samples Data curves </b>
Literature 0 0 0 0 0 0
DVIZ 19(17) 92(82) 10 47 17 82
VSIP 32 156 32 154 31 149
KC 5 25 5 25 5 25
<i>Table 4.4. Summary of tests done on remolded samples </i>
<b>Source </b>
<b>VD </b> <b>CD </b> <b>PD </b>
<b>Samples Data curves Samples Data curves Samples Data curves </b>
Literature 0 0 6 6 9 9
DVIZ 0 0 0 0 0 0
VSIP 0 0 3 15 3 15
</div>
<span class='text_page_counter'>(51)</span><div class='page_container' data-page=51>
38
<b>4.3 Evaluation and selection the best methods on intact samples </b>
<i><b>4.3.1 Graph results on intact samples </b></i>
Figure 4.8 presents typical correlations between measured settlement and predicted
settlement obtained from PD tests on intact samples (at 800 kPa) for 8 methods.
<i>(a) Root t method </i> <i>(b) Log d</i>e 2/t method
(c) Inflection point method (d) Non-graphical method
(g) Log - log method (h) Steepest tangent - method
</div>
<span class='text_page_counter'>(52)</span><div class='page_container' data-page=52>
39
<i>(i) Log t method </i> (k) Full-match method
Figure 4.8 (Cont.). Results from PD tests on intact samples (at 800 kPa) for 8 methods
Figure 4.9 presents typical correlations between measured settlement and predicted
settlement obtained from CD tests on intact samples (at 800 kPa) for 8 methods.
<i>(a) Root t method </i> <i>(b) Log d</i>e 2/t method
(c) Inflection point method (d) Non-graphical method
</div>
<span class='text_page_counter'>(53)</span><div class='page_container' data-page=53>
40
(g) Log - log method (h) Steepest tangent - method
<i>(i) Log t method </i> (k) Full-match method
Figure 4.9 (Cont.). Results from CD tests on intact samples (at 800 kPa) for 8 methods
<i><b>4.3.2 Summary of results on intact samples </b></i>
Table 4.5 presents correlations of measured settlement and predicted settlement
obtained from PD tests on intact samples.
Table 4.5. Summary of results from PD tests on intact samples
<b>Pressure </b>
<b>(kPa) </b> <b>Method </b> <i><b>a (y = ax) </b></i> <i><b>R - square </b></i> <b>No. of data point (n) </b>
PD 50
<i>Root t </i> 0.99 0.984 6493
<i>Log d</i>e2<i>/t </i> 0.93 0.753 6594
Inflection Point 1.13 0.552 6594
</div>
<span class='text_page_counter'>(54)</span><div class='page_container' data-page=54>
41
<b>Pressure </b>
<b>(kPa) </b> <b>Method </b> <i><b>a (y = ax) </b></i> <i><b>R - square </b></i>
<b>No. of data </b>
<b>point (n) </b>
Log-Log 0.90 0.879 4359
Steepest tangent 1.08 0.908 6393
<i>Log t </i> 1.03 0.985 3653
Full-match 0.98 0.983 3552
PD 100
<i>Root t </i> 0.99 0.990 7436
<i>Log d</i>e2<i>/t </i> 1.00 0.988 7593
Inflection Point 0.84 0.798 7593
Non-graphical 1.00 0.995 7593
Log-Log 0.92 0.901 5605
Steepest tangent 1.10 0.855 7593
<i>Log t </i> 1.01 0.990 4957
Full-match 0.98 0.987 5435
PD 200
<i>Root t </i> 0.98 0.991 10722
<i>Log d</i>e2<i>/t </i> 1.01 0.994 10722
Inflection Point 0.85 0.900 10722
Non-graphical 1.00 0.996 10722
Log-Log 0.88 0.926 8372
Steepest tangent 1.16 0.902 10722
<i>Log t </i> 1.03 0.992 6733
Full-match 0.95 0.975 6978
PD 400
<i>Root t </i> 0.95 0.994 12280
<i>Log d</i>e2<i>/t </i> 1.02 0.997 12699
Inflection Point 0.82 0.990 12699
Non-graphical 1.00 0.998 12699
Log-Log 0.87 0.986 8284
Steepest tangent 1.14 0.975 12699
<i>Log t </i> 1.04 0.997 8284
</div>
<span class='text_page_counter'>(55)</span><div class='page_container' data-page=55>
42
<b>Pressure </b>
<b>(kPa) </b> <b>Method </b> <i><b>a (y = ax) </b></i> <i><b>R - square </b></i>
<b>No. of data </b>
<b>point (n) </b>
PD 800
<i>Root t </i> 0.98 0.989 10124
<i>Log d</i>e2<i>/t </i> 1.01 0.985 10124
Inflection Point 0.87 0.795 10124
Non-graphical 1.00 0.988 10124
Log-Log 0.87 0.889 7906
Steepest tangent 1.08 0.629 10124
<i>Log t </i> 1.03 0.995 7906
Full-match 0.98 0.992 7906
Table 4.6 presents correlations of measured settlement and predicted settlement
obtained from CD tests on intact samples.
Table 4.6. Summary of results from CD tests on intact samples
<b>Pressure </b>
<b>(kPa) </b> <b>Method </b> <i><b>a (y = ax) </b></i> <i><b>R - square </b></i>
<b>No. of data </b>
<b>point (n) </b>
CD 50
<i>Root t </i> 0.97 0.968 4756
<i>Log d</i>e2<i>/t </i> 1.01 0.984 4890
Inflection Point 1.00 0.198 4890
Non-graphical 1.00 0.989 4890
Log-Log 0.92 0.897 3516
Steepest tangent 1.11 0.794 4653
<i>Log t </i> 1.03 0.984 3465
Full-match 0.97 0.985 3668
CD 100
<i>Root t </i> 0.98 0.987 4938
<i>Log d</i>e2<i>/t </i> 1.00 0.990 4938
Inflection Point 1.07 0.152 4938
Non-graphical 1.00 0.994 4938
Log-Log 0.90 0.881 3806
Steepest tangent 1.09 0.875 4861
<i>Log t </i> 1.02 0.989 3648
</div>
<span class='text_page_counter'>(56)</span><div class='page_container' data-page=56>
43
<b>Pressure </b>
<b>(kPa) </b> <b>Method </b> <i><b>a (y = ax) </b></i> <i><b>R - square </b></i>
<b>No. of data </b>
<b>point (n) </b>
CD 200
<i>Root t </i> 0.97 0.983 7479
<i>Log d</i>e2<i>/t </i> 1.01 0.992 7479
Inflection Point 0.90 0.637 7479
Non-graphical 1.00 0.995 7479
Log-Log 0.90 0.931 5702
Steepest tangent 1.14 0.899 7348
<i>Log t </i> 1.03 0.991 4905
Full-match 0.96 0.984 5696
CD 400
<i>Root t </i> 1.00 0.989 8578
<i>Log d</i>e2<i>/t </i> 1.01 0.992 8359
Inflection Point 0.88 0.788 8578
Non-graphical 1.00 0.996 8578
Log-Log 0.89 0.926 6591
Steepest tangent 1.13 0.873 8145
<i>Log t </i> 1.01 0.991 6591
Full-match 0.95 0.979 6591
CD 800
<i>Root t </i> 0.98 0.991 8321
<i>Log d</i>e2<i>/t </i> 1.01 0.992 8278
Inflection Point 0.90 0.959 8321
Non-graphical 1.00 0.997 8321
Log-Log 0.84 0.858 8278
Steepest tangent 1.07 0.842 8278
<i>Log t </i> 0.98 0.966 7994
</div>
<span class='text_page_counter'>(57)</span><div class='page_container' data-page=57>
44
Table 4.7 presents the rank of each criterion with each pressure obtained from PD
<i>tests on intact samples. </i>
Table 4.7. Rank of each criterion with each pressure from PD tests on intact
samples
<b>Pressure (kPa) </b> <b>Method </b> <b>Rank of a (y = ax) </b> <b>Rank of R - square </b>
PD 50
<i>Root t </i> 2 3
<i>Log d</i>e2<i>/t </i> 5 7
Inflection Point 8 8
Non-graphical 1 1
Log-Log 7 6
Steepest tangent 6 5
<i>Log t </i> 4 2
Full-match 3 4
PD 100
<i>Root t </i> 3 3
<i>Log d</i>e2<i>/t </i> 2 4
Inflection Point 8 8
Non-graphical 1 1
Log-Log 6 6
Steepest tangent 7 7
<i>Log t </i> 4 2
Full-match 5 5
PD 200
<i>Root t </i> 3 4
<i>Log d</i>e2<i>/t </i> 2 2
Inflection Point 7 8
Non-graphical 1 1
Log-Log 6 6
Steepest tangent 8 7
<i>Log t </i> 4 3
</div>
<span class='text_page_counter'>(58)</span><div class='page_container' data-page=58>
45
<b>Pressure (kPa) </b> <b>Method </b> <b>Rank of a (y = ax) </b> <b>Rank of R - square </b>
PD 400
Root t 5 5
<i>Log d</i>e2<i>/t </i> 2 2
Inflection Point 8 6
Non-graphical 1 1
Log-Log 6 7
Steepest tangent 7 8
Log t 4 3
Full-match 3 4
PD 800
<i>Root t </i> 4 3
<i>Log d</i>e2<i>/t </i> 2 5
Inflection Point 7 7
Non-graphical 1 4
Log-Log 8 6
Steepest tangent 6 8
<i>Log t </i> 5 1
Full-match 3 2
Table 4.8 presents the rank of each criterion with each pressure from CD tests on
intact samples.
Table 4.8. Rank of each criterion with each pressure for CD case on intact samples
<b>Pressure </b>
<b>(kPa) </b> <b>Method </b> <b>Rank of a (y = ax) </b> <b>Rank of R - square </b>
CD 50
<i>Root t </i> 6 5
<i>Log d</i>e2<i>/t </i> 3 3
Inflection Point 1 8
Non-graphical 2 1
Log-Log 7 6
Steepest tangent 8 7
<i>Log t </i> 5 4
</div>
<span class='text_page_counter'>(59)</span><div class='page_container' data-page=59>
46
<b>Pressure </b>
<b>(kPa) </b> <b>Method </b> <b>Rank of a (y = ax) </b> <b>Rank of R - square </b>
CD 100
<i>Root t </i> 4 4
<i>Log d</i>e2<i>/t </i> 2 2
Inflection Point 6 8
Non-graphical 1 1
Log-Log 8 6
Steepest tangent 7 7
<i>Log t </i> 3 3
Full-match 5 5
CD 200
<i>Root t </i> 3 5
<i>Log d</i>e2<i>/t </i> 2 2
Inflection Point 7 8
Non-graphical 1 1
Log-Log 6 6
Steepest tangent 8 7
<i>Log t </i> 4 3
Full-match 5 4
CD 400
<i>Root t </i> 1 4
<i>Log d</i>e2<i>/t </i> 4 2
Inflection Point 7 8
Non-graphical 2 1
Log-Log 6 6
Steepest tangent 8 7
<i>Log t </i> 3 3
Full-match 5 5
CD 800
<i>Root t </i> 3 3
<i>Log d</i>e2<i>/t </i> 2 2
Inflection Point 7 5
Non-graphical 1 1
Log-Log 8 7
Steepest tangent 5 8
<i>Log t </i> 4 4
</div>
<span class='text_page_counter'>(60)</span><div class='page_container' data-page=60>
47
<i><b>4.3.3 Summary of rank method on intact samples </b></i>
Table 4.9 presents the rank of each criterion with each method obtained from PD
tests on intact samples and shows the best methods.
Table 4.9. Summary of rank for each method from PD tests on intact samples
<b>Method </b> <b>Rank of a <sub>(y = ax) </sub></b> <b>Rank of R <sub>- square </sub></b> <b>Sum of index </b> <b>Rank </b>
<i>Root t </i> 17 18 35 4
<i>Log d</i>e2<i>/t </i> 13 20 33 3
Inflection Point 38 37 75 8
Non-graphical 5 8 13 1
Log-Log 33 31 64 6
Steepest tangent 34 35 69 7
<i>Log t </i> 21 11 32 2
Full-match 19 20 39 5
The authors obtain the summary of result from PD test on intact samples:
- Best method is Non – graphical method and the function of linear
p = m & R2 = 0.994 (4.1)
<i>- Rank as 2 is Log t method and the function of linear </i>
p = 1.03m & R2 = 0.992 (4.2)
<i>- Rank as 3 is log d</i>e2<i>/t method and the function of linear </i>
p = 1.00m & R2 = 0.938 (4.3)
<i>- Root t is ranked as 4 and the function of linear </i>
</div>
<span class='text_page_counter'>(61)</span><div class='page_container' data-page=61>
48
Table 4.10 presents the rank of each criterion with each method obtained from CD
tests on intact samples and shows the best methods.
Table 4.10. Summary of rank on each meth1od from CD tests on intact samples
<b>Method </b> <b><sub>a (y = ax) </sub>Rank of </b> <b><sub>R - square </sub>Rank of </b> <b>Sum of index </b> <b>Rank </b>
<i>Root t </i> 17 21 38 4
<i>Log d</i>e2<i>/t </i> 13 11 24 2
Inflection Point 28 37 65 6
Non-graphical 7 5 12 1
Log-Log 35 31 66 7
Steepest tangent 36 36 72 8
<i>Log t </i> 19 17 36 3
Full-match 25 22 47 5
The authors obtain the summary of result from CD test on intact samples:
- Best method is Non – graphical method and the function of linear
p = m & R2 = 0.994 (4.5)
<i>- Rank as 2 is log d</i>e2<i>/t method and the function of linear </i>
p = 1.01m & R2 = 0.990 (4.6)
<i>- Rank as 3 is log t method and the function of linear </i>
p = 1.01m & R2 = 0.984 (4.7)
<i>- Root t is ranked as 4 and the function of linear </i>
</div>
<span class='text_page_counter'>(62)</span><div class='page_container' data-page=62>
49
<b>4.4 Evaluation and selection the best methods on literature data </b>
<i><b>4.4.1 Graph results on literature data </b></i>
Figure 4.10 presents typical correlations between measured settlement and predicted
settlement obtained from PD tests on literature for 8 methods.
<i>(a) Root t method </i> <i>(b) Log d</i>e 2/t method
(c) Inflection point method (d) Non-graphical method
(g) Log - log method (h) Steepest tangent - method
</div>
<span class='text_page_counter'>(63)</span><div class='page_container' data-page=63>
50
<i>(i) Log t method </i> (k) Full-match method
Figure 4.10 (Cont.). Results from PD tests on literature for 8 methods
Figure 4.11 presents typical correlations between measured settlement and predicted
settlement obtained from CD tests on literature for 8 methods.
<i>(a) Root t method </i> <i>(b) Log d</i>e 2/t method
(c) Inflection point method (d) Non-graphical method
</div>
<span class='text_page_counter'>(64)</span><div class='page_container' data-page=64>
51
(g) Log - log method (h) Steepest tangent - method
<i>(i) Log t method </i> (k) Full-match method
Figure 4.11 (Cont.). Results from CD tests on literature for 8 methods
<i><b>4.4.2 Summary of results on literature data </b></i>
Table 4.11 presents correlations of measured settlement and predicted settlement
obtained from PD tests on literature for 8 methods.
Table 4.11. Summary of results from PD tests on literature for 8 methods<i>.</i>
<b>Method </b> <i><b>a (y = ax) </b></i> <b>R - square </b> <b>No. of data point (n) </b>
<i>Root t </i> 1.01 0.951 254
<i>Log d</i>e2<i>/t </i> 1.02 0.990 254
Inflection Point 0.83 0.977 254
Non-graphical 1.01 0.992 254
Log-Log 0.82 0.887 254
Steepest tangent 1.14 0.947 254
<i>Log t </i> 1.00 0.983 254
</div>
<span class='text_page_counter'>(65)</span><div class='page_container' data-page=65>
52
Table 4.12 presents correlations of measured settlement and predicted settlement
obtained from CD tests on literature for 8 methods.
Table 4.12. Summary of results from CD tests on literature for 8 methods.
<b>Method </b> <i><b>a (y = ax) </b></i> <b>R - square </b> <b>No. of data point (n) </b>
<i>Root t </i> 0.99 0.993 242
<i>Log d</i>e2<i>/t </i> 1.00 0.997 242
Inflection Point 0.96 0.995 242
Non-graphical 1.00 0.998 242
Log-Log 0.87 0.958 242
Steepest tangent 1.04 0.947 242
<i>Log t </i> 0.99 0.997 242
Full-match 0.99 0.998 242
<i><b>4.4.3 Summary of rank method on literature data </b></i>
Table 4.13 presents the rank of each criterion with each method obtained from PD
tests on literature and shows the best methods.
Table 4.13. Summary of rank on each method from PD tests on literature
<b>Method </b> <i><b>a (y = ax) </b></i> <b>R - square Sum of index </b> <b>Rank </b>
<i>Root t </i> 3 6 9 4
<i>Log d</i>e2<i>/t </i> 5 2 7 3
Inflection Point 7 4 11 6
Non-graphical 2 1 3 1
Log-Log 8 8 16 8
Steepest tangent 6 7 13 7
<i>Log t </i> 1 3 4 2
Full-match 4 5 9 4
</div>
<span class='text_page_counter'>(66)</span><div class='page_container' data-page=66>
53
p = 1.01m & R2 = 0.992 (4.9)
<i>- Rank as 2 is log t method and the function of linear </i>
p = 1.00m & R2 = 0.983 (4.10)
<i>- Rank as 3 is log d</i>e2<i>/t method and the function of linear </i>
p = 1.02m & R2 = 0.990 (4.11)
<i>- Root t is ranked as 4 and the function of linear </i>
p = 1.01m & R2 = 0.951 (4.12)
Table 4.14 presents the rank of each criterion with each method obtained from CD
tests on literature and shows the best methods.
Table 4.14. Summary of rank on each method from CD tests on literature
<b>Method </b> <i><b>a (y = ax) </b></i> <b>R - square Sum of index </b> <b>Rank </b>
<i>Root t </i> 3 6 9 5
<i>Log d</i>e2<i>/t </i> 1 4 5 2
Inflection Point 6 5 11 6
Non-graphical 2 1 3 1
Log-Log 8 7 15 7
Steepest tangent 7 8 15 7
<i>Log t </i> 5 3 8 4
Full-match 4 2 6 3
The authors obtain the summary of result from CD test on literature:
- Best method is Non – graphical method and the function of linear
p = 1.00m & R2 = 0.998 (4.13)
<i>- Rank as 2 is log d</i>e2<i>/t method and the function of linear </i>
p = 1.00m & R2 = 0.997 (4.14)
- Rank as 3 is full-match method and the function of linear
p = 0.99m & R2 = 0.998 (4.15)
<i>- Root t is ranked as 5 and the function of linear </i>
</div>
<span class='text_page_counter'>(67)</span><div class='page_container' data-page=67>
54
<b>4.5 Evaluation and selection the best methods on remolded samples </b>
<i><b>4.5.1 Graph results on remolded samples </b></i>
Figure 4.12 presents typical correlations between measured settlement and predicted
settlement obtained from PD tests on remolded samples for 8 methods.
<i>(a) Root t method </i> <i>(b) Log d</i>e 2/t method
(c) Inflection point method (d) Non-graphical method
(g) Log - log method (h) Steepest tangent - method
</div>
<span class='text_page_counter'>(68)</span><div class='page_container' data-page=68>
55
<i>(i) Log t method </i> (k) Full-match method
Figure 4.12. (Cont.). Results from PD tests on remolded samples for 8 methods
Figure 4.13 presents typical correlations between measured settlement and predicted
settlement obtained from CD tests on remolded samples for 8 methods.
<i>(a) Root t method </i> <i>(b) Log d</i>e 2/t method
(c) Inflection point method (d) Non-graphical method
</div>
<span class='text_page_counter'>(69)</span><div class='page_container' data-page=69>
56
(g) Log - log method (h) Steepest tangent - method
<i>(i) Log t method </i> (k) Full-match method
Figure 4.13 (Cont.). Results from CD tests on remolded samples for 8 methods
<i><b>4.5.2 Summary of results on remolded samples </b></i>
Table 4.15 presents correlations between measured settlement and predicted
settlement obtained from PD tests on remolded samples for 8 methods.
Table 4.15. Summary results from PD tests on remolded samples for 8 methods
<b>Pressure </b>
<b>(kPa) </b> <b>Method </b> <i><b>a (y = ax) R - square No. of data point (n) </b></i>
PD 50
<i>Root t </i> 1.00 0.987 498
<i>Log d</i>e2<i>/t </i> 1.00 0.982 498
Inflection Point 0.82 0.966 498
Non-graphical 1.00 0.994 497
Log-Log 0.92 0.953 75
Steepest tangent 1.07 0.964 469
<i>Log t </i> 0.99 0.991 75
</div>
<span class='text_page_counter'>(70)</span><div class='page_container' data-page=70>
57
<b>Pressure </b>
<b>(kPa) </b> <b>Method </b> <i><b>a (y = ax) R - square No. of data point (n) </b></i>
PD 100
<i>Root t </i> 1.00 0.982 454
<i>Log d</i>e2<i>/t </i> 1.02 0.992 454
Inflection Point 0.84 0.972 454
Non-graphical 1.00 0.993 454
Log-Log 0.87 0.936 113
Steepest tangent 1.02 0.982 375
<i>Log t </i> 1.01 0.983 113
Full-match 0.99 0.987 113
PD 200
<i>Root t </i> 1.00 0.991 524
<i>Log d</i>e2<i>/t </i> 1.03 0.988 524
Inflection Point 0.83 0.981 524
Non-graphical 1.00 0.996 524
Log-Log 0.78 0.871 385
Steepest tangent 1.10 0.957 524
<i>Log t </i> 1.01 0.996 385
Full-match 0.97 0.992 339
PD 400
<i>Root t </i> 1.00 0.989 394
<i>Log d</i>e2<i>/t </i> 1.03 0.990 394
Inflection Point 0.84 0.983 394
Non-graphical 1.00 0.996 394
Log-Log 0.87 0.920 296
Steepest tangent 1.11 0.933 394
<i>Log t </i> 1.00 0.994 296
Full-match 0.99 0.992 296
PD 800
<i>Root t </i> 0.97 0.975 206
<i>Log d</i>e2<i>/t </i> 1.04 0.984 206
Inflection Point 0.81 0.976 206
Non-graphical 1.02 0.989 206
Log-Log 0.77 0.894 206
Steepest tangent 1.07 0.973 206
<i>Log t </i> 1.02 0.993 206
</div>
<span class='text_page_counter'>(71)</span><div class='page_container' data-page=71>
58
Table 4.16 presents correlations between measured settlement and predicted
settlement obtained from CD tests on remolded sample for 8 methods.
Table 4.16. Summary of results from CD tests on remolded samples for 8 methods
<b>Pressure </b>
<b>(kPa) </b> <b>Method </b> <i><b>a (y = ax) R - square No. of data point (n) </b></i>
CD 50
<i>Root t </i> 1.00 0.983 321
<i>Log d</i>e2<i>/t </i> 1.08 0.984 321
Inflection Point 0.91 0.745 321
Non-graphical 1.01 0.992 321
Log-Log 0.95 0.976 245
Steepest tangent 1.04 0.946 321
<i>Log t </i> 1.01 0.994 245
Full-match 0.95 0.981 245
CD 100
<i>Root t </i> 1.00 0.985 277
<i>Log d</i>e2<i>/t </i> 1.04 0.990 277
Inflection Point 0.83 0.960 277
Non-graphical 1.01 0.994 277
Log-Log 0.88 0.884 260
Steepest tangent 1.02 0.980 260
<i>Log t </i> 1.01 0.992 260
Full-match 0.97 0.989 260
CD 200
<i>Root t </i> 0.97 0.989 397
<i>Log d</i>e2<i>/t </i> 0.95 0.977 397
Inflection Point 0.95 0.949 397
Non-graphical 1.00 0.996 397
Log-Log 0.82 0.914 397
Steepest tangent 1.10 0.972 253
<i>Log t </i> 0.90 0.959 397
</div>
<span class='text_page_counter'>(72)</span><div class='page_container' data-page=72>
59
<b>Pressure </b>
<b>(kPa) </b> <b>Method </b> <i><b>a (y = ax) R - square No. of data point (n) </b></i>
CD 400
<i>Root t </i> 1.00 0.992 270
<i>Log d</i>e2<i>/t </i> 1.04 0.984 270
Inflection Point <sub>0.85 </sub> <sub>0.974 </sub> <sub>307 </sub>
Non-graphical 1.00 0.996 307
Log-Log <sub>0.81 </sub> <sub>0.931 </sub> <sub>114 </sub>
Steepest tangent <sub>1.09 </sub> <sub>0.956 </sub> <sub>270 </sub>
<i>Log t </i> 0.99 0.995 195
Full-match <sub>0.98 </sub> <sub>0.995 </sub> <sub>195 </sub>
CD 800
<i>Root t </i> 0.98 0.975 148
<i>Log d</i>e2<i>/t </i> 1.05 0.992 148
Inflection Point <sub>0.90 </sub> <sub>0.917 </sub> <sub>148 </sub>
Non-graphical <sub>1.02 </sub> <sub>0.993 </sub> <sub>148 </sub>
Log-Log 0.78 0.878 148
Steepest tangent <sub>1.08 </sub> <sub>0.959 </sub> <sub>148 </sub>
<i>Log t </i> 1.01 0.993 148
Full-match 0.99 0.995 148
Table 4.17 presents the rank of each criterion with each method obtained from PD
tests on remolded sample and shows the best methods.
Table 4.17. Rank of each criterion with each pressure from PD tests on remolded
samples for 8 methods
<b>Pressure (kPa) </b> <b>Method </b> <b>Rank of a (y = ax) Rank of R - square </b>
PD 50
<i>Root t </i> 3 4
<i>Log d</i>e2<i>/t </i> 2 5
Inflection Point 8 6
Non-graphical 1 1
Log-Log 7 8
Steepest tangent 6 7
<i>Log t </i> 4 3
</div>
<span class='text_page_counter'>(73)</span><div class='page_container' data-page=73>
60
<b>Pressure (kPa) </b> <b>Method </b> <b>Rank of a (y = ax) Rank of R - square </b>
PD 100
<i>Root t </i> 2 6
<i>Log d</i>e2<i>/t </i> 5 2
Inflection Point 8 7
Non-graphical 1 1
Log-Log 7 8
Steepest tangent 6 5
<i>Log t </i> 3 4
Full-match 4 3
PD 200
<i>Root t </i> 2 4
<i>Log d</i>e2<i>/t </i> 5 5
Inflection Point 7 6
Non-graphical 1 2
Log-Log 8 8
Steepest tangent 6 7
<i>Log t </i> 3 1
Full-match 4 3
PD 400
<i>Root t </i> 1 5
<i>Log d</i>e2<i>/t </i> 5 4
Inflection Point 8 6
Non-graphical 3 1
Log-Log 7 8
Steepest tangent 6 7
<i>Log t </i> 2 2
Full-match 4 3
PD 800
<i>Root t </i> 4 6
<i>Log d</i>e2<i>/t </i> 5 4
Inflection Point 7 5
Non-graphical 3 3
Log-Log 8 8
Steepest tangent 6 7
<i>Log t </i> 2 2
</div>
<span class='text_page_counter'>(74)</span><div class='page_container' data-page=74>
61
Table 4.18 presents the rank of each criterion with each method obtained from CD
<i>tests on remolded samples and shows the best methods. </i>
Table 4.18. Rank of each criterion with each pressure from CD tests on remolded
samples for 8 methods
<b>Pressure (kPa) </b> <b>Method </b> <b>Rank of a (y = ax) Rank of R - square </b>
CD 50
<i>Root t </i> 1 4
<i>Log d</i>e2<i>/t </i> 7 3
Inflection Point 8 8
Non-graphical 2 2
Log-Log 6 6
Steepest tangent 4 7
<i>Log t </i> 3 1
Full-match 5 5
CD 100
<i>Root t </i> 1 5
<i>Log d</i>e2<i>/t </i> 6 3
Inflection Point 8 7
Non-graphical 3 1
Log-Log 7 8
Steepest tangent 4 6
<i>Log t </i> 2 2
Full-match 5 4
CD 200
<i>Root t </i> 2 2
<i>Log d</i>e2<i>/t </i> 4 4
Inflection Point 3 7
Non-graphical 1 1
Log-Log 8 8
Steepest tangent 7 5
<i>Log t </i> 6 6
</div>
<span class='text_page_counter'>(75)</span><div class='page_container' data-page=75>
62
<b>Pressure (kPa) </b> <b>Method </b> <b>Rank of a (y = ax) Rank of R - square </b>
CD 400
<i>Root t </i> 1 4
<i>Log d</i>e2<i>/t </i> 5 5
Inflection Point 7 6
Non-graphical 2 1
Log-Log 8 8
Steepest tangent 6 7
<i>Log t </i> 3 3
Full-match 4 2
CD 800
<i>Root t </i> 4 5
<i>Log d</i>e2<i>/t </i> 5 4
Inflection Point 7 7
Non-graphical 3 3
Log-Log 8 8
Steepest tangent 6 6
<i>Log t </i> 2 2
Full-match 1 1
<i><b>4.5.3 Summary of rank method on remolded samples </b></i>
Table 4.19 presents the rank of each criterion with each method obtained from the
PD case on remolded samples and shows the best methods in this case.
Table 4.19. Summary of rank each method from PD tests on remolded samples
<b>Method </b> <b>Rank of a <sub>(y = ax) </sub></b> <b>Rank of R - <sub>square </sub></b> <b>Sum of index </b> <b>Rank </b>
<i>Root t </i> 12 25 37 4
<i>Log d</i>e2<i>/t </i> 22 20 42 5
Inflection Point 38 30 68 7
Non-graphical 9 8 17 1
Log-Log 37 40 77 8
Steepest tangent 30 33 63 6
<i>Log t </i> 14 12 26 2
</div>
<span class='text_page_counter'>(76)</span><div class='page_container' data-page=76>
63
The authors obtain the summary of result from PD test on remolded samples:
- Best method is Non – graphical method and the function of linear
p = 1.00m & R2 = 0.994 (4.17)
<i>- Rank as 2 is log t method and the function of linear </i>
p = 1.01m & R2 = 0.991 (4.18)
- Rank as 3 is full match method and the function of linear
p = 0.99m & R2 = 0.991 (4.19)
<i>- Root t is ranked as 4 and the function of linear </i>
p = 1.00m & R2 = 0.985 (4.20)
Table 4.20 presents the rank of each criterion with each method obtained from the
CD case on remolded samples and shows the best methods in this case.
Table 4.20. Summary of rank each method from CD tests on remolded samples
<b>Method </b> <b>Rank of a <sub>(y = ax) </sub></b> <b>Rank of R - <sub>square </sub></b> <b>Sum of index </b> <b>Rank </b>
<i>Root t </i> 9 20 29 2
<i>Log d</i>e2<i>/t </i> 27 19 46 5
Inflection Point 33 35 68 7
Non-graphical 11 8 19 1
Log-Log 37 38 75 8
Steepest tangent 27 31 58 6
<i>Log t </i> 16 14 30 3
Full-match 20 15 35 4
The authors obtain the summary of result from CD test on remolded samples:
- Best method is Non – graphical method and the function of linear
p = 1.01m & R2 = 0.994 (4.21)
<i>- Rank as 2 is Root t method and the function of linear </i>
p = 0.99m & R2 = 0.985 (4.22)
<i>- Rank as 3 is log t method and the function of linear </i>
</div>
<span class='text_page_counter'>(77)</span><div class='page_container' data-page=77>
64
<i><b>4.6 Comparison of cr CD and cr PD on intact samples </b></i>
<i><b>4.6.1 Graph results on intact samples </b></i>
<i>Figure 4.14 and Figure 4.15 presents typical correlations of c</i>r CD<i> and c</i>r PD obtained
<i>from non-graphical method and root t method at all data on intact samples. </i>
<i>Figure 4.14. Comparison of cr CD and cr PD obtained from root t method at all data </i>
<i>Figure 4.15. Comparison of cr CD and cr PD </i>obtained from non-graphical method at all data
<i><b>4.6.2 Summary of results on intact samples </b></i>
<i>Table 4.21 presents correlations of c</i>r CD<i> and c</i>r PD obtained from intact samples for
<i>root t method and non-graphical method. </i>
</div>
<span class='text_page_counter'>(78)</span><div class='page_container' data-page=78>
65
Table 4.21. Summary of results from PD and CD tests on intact samples
Pressure
(kPa)
<i><b>c</b></i><b>r,Root PD /cr,Root CD </b> <i><b>c</b></i><b>r,NG PD /cr,NG CD </b>
<i><b>a (y = ax) </b></i> <b><sub>square </sub>R - </b> <b>No. of data <sub>point (n) </sub></b> <i><b>a (y = ax) </b></i> <b><sub>square </sub>R - </b> <b>No. of data <sub>point (n) </sub></b>
50 0.52 0.74 20 0.50 0.63 30
100 0.52 0.68 29 0.56 0.79 33
200 0.46 0.77 28 0.40 0.65 33
400 0.41 0.40 28 0.44 0.51 31
800 0.39 0.83 24 0.37 0.60 21
All data 0.47 0.80 110 0.47 0.81 125
Table 4.22. Summary of boundary for PD and CD case on intact samples
<b>Pressure </b>
<b>(kPa) </b>
<i><b>c</b></i><b>r,Root PD /cr,Root CD </b> <i><b>c</b></i><b>r,NG PD /cr,NG CD </b>
<b>Lower Upper </b> <b>Distribution <sub>area </sub></b> <b>Lower Upper </b> <b>Distribution <sub>area </sub></b>
50 0.24 0.74 80.00% 0.30 0.78 80.00%
100 0.28 0.70 80.00% 0.37 0.71 80.00%
200 0.18 0.63 80.00% 0.23 0.69 80.00%
400 0.17 0.67 80.00% 0.27 0.67 80.00%
800 0.26 0.53 80.00% 0.28 0.53 80.00%
All data 0.26 0.62 80.00% 0.32 0.64 80.00%
<i>The authors obtain the result in Table 4.21 and Table 4.22 for correlations of c</i>r PD
<i>and c</i>r PD<i> from intact samples for Root t method and Non-graphical method. </i>
<i>Average correlations of c</i>r CD<i>/c</i>r PD<i> and boundary of c</i>r CD<i>/c</i>r PD with 80% distribution
<i>area ratio of c</i>r CD<i>/c</i>r PD can be determined:
a. For Root method
<i>- c</i>r PD<i> = 0.47c</i>r CD & R2<i> is 0.80, c</i>r PD<i> = (0.26 – 0.62)c</i>r CD (4.24)
b. For Non-graphical method
</div>
<span class='text_page_counter'>(79)</span><div class='page_container' data-page=79>
66
<i><b>4.7 Comparison of cr CD and cr PD on remolded samples </b></i>
<i><b>4.7.1 Graph results on remolded samples </b></i>
<i>Figure 4.16 and figure 4.17 presents the comparison of c</i>r CD<i> and c</i>r PD obtained from
<i>non-graphical method and root t at all data on remolded samples. </i>
<i>Figure 4.16. Comparison of c</i> r,CD<i> and c</i>r,PD<i> obtained from root t method at all data </i>
<i>Figure 4.17. Comparison of c</i>r CD<i> and c</i>r PD obtained from non-graphical method at all data
<i><b>4.7.2 Summary of results from remolded samples </b></i>
<i>Table 4.23 presents correlations of c</i>r,CD<i> and c</i>r,PD obtained from intact samples for
<i>root t method and non-graphical method. </i>
</div>
<span class='text_page_counter'>(80)</span><div class='page_container' data-page=80>
67
Table 4.23. Summary of correlations for CD and PD case on remolded samples
<b>Pressure </b>
<b>(kPa) </b>
<i><b>c</b></i><b>r,Root PD /cr,Root CD </b> <i><b>c</b></i><b>r,NG PD /cr,NG CD </b>
<i><b>a </b></i>
<i><b>(y = ax) </b></i> <b>square R - </b> <b>No. of data point (n) </b> <i><b>(y = ax) </b><b>a </b></i> <b>square R - </b> <b>No. of data point (n) </b>
50 0.33 0.70 7 0.39 0.79 8
100 0.32 0.87 6 0.34 0.90 6
200 0.48 0.94 6 0.43 0.85 9
400 0.43 1.00 5 0.49 0.96 7
800 0.29 0.89 8 0.38 0.98 7
All data 0.33 0.87 36 0.41 0.87 38
Table 4.24. Summary of boundary for CD and PD case on remolded samples
<b>Pressure </b>
<b>(kPa) </b>
<i><b>c</b></i><b>r,Root PD / cr,Root CD </b> <i><b>c</b></i><b>r,NG PD / cr,NG CD </b>
<b>Lower Upper </b> <b>Distribution <sub>area </sub></b> <b>Lower Upper </b> <b>Distribution <sub>area </sub></b>
50 0.25 0.47 80.00% 0.33 0.57 80.00%
100 0.24 0.53 80.00% 0.34 0.51 80.00%
200 0.43 0.58 80.00% 0.19 1.15 80.00%
400 0.42 0.47 80.00% 0.42 0.60 80.00%
800 0.28 0.49 80.00% 0.33 0.48 80.00%
All data 0.30 0.56 80.00% 0.33 0.58 80.00%
<i>The authors obtain the result in Table 4.23 and Table 4.24 for correlations of c</i>r PD
<i>and c</i>r PD<i> from intact samples for Root t method and Non-graphical method. </i>
<i>Average correlations of c</i>r CD<i>/c</i>r PD<i> and boundary of c</i>r CD<i>/c</i>r PD with 80% distribution
<i>area ratio of c</i>r CD<i>/c</i>r PD can be determined:
a. For Root method
<i>- c</i>r PD<i> = 0.33c</i>r CD & R2<i> is 0.87, c</i>r PD<i> = (0.30 – 0.56)c</i>r CD (4.26)
b. For Non-graphical method
</div>
<span class='text_page_counter'>(81)</span><div class='page_container' data-page=81>
68
<i><b>4.8 Comparison of cv and cr PD on intact samples </b></i>
<i><b>4.8.1 Graph results on intact samples </b></i>
<i>Figure 4.18 and Figure 4.19 presents the comparison of c</i>r PD<i> and c</i>v obtained from
<i>non-graphical method and root t at all data on intact samples. </i>
<i>Figure 4.18. Comparison of c</i>v<i> and c</i>r,PD<i> obtained from root t method at all data </i>
<i>Figure 4.19. Comparison of c</i>v<i> and c</i>r,PD obtained from non-graphical method at all data
<i><b>4.8.2 Summary of results on intact samples </b></i>
<i>Table 4.25 presents correlations of c</i>v<i> and c</i>r PD obtained from intact samples for root
<i>t method and non-graphical method. </i>
<i>Table 4.26 presents boundary of c</i>v<i> and c</i>r PD<i> obtained from intact samples for root t </i>
</div>
<span class='text_page_counter'>(82)</span><div class='page_container' data-page=82>
69
Table 4.25. Summary of correlations for PD case on intact samples
<b>Pressure </b>
<b>(kPa) </b>
<i><b>c</b></i><b>r,Root PD /cv </b> <i><b>c</b></i><b>r,NG PD /cv </b>
<b>a </b>
<b>(y = ax) </b> <b>square R - </b> <b>No. of data point (n) </b> <b> (y = ax) a </b> <b>square R - </b>
<b>No. of </b>
<b>data </b>
<b>point (n) </b>
50 1.47 0.37 30 1.77 0.47 29
100 1.60 0.69 36 1.29 0.68 41
200 1.57 0.67 45 1.05 0.56 47
400 2.05 0.73 42 1.52 0.76 51
800 1.68 0.76 45 1.04 0.68 44
All data 1.59 0.78 173 1.31 0.71 188
Table 4.26. Summary of boundary for PD case on intact samples
<b>Pressure </b>
<b>(kPa) </b>
<i><b>c</b></i><b>r,Root PD /cv </b> <i><b>c</b></i><b>r,NG PD /cv </b>
<b>Lower Upper </b> <b>Distribution <sub>area </sub></b> <b>Lower Upper </b> <b>Distribution <sub>area </sub></b>
50 0.59 2.46 80.00% 1.04 2.65 80.00%
100 0.71 2.60 80.00% 0.77 2.25 80.00%
200 0.60 2.66 80.00% 0.54 2.02 80.00%
400 1.04 2.85 80.00% 0.77 3.05 80.00%
800 0.62 3.38 80.00% 0.74 2.23 80.00%
All data 0.90 2.33 80.00% 0.86 2.26 80.00%
<i>The authors obtain the result in Table 4.25 and Table 4.26 for correlations of c</i>v and
<i>c</i>r PD<i> from intact samples for Root t method and Non-graphical method. </i>
<i>Average correlations of c</i>r PD<i>/c</i>v <i>and boundary of c</i>r PD<i>/c</i>v with 80% distribution area
<i>ratio of c</i>r PD<i>/c</i>v can be determined:
a. For Root method
<i>- c</i>r PD<i> = 1.59c</i>v & R2<i> is 0.78, c</i>r PD<i> = (0.90 – 2.33) c</i>v (4.28)
b. For Non-graphical method
</div>
<span class='text_page_counter'>(83)</span><div class='page_container' data-page=83>
70
<i><b>4.9 Comparison of cv and cr CD on intact samples </b></i>
<i><b>4.9.1 Graph results on intact samples </b></i>
<i>Figure 4.20 and Figure 4.21 presents the comparison of c</i>v<i> and c</i>r CD obtained from
non-graphical method and root t method at all data on intact.
<i>Figure 4.20. Comparison of c</i>v<i> and cr CD, obtained from root t method at all data </i>
Figure 4.21. <i>Comparison of c</i>v<i> and c</i>r CD obtained from non-graphical method at all data
<i><b>4.9.2 Summary of results on intact samples </b></i>
<i>Table 4.27 and Table 4.28 presents the comparison of c</i>v<i> and c</i>r CD obtained from
</div>
<span class='text_page_counter'>(84)</span><div class='page_container' data-page=84>
71
Table 4.27. Summary of correlation for CD case on intact samples
<b>Pressure </b>
<b>(kPa) </b>
<i><b>c</b></i><b>r,Root CD /cv </b> <i><b>c</b></i><b>r,NG CD /cv </b>
<b>a </b>
<b>(y = ax) </b>
<b>R - </b>
<b>square </b>
<b>No. of </b>
<b>data </b>
<b>point (n) </b>
<b>a </b>
<b>(y = ax) </b>
<b>R - </b>
<b>square </b>
<b>No. of </b>
<b>data </b>
<b>point </b>
<b>(n) </b>
50 3.53 0.70 20 2.78 0.81 24
100 3.44 0.81 20 2.43 0.62 18
200 3.26 0.92 20 2.52 0.82 32
400 3.82 0.82 20 3.47 0.82 21
800 3.44 0.56 17 2.24 0.10 18
All data 3.38 0.76 115 2.41 0.63 140
Table 4.28. Summary of boundary for CD method on intact samples
<b>Pressure </b>
<b>(kPa) </b>
<i><b>c</b></i><b>r,Root CD /cv </b> <i><b>c</b></i><b>r,NG CD /cv </b>
<b>Lower Upper </b> <b>Distribution <sub>area </sub></b> <b>Lower Upper </b> <b>Distribution <sub>area </sub></b>
50 2.34 4.88 80.00% 2.02 3.71 80.00%
100 2.47 4.16 80.00% 1.99 3.17 80.00%
200 2.20 4.29 80.00% 1.33 3.58 80.00%
400 1.89 7.97 80.00% 2.95 5.15 80.00%
800 2.24 5.73 80.00% 2.15 5.10 80.00%
All data 2.14 5.12 80.00% 1.52 4.29 80.00%
<i>The authors obtain the result in Table 4.27 and Table 4.28 for correlations of c</i>v and
<i>c</i>r CD<i> from intact samples for Root t method and Non-graphical method. </i>
<i>Average correlations of c</i>r CD<i>/c</i>v <i>and boundary of c</i>r CD<i>/c</i>v with 80% distribution area
<i>ratio of c</i>r CD<i>/c</i>v can be determined:
a. For Root method
<i>- c</i>r CD<i> = 3.38c</i>v & R2<i> is 0.76, c</i>r CD<i> = (2.14 – 5.12) c</i>v (4.30)
b. For Non-graphical method
</div>
<span class='text_page_counter'>(85)</span><div class='page_container' data-page=85>
72
<i><b>4.10 Comparison of cv and cr PD on remolded samples </b></i>
<i><b>4.10.1 Graph of results on remolded samples </b></i>
<i>Figure 4.22 and Figure 4.23 presents the comparison of c</i>v<i> and c</i>r,PD obtained from
<i>non-graphical method and root t method at all data. </i>
<i>Figure 4.22. Comparison of c</i>v<i> and c</i>r,PD<i> obtained from root t method at all data </i>
<i>Figure 4.23. Comparison of c</i>v<i> and c</i>r,PD obtained from non-graphical method at all data
<i><b>4.10.2 Summary of results on remolded samples </b></i>
<i>Table 4.29 and Table 4.30 presents the comparison of c</i>v<i> and c</i>r,PD obtained from
</div>
<span class='text_page_counter'>(86)</span><div class='page_container' data-page=86>
73
Table 4.29. Summary of correlations for PD case on remolded samples
<b>Pressure </b>
<b>(kPa) </b>
<i><b>c</b></i><b>r,Root PD /cv </b> <b>cr,NG PD /cv </b>
<i><b>a </b></i>
<i><b>(y = ax) </b></i> <b>square R - </b> <b>No. of data point (n) </b> <i><b>(y = ax) </b><b>a </b></i> <b>square R - </b>
<b>No. of </b>
<b>data </b>
<b>point (n) </b>
50 0.50 -0.43 3 0.56 0.12 3
100 0.67 0.97 4 0.64 0.69 5
200 0.47 0.56 5 0.45 0.44 5
400 0.77 0.83 6 0.70 0.85 5
800 0.41 0.80 4 0.31 0.80 4
All data 0.46 0.71 24 0.58 0.79 20
Table 4.30. Summary of boundary for PD case on remolded samples
<b>Pressure </b>
<b>(kPa) </b>
<i><b>c</b></i><b>r,Root PD /cv </b> <b>cr,NG PD /cv </b>
<b>Lower Upper </b> <b>Distribution <sub>area </sub></b> <b>Lower Upper </b> <b>Distribution <sub>area </sub></b>
50 0.36 0.89 80.00% 0.44 0.87 80.00%
100 0.60 0.94 80.00% 0.40 1.27 80.00%
200 0.27 1.08 80.00% 0.21 1.21 80.00%
400 0.45 1.30 80.00% 0.56 1.00 80.00%
800 0.36 0.66 80.00% 0.26 0.48 80.00%
All data 0.35 1.01 80.00% 0.41 1.09 80.00%
<i>The authors obtain the result in Table 4.29 and Table 4.30 for correlations of c</i>v and
<i>c</i>r PD<i> from remolded samples for Root t method and Non-graphical method. </i>
<i>Average correlations of c</i>r PD<i>/c</i>v <i>and boundary of c</i>r PD<i>/c</i>v with 80% distribution area
<i>ratio of c</i>r PD<i>/c</i>v can be determined:
a. For Root method
<i>- c</i>r PD<i> = 0.46c</i>v & R2<i> is 0.71, c</i>r PD<i> = (0.35 – 1.01) c</i>v (4.32)
b. For Non-graphical method
</div>
<span class='text_page_counter'>(87)</span><div class='page_container' data-page=87>
74
<i><b>4.11 Comparison of cv and cr CD on remolded samples </b></i>
<i><b>4.11.1 Graph results on remolded samples </b></i>
<i>Figure 4.24 and 4.25 presents the comparison of c</i>v<i> and c</i>r CD obtained from
non-graphical method and root t method at all data.
<i>Figure 4.24. Comparison of c</i>v<i> and c</i>r,CD<i> obtained from root t method at all data </i>
<i>Figure 4.25. Comparison of c</i>v<i> and c</i>r,CD<i> obtained from Root t method at all data </i>
<i><b>4.11.2 Summary of results on remolded samples </b></i>
<i>Table 4.31 and table 4.32 presents the comparison of c</i>v<i> and c</i>r,PD obtained from
</div>
<span class='text_page_counter'>(88)</span><div class='page_container' data-page=88>
75
Table 4.31. Summary of correlations for CD method on remolded samples
<b>Pressure (kPa) </b>
<i><b>c</b></i><b>r,Root CD / cv </b> <b>cr,NG CD / cv </b>
<b>a (y = ax) </b> <b>R - </b>
<b>square </b>
<b>No. of </b>
<b>data point </b>
<b>(n) </b>
<b>a </b>
<b>(y = ax) </b>
<b>R - </b>
<b>square </b>
<b>No. of </b>
<b>data </b>
<b>point </b>
<b>(n) </b>
50 0.50 0.72 3 0.78 0.49 5
100 0.88 0.67 5 0.94 0.67 5
200 0.44 0.63 4 0.36 0.67 4
400 0.66 0.65 3 0.54 0.46 4
800 0.58 0.60 4 0.55 0.77 4
All data 0.53 0.61 15 0.55 0.79 16
Table 4.32. Summary of boundary for CD method on remolded samples
<b>Pressure </b>
<b>(kPa) </b>
<i><b>c</b></i><b>r,Root CD / cv </b> <b>cr,NG CD / cv </b>
<b>Lower Upper </b> <b>Distribution <sub>area </sub></b> <b>Lower Upper </b> <b>Distribution <sub>area </sub></b>
50 0.42 1.12 80.00% 0.35 2.96 80.00%
100 0.72 1.84 80.00% 0.57 1.82 80.00%
200 0.34 0.61 80.00% 0.27 0.47 80.00%
400 0.39 1.23 80.00% 0.36 1.14 80.00%
800 0.39 0.95 80.00% 0.39 0.78 80.00%
All data 0.36 0.82 80.00% 0.41 0.82 80.00%
<i>The authors obtain the result in Table 4.31 and Table 4.32 for correlations of c</i>v and
<i>c</i>r CD<i> from remolded samples for Root t method and Non-graphical method. </i>
<i>Average correlations of c</i>r CD<i>/c</i>v <i>and boundary of c</i>r CD<i>/c</i>v with 80% distribution area
<i>ratio of c</i>r CD<i>/c</i>v can be determined:
a. For Root method
<i>- c</i>r CD<i> = 0.53c</i>v & R2<i> is 0.61, c</i>r CD<i> = (0.36 – 0.82)c</i>v (4.34)
b. For Non-graphical method
</div>
<span class='text_page_counter'>(89)</span><div class='page_container' data-page=89>
76
<b>CHAPTER 5. CONCLUSIONS & RECOMMENDATIONS </b>
The following are key conclusions drawn from this study.
<b>1. The most reliable methods for determining the horizontal coefficient of </b>
<i><b>consolidation (cr): </b></i>
<i>- Best method is Non-graphical method for determining c</i>r for all case and the
function of linear
p = 1.0m & R2 = 0.99 (5.1)
<i>This is the best method because this method determines c</i>r is by matching to find
the best curve for the data series
<i>- Rank as 2 or 3 is usually log d</i>e2<i>/t or log t. </i>
- These two methods are matching methods, so it gives good results.
- Root method is usually rank as 4 and the function of linear
p = (0.98 - 1.00)m & R2 = (0.95 – 0.99) (5.2)
- Result of p<i> from root t method is almost equal to </i>m in the both test (CD and
PD) tests on the both samples (intact and remolded). Therefore, Root t method
<i>may become the standard for determining c</i>r values as it is the standard method
<i>for determining c</i>v values.
<i>- The root method is matching data within U</i>r<i> = 20% to U</i>r = 60% but it is usually
ranked 4 because the most appropriate method with measured curves is similar
to predicted curve. Especially actual samples with sand or mixed impurities such
as seashells, small rocks ... make measured settlement curve different from the
theory.
- Full-match method also uses the principle of matching but does not rank well
because determining two straight lines on the logarithmic coordinate system is
often difficult.
- The remaining methods also do not have high rankings because the value of 0
<i>varies greatly in the range U</i>r<i> = 20%. Range U</i>r = 20% is the initial compression.
</div>
<span class='text_page_counter'>(90)</span><div class='page_container' data-page=90>
77
pockets in pore spaces and partly due to the rearrangement of particles in the
soil, and a small percentage may be due to elastic compression due to the value
of 0 varies greatly in this range
- Determining 0 from steepest tangent method is incorrect. It is only true in the
vertical consolidation.
<i><b>2. Correlations between cr values obtained from central drain (CD) test and </b></i>
<b>peripheral drain (PD) test. </b>
Due to differences in drainage boundary, so
, ,
, , , ,
w w
<i>r PD</i> <i>r CD</i>
<i>r PD</i> <i>r CD</i> <i>r PD</i> <i>r CD</i>
<i>r</i> <i>r</i>
<i>k</i> <i>k</i>
<i>k</i> <i>k</i> <i>c</i> <i>c</i>
<i>m</i> <i>m</i>
(5.3)
<i>Where: k</i>r PD<i> (k</i>r CD<i>) is the permeability coefficient from PD case (CD case),</i>
w<i> is </i><i>water unit weight and mr</i> is soil stiffness from radial consolidation.
<i>Correlations of c</i>r PD<i>/ c</i>r CD changes difference by level of pressure loading:
a. On intact samples
For Root method
<i>c</i>r PD<i> = 0.47c</i>r CD & R2<i> is 0.80, c</i>r PD<i> = (0.26 – 0.62)c</i>r CD (5.4)
For Non-graphical method
<i>c</i>r PD<i> = 0.47c</i>r CD & R2<i> is 0.81, c</i>r PD<i> = (0.32 – 0.64)c</i>r CD (5.5)
b. On remolded samples
For Root method
<i>c</i>r PD<i> = 0.33c</i>r CD & R2<i> is 0.87, c</i>r PD<i> = (0.30 – 0.56)c</i>r CD (5.6)
For Non-graphical method
<i>c</i>r PD<i> = 0.41c</i>r CD & R2<i> is 0.87, c</i>r PD<i> = (0.33 – 0.58)c</i>r CD (5.7)
<i><b>3. Correlations between cr and vertical coefficients of consolidation (cv) </b></i>
Due to differences in drainage boundary, so
w w
<i>v</i>
<i>r</i>
<i>r</i> <i>v</i> <i>r</i> <i>v</i>
<i>r</i> <i>v</i>
<i>k</i>
<i>k</i>
<i>k</i> <i>k</i> <i>c</i> <i>c</i>
<i>m</i> <i>m</i>
</div>
<span class='text_page_counter'>(91)</span><div class='page_container' data-page=91>
78
<i>Where: k</i>r<i> (k</i>v<i>) is the permeability coefficient from radial consolidation (vertical </i>
consolidation), w<i> is water unit weight and m</i>r<i> (m</i>v<i>) is soil stiffness from radial </i>
consolidation (vertical consolidation)
<i> Correlations of c</i>r PD<i>/c</i>v<i> and c</i>r CD<i>/c</i>v changes difference by level of pressure loading:
a. On intact samples
For Root method
<i>- c</i>r PD<i> = 1.59c</i>v & R2<i> is 0.78, c</i>r PD<i> = (0.90 – 2.33) c</i>v (5.9)
<i>- c</i>r CD<i> = 3.38c</i>v & R2<i> is 0.76, c</i>r CD<i> = (2.14 – 5.12) c</i>v (5.10)
For Non-graphical method
<i>- c</i>r PD<i> = 1.31c</i>v & R2<i> is 0.71, c</i>r PD<i> = (0.86 – 2.26) c</i>v (5.11)
<i>- c</i>r CD<i> = 2.41c</i>v & R2<i> is 0.63, c</i>r CD<i> = (1.52 – 4.29) c</i>v (5.12)
b. On remolded samples
For Root method
<i>- c</i>r PD<i> = 0.46c</i>v & R2<i> is 0.71, c</i>r PD<i> = (0.35 – 1.01) c</i>v (5.13)
<i>- c</i>r CD<i> = 0.53c</i>v & R2<i> is 0.61, c</i>r CD<i> = (0.36 – 0.82)c</i>v (5.14)
For Non-graphical method
<i>- c</i>r PD<i> = 0.58c</i>v & R2<i> is 0.79, c</i>r PD<i> = (0.41 – 1.09) c</i>v (5.15)
<i>- c</i>r CD<i> = 0.55c</i>v & R2<i> is 0.79, c</i>r CD<i> = (0.41 – 0.82)c</i>v (5.16)
The limitation of the study is that the amount of data is still limited due to the
urgent time, so it has not been able to perform many samples a and there is no
permeability test to verify the ratio in theory.
</div>
<span class='text_page_counter'>(92)</span><div class='page_container' data-page=92>
79
<b>REFERENCES </b>
[1]. ASTM D2435 / D2435M – 11. ASTM International, West Conshohocken.
(2011). Standard Test Methods for One-Dimensional Consolidation Properties
of Soils Using Incremental Loading.
[2]. Terzaghi. K (1943). Theoretical soil mechanic. NewYork, Wiley.
1943
[3]. Das B. M., & Sobhan, K Principle of Geotechnical Engineering. Global
Engineering, 2008.
[4]. Barron, R.A. (1948). Consolidation of fine-grained soil by drain wells," Trans,
ASCE, Vol. 113, pp.718-742.
[5]. Hung L V. (2019). Determination of the horizontal (radial) coefficient of
consolidation by oedometer test with horizontal drainage using incremental
loading method, Master thesis.
[6]. Head K.H. (1986). Manual of soil laboratory testing. Pentech Press, London,
1986. - Vol. Volume 3: Effective stress tests.
[7]. Silverira Icarahy Da. (1951). Consolidation of a Cylindrical Clay Sample with
External Radial Flow of Water.
[8]. Scott R.F. (1963). Principles of Soil Mechanics on Chapter 5.
[9]. Ganesalingam D. Sivakugan, N. and Read, W. (2013). Inflection point method
to estimate ch from radial consolidation tests with peripheral drain. Geotechnical
Testing Journal, ASTM, 36(5):1-6., 2013.
[10]. Chung S.G Park T.R, Hwang D.Y, and Kweon H.J. (2019). Full-Match
Method to Determine the Coefficient of Radial consolidation: Geotechnical
Testing Journal 42, no. 5, 2019.
[11]. Berry P.L. and Wilkinson, W.B. (1969). The radial consolidation of clay soils
[Conference]: Geotechnique, 1969. - Vols. 19(2): 253-284.
[12]. Sridharan A., Prakash, K. and Asha, S.R. (1996). Consolidation behavior of
clayey soils under radial drainage [Journal]: Geotechnical Testing Journal,
1996. Vols. ASTM, 19(4):421-431.
[13]. Robinson R.G. (1997). Determination of radial coefficient of consolidation
by the inflection point method [Journal]: Geotechnique, 1997. - Vols. 47(5):
1079-1081.
</div>
<span class='text_page_counter'>(93)</span><div class='page_container' data-page=93>
80
[15]. Robinson R.G. (2009). Analysis of radial consolidation test data using a
log-log method [Journal]: Geotechnical Testing Journal, 2009 - Vols. ASTM,
32(2):1-7.
[16]. Vinod J.S., Sridharan, A., Indraratna, B. (2010). Determination of coefficient
of radial consolidation using steepest tangent fitting method [Journal]:
Geotechnical and Geological Engineering, 2010. Vols. 28(4):533-536.
[17]. Sridhar G. and Robinson, R.G. (2011). Determination of radial coefficient of
consolidation using log t method [Journal]: International Journal of Geotechnical
Engineering, 2011. Vols. 5(4):373-381.
</div>
<!--links-->
A STUDY ON THE STRUCTURAL FEATUES OF ENGLISH NEWS STORY.DOC
- 62
- 1
- 5


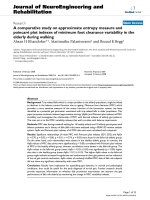
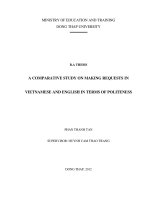
.push({});</script> </div> </div> </div> <div class="vf_link_relate px-2 my-2"> <h2 class="vf_doc_relate text-2xl font-bold my-4">Tài liệu liên quan</h2> <ul class="grid grid-cols-12 gap-2"> <li class="col-span-6 md:col-span-2"> <div class="card-doc " onclick="actionDocRelated(this)"> <a class="card-doc-img" href="https://text.123docz.net/document/12058-a-study-on-the-structural-featues-of-english-news-story-doc.htm" title="A STUDY ON THE STRUCTURAL FEATUES OF ENGLISH NEWS STORY.DOC"> <i class="icon i_type_doc i_type_doc1"></i> <img class="lazy" src="data:image/gif;base64,R0lGODlhAQABAIAAAP///wAAACH5BAEAAAAALAAAAAABAAEAAAICRAEAOw==" data-src="https://media.store123doc.com/images/document/12/pt/zq/medium_NyYsk0n2xU.jpg" width="124" height="179" alt="A STUDY ON THE STRUCTURAL FEATUES OF ENGLISH NEWS STORY.DOC" onerror="this.src=)