SERVICE QUALITY, PRICE, CUSTOMER SATISFACTION AND CUSTOMER LOYALTY: A STUDY OF CONVENIENCE STORES IN HO CHI MINH CITY
Bạn đang xem bản rút gọn của tài liệu. Xem và tải ngay bản đầy đủ của tài liệu tại đây (316.67 KB, 11 trang )
<span class='text_page_counter'>(1)</span><div class='page_container' data-page=1>
<b>SERVICE QUALITY, PRICE, CUSTOMER SATISFACTION AND </b>
<b>CUSTOMER LOYALTY: A STUDY OF CONVENIENCE STORES IN HO </b>
<b>CHI MINH CITY </b>
DAM TRI CUONG, NGUYEN THANH LONG
<i>Business Administration Faculty, Industrial University of Ho Chi Minh City, Vietnam; </i>
,
<b>Abstract. This study aims to examine the relationship between the service quality, price, customer </b>
satisfaction and customer loyalty for the convenience stores in Ho Chi Minh City. These relationships
were tested with a sample of 358 customers at convenience stores in Ho Chi Minh City. By using the
partial least squared structural equation modeling (PLS-SEM) with SmartPLS software for data analysis.
The finding showed that service quality has a significant positive effect on both of customer satisfaction
and customer loyalty. The finding of this paper also showed that price has a significant positive effect on
both of customer satisfaction and customer loyalty. The finding also showed that customer satisfaction
has a significant positive effect on customer loyalty. From the above results, the study offers implications
for managers and directions for future research.
<i><b>Keywords. customer loyalty, customer satisfaction, convenience store, price, service quality </b></i>
<b>1 </b>
<b>INTRODUCTION </b>
Convenience stores in Vietnam are growing in recent years. The number of convenience stores in
Vietnam has increased nearly 4 times since 2012. Ho Chi Minh City in particular, if there are 324 stores
at the end of 2014, but in March 2018 they have increased to 1144 stores, increasing 3.5 times and the
whole country in general has about 1600 convenience stores [1]. This number will continue to increase in
the next few years. This convenient store model is witnessing fierce competition of big companies who
have been in the market for a long time like Vinmart+, Circle K, Shop & Go, Ministop, B's Mart, Family
Mart and new giants set foot in Vietnam in the last 18 months like 7-Eleven, GS 25 [2]. In today's
competitive and dynamic retail environment, providing high quality services are considered a basic retail
strategy to create competitive advantage [3], [4]. Moreover, to maintain customers, businesses should
provide good services at the time of sale or at after-sales service. Good service quality will satisfy
customers and lead to customer loyalty. Customer loyalty is considered the key to organizational success
and profitability [3], [5]. Besides, price is very important aspect for customers and customers will use
price as one of the standard level of their satisfaction [6]. Therefore, in order to succeed and survive in a
competitive market, as well as to satisfy customers and maintain customer loyalty, store managers should
design service quality and price better than competitors.
Some previous researches were studied the service quality, price, customer satisfaction and customer
loyalty in the service environment in general [6], [7]. However, very little research has analyzed the
relationship between service quality, price, customer satisfaction and customer loyalty in the convenience
store context. Therefore, the aim of the study is to consider the relationship between service quality, price,
customer satisfaction and loyalty for the convenience stores in Ho Chi Minh City.
<b>2 </b>
<b>LITERATURE REVIEW </b>
<b>2.1 Service quality </b>
</div>
<span class='text_page_counter'>(2)</span><div class='page_container' data-page=2>
different service sectors (eg bank, credit card, long distance telephone, repair and maintenance).
SERQUAL scales achieve reliability and validity for the above industries and can apply this scale to other
service sectors However, many researchers have questioned about the conceptual framework and
measurement method of this model. For example, Cronin and Taylor [10] pointed out that using service
quality performance (SERVPERF, i.e. the perceived service in SERVQUAL) to measure service quality
produces better results of reliability, validity, and predictive power than using SERVQUAL. Some other
scholars [11], [12] also showed that SERVPERF is more accurate than SERVQUAL in the measurement
of service quality, and SERVPERF can provide better diagnostic information [7].
<b>2.2 Retail service quality </b>
Dabholkar et al. [13] developed a retail service quality scale to measure service quality in a retail
environment. They proposed that the retail service quality scale has a hierarchical factor structure
comprising five basic dimensions:
(1) Physical aspects
(2) Reliability
(3) Personal interaction
(4) Problem solving
(5) Policy
Dabholkar et al. [13] claimed that the retail service quality scale can apply to retail stores, which
includes products and services. Moreover, some scholars used the retail service quality scale to measure
service quality in retail environment such as Beneke et al. [14], Yu and Ramanathan [4], Veloso et al.
[15]. Therefore, this study will use the retail service quality scale to measure the service quality of the
convenience stores.
<b>3 </b>
<b>HYPOTHESES AND RESEARCH MODEL </b>
<b>3.1 Customer satisfaction </b>
Customer satisfaction is the feeling of customer satisfaction or frustration as a result of a comparison
between the performance of a product or service and his/her expectation [6], [16]. Customer satisfaction
is becoming the company's goal as more and more companies strive for quality in their products and
services Das et al. [17]. Therefore, customer satisfaction can be considered the essence of success in
today's highly competitive business world [4], [18].
Service quality and customer satisfaction are two different concepts but closely related concepts in
service research [8]. Service quality is related to service delivery, while customer satisfaction is customer
evaluation after using services or buying goods [14]. Some previous studies showed that service quality
has a positive effect on customer satisfaction [19], [20].
When customers appreciate the quality of service, the relationship between store and customer
becomes more attached. Customers will buy products again, buy more goods and can accept high prices
without switching to other stores. This leads to customers loyal to the store [12], [21]. Previous studies
showed that service quality has a positive effect on customer loyalty [7], [22].
Therefore, the following hypotheses were proposed:
H1: Service quality has a positive effect on customer satisfaction.
H2: Service quality has a positive effect on customer loyalty.
<b>3.2 Price </b>
</div>
<span class='text_page_counter'>(3)</span><div class='page_container' data-page=3>
extrinsic signal of quality [25]. Some empirical studies by many researchers showed that price has a
positively effect on customer satisfaction [18], [26].
In addition, customers tend to use price as a cue in evaluating their experience with products/services
[26]. Price also plays an important role in shaping their attitude toward the service supplier. That is, when
customers find that there is a fairness of price from the service provider, the positive feeling of the
customer towards the service provider will gradually develop. These feelings will gradually develop into
buying intentions. When purchasing intentions are more fully developed, customer loyalty will start to
form [25]. Some previous studies show that price positively effects on customer loyalty [6], [19].
Thus, we proposed the following hypotheses:
H3: Price has a positive effect on customer satisfaction.
H4: Price has a positive effect on customer loyalty.
<b>3.3 Customer loyalty </b>
Customer loyalty is often related to customers' willingness to continually purchase or service with
good psychology and attitude towards goods or companies that provide goods or services [27]–[29].
Satisfaction is the process of causing customer loyalty, but the level of customer satisfaction capable
of forming loyalty is a certain level of satisfaction that other service providers cannot provide level [6],
[30]. The degree of true loyalty begins with a very satisfied assessment of what customers receive from
the company [31]. The main cause of becoming loyal customers is that they are very satisfied with the
service received from the company [6]. Previous studies showed that customer satisfaction positively
effects on customer loyalty [6], [14].
Therefore, the following hypothesis was proposed:
H5: Customer satisfaction has a positive effect on customer loyalty.
<b>3.4 Research model </b>
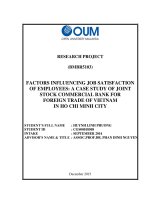
Based on the purpose of research, literature review and hypotheses development, the research model
can be presented in Figure 1.
<b>Figure 1: Research model (Source: Own research) </b>
<b>4 </b>
<b>RESEARCH METHODOLOGY </b>
<b>4.1 Measures </b>
The research model consists of 4 constructs. The measurement items are adopted from previous
studies. A five - point Likert scale, ranging from “1 = strongly disagree” to “5 = strongly agree” was used.
In this paper, the service quality construct is approached as an overall construct. Thus, five items of
for measuring service quality construct adopted from the Dabholkar et al. [13], Yu and Ramanathan [4].
Three items for measuring price construct adopted from Dimyati and Subagio [6]. Four items for
H5
H4
H3
H1
H2
Service quality
Price Customer loyalty
</div>
<span class='text_page_counter'>(4)</span><div class='page_container' data-page=4>
measuring customer satisfaction adopted from Beneke et al. [14], Yu and Ramanathan [4]. Three items
for measuring customer loyalty adopted from Joudeh and Dandis [18].
<b>4.2 Data collection and sample </b>
The population of the study is the customer who has purchased products/services in convenience
store in Ho Chi Minh City. The survey sample was conducted on the basis of convenience sampling with
different groups of customers about gender and income per month on many locations in Ho Chi Minh
City. The aim of this collecting is to achieve the representation for the collected sample. There were 400
customers participated in the research. Among responds returned, there were 42 responses were
eliminated because of uncompleted answers. Finally, there are usable 358 responses for further analysis.
Table 1 presents the socio-demographic data such as gender and income per month.
<i>Table 1. Socio-demographic characteristics of the sample </i>
<b>Characteristics </b> <b>Categories </b> <b>Frequency </b> <b>Percent </b>
Gender
Male 83 23.2
Female 275 76.8
Income
Less than $ 200 per month 47 13.1
$ 200 - $ 500 per month 182 50.8
$ 500 - $ 1000 per month 122 34.1
More than $ 1000 per month 7 2.0
<i>Source: Calculated by authors </i>
<b>5 </b>
<b>DATA ANALYSIS, RESULT AND DISCUSSION </b>
<b>5.1 Data analysis </b>
The proposed research model was tested by using the partial least squared structural equation
modeling (PLS-SEM) with SmartPLS software 3.2.7. Testing the proposed research model and
hypotheses was carried out through two stages: (1) Testing of the measurement model and (2) Testing of
the structural model [32]. (1) Testing of the measurement model: construct reliability and validity. The
steps to testing of the constructs reliability and validity are based on the suggestion of Hair et al. [32]
including the internal consistency reliability, convergence validity and discriminant validity. (2) Testing
of the structural model. The steps to testing of the structural model are based on the suggestion Hair et al.
[32].
<b>5.2 Result </b>
<b>Testing of the measurement model: construct reliability and validity </b>
The analysis results of the measurement scale of constructs are presented in Table 2.
</div>
<span class='text_page_counter'>(5)</span><div class='page_container' data-page=5>
<i>Table 2. The measurement scale of constructs </i>
<b>Construct </b> <b>Indicator </b> <b>Standardize </b>
<b>loading </b>
<b>Cronbach’s </b>
<b>alpha </b>
<b>(>0.70) </b>
<b>CR </b>
<b>(>0.70) </b>
<b>AVE </b>
<b>(>0.50) </b>
Service quality (SQ)
SQ1 0.755
0.880 0.913 0.677
SQ2 0.808
SQ3 0.860
SQ4 0.864
SQ5 0.822
Price
PRICE1 0.874
0.819 0.892 0.734
PRICE2 0.807
PRICE3 0.887
Customer satisfaction (SAT)
SAT1 0.812
0.826 0.884 0.656
SAT2 0.824
SAT3 0.810
SAT4 0.795
Customer loyalty (LOY)
LOY1 0.847
0.843 0.905 0.762
LOY2 0.905
LOY3 0.865
<i>Source: Data processing result </i>
Discriminant validity was assessed via the Fornell-Lacker criterion [33]. Table 3 shows that the
square root of AVE of reflective construct service quality, price, customer satisfaction, customer loyalty
is larger than the corresponding latent variables correlation. Thus, the constructs are met the discriminant
validity.
<i>Table 3. Discriminant validity </i>
<b>Construct </b> <b>Customer loyalty </b> <b>Price </b> <b>Customer </b>
<b>satisfaction </b> <b>Service quality </b>
Customer loyalty (LOY) <b>0.873 </b>
Price 0.500 <b>0.857 </b>
Customer satisfaction (SAT) 0.637 0.628 <b>0.810 </b>
Service quality (SQ) 0.622 0.471 0.636 <b>0.823 </b>
<i>Source: Data processing result </i>
<b>Testing of the structural model </b>
<i>Model fit testing </i>
</div>
<span class='text_page_counter'>(6)</span><div class='page_container' data-page=6>
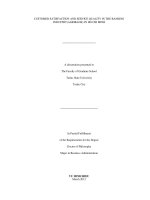
<i>Figure 2. The structural model (PLS-SEM) </i>
<i>Source: Data processing result </i>
<i>Table 4. Model fit </i>
Saturated model Estimated model
SRMR 0.071 0.071
d_ULS 0.609 0.609
d_G1 0.345 0.345
d_G2 0.282 0.282
Chi-square 602.240 602.240
NFI 0.812 0.812
<i>Source: Data processing result </i>
These results is presented in Figure 2 and Table 4 show that the Chi-square = 602.240 is significant
at 0.05 level (p=0.00). SRMR (standardized root mean square residual) is a measure of approximate fit of
the proposed research model. By convention, a model has good fit when SRMR is less than 0.08 [34].
The analyzing result in Table 4 shows that the model has SRMR indices = 0.071 <0.08. Thus, the
proposed research model is fit well with research data. Besides, testing of multicollinearity issue shows
that all VIF values are below the threshold of 5. Therefore, there are no multicollinearity problems in the
structural model [32].
<i>Hypotheses testing </i>
</div>
<span class='text_page_counter'>(7)</span><div class='page_container' data-page=7>
<i>Table 5. Hypotheses testing results </i>
Path Path
coefficient t-value p-value
95% confidence
interval Hypotheses Remark
SQ SAT 0.437 11.813 0.000 [0.336-0.506] H1 Accepted
SQ LOY 0.349 7.433 0.000 [0.252-0.434] H2 Accepted
Price SAT 0.422 10.245 0.000 [0.342-0.500] H3 Accepted
Price LOY 0.123 2.299 0.022 [0.012-0.220] H4 Accepted
SAT LOY 0.338 5.412 0.000 [0.227-0.460] H5 Accepted
<i>Source: Data processing result </i>
<b>R2 (explained variance), f2 (effect size) and Q2 (predictive relevance) </b>
For the structural model, the important evaluation metrics are R2 (explained variance), f2 (effect size)
and Q2 (predictive relevance) [32]. The R2 is the overall effect size measure for the structural model [35].
The R2 values of 0.19, 0.33 and 0.67 are respectively described as weak, moderate and substantial [36].
The effect size (f2) is described as the independent variable contribution to the dependent variable. The f2
value 0.02 is small, 0.15 is medium and 0.35 is high [37]. The cross-validated redundancy (Q2) is means
for assessing the structural model predictive relevance. The Q2 value should be larger than zero [32].
In this study, the R2 value for the overall model here is 0.494 less than 0.67, classified as a moderate
effect [36], whereas service quality together with price value explains 54.3% of the variance on customer
satisfaction (Table 6).
Table 6 also shows that the f2 effect sizes. Relatively high f2 effect sizes occur for the relationships
SQ SAT (0.325), SQ Price (0.303), a medium f2 effect size for the relationship SQ LOY (0.141),
a weak medium f2 effect size for the relationship SAT LOY (0.103), and the f2 effect size for the
relationship Price LOY (0.018) is relatively weak [37].
The Q2 values are more than zero. Thus, we found the model predictive relevance (Table 6).
<i>Table 6. R</i>2 (explained variance), f2 (effect size) and Q2 (predictive relevance)
Relationship f2 Construct R2 Q2
SQ SAT 0.325
Customer loyalty 0.494 0.353
SQ LOY 0.141
Price SAT 0.303
Customer satisfaction 0.543 0.332
Price LOY 0.018
SAT LOY 0.103
<i>Source: Data processing result </i>
<b>5.3 Discussion </b>
</div>
<span class='text_page_counter'>(8)</span><div class='page_container' data-page=8>
relationships for the retail service environment.
The research results show that service quality has a positive effect on customer satisfaction. Better
service quality will lead to more increased customer satisfaction. Hypothesis test results of this study
support various existing empirical concepts and findings explaining that the quality of service has a
positive effect on customer satisfaction [4], [14]. The research results also show that service quality has a
significant effect on customer loyalty. The finding of this paper also showed that in line with previous
studies [20], [38].
The research results show that price has a positive effect on customer satisfaction. The results of this
study were supported by previous studies [18], [26]. The research results also show that price has a
significant effect on customer loyalty. However, the effect of price on customer loyalty is relatively low
(β = 0.123) and the f2 effect size for the relationship Price LOY (0.018) is relatively weak. The results
of this study were supported by previous studies [19], [26].
The research result also shows that customer satisfaction has a significant effect on customer loyalty.
The finding of this paper also showed that in line with previous studies [6], [39].
<b>6 </b>
<b>IMPLICATIONS, LIMITATIONS AND CONCLUSION </b>
<b>6.1 Managerial implications </b>
The finding of this paper showed that service quality plays an important role in affecting customer
satisfaction. Moreover, service quality also plays an important role in affecting customer loyalty.
Therefore, managers and marketers should pay attention to the above results in the process of developing
and implementing their business strategy. Moreover, in order to increase service quality providing for
customers, store managers need to pay attention to the components of service quality such as physical
aspects, reliability, personal interaction, problem solving and store policy in building and implementing
their strategies.
The finding of this paper also showed that price plays an important role in affecting customer
satisfaction. Besides, price also is effect on customer loyalty. These findings provide guidelines for
business practitioners with regard to the importance of price. Thus, store managers should pay attention in
price design such as affordable, competitive compared to other stores, suitable for product quality to
increase customer satisfaction and customer loyalty.
The finding of this paper also showed that customer satisfaction is a very important part in customer
loyalty. Customer loyalty is reflected by repurchasing and recommendations to others. Satisfied
consumers will continue to buy the products or services, use them even tell others of the advantages of
these products/services based on their experience in using the product/service. Customer satisfaction
should be maintained and enhanced in order to create and maintain customer loyalty. Customer loyalty is
a proof of commitment which is strongly held by customers to buy again a certain products or services in
the future [6]. By recognizing and analyzing these findings, retailers will be better able to formulate and
implement their strategic plans.
<b>6.2 Limitations and future research </b>
This study has some limitations. Firstly, this study is only for some convenience stores in Ho Chi
Minh City, not yet representative of other cities in Vietnam. Secondly, this study only considers the
relationship between service quality, price, customer satisfaction and customer loyalty. There may be
other factors that also affect to explaining customer satisfaction and customer loyalty. From the above
limitations can open up directions for future research.
<b>6.3 Conclusion </b>
</div>
<span class='text_page_counter'>(9)</span><div class='page_container' data-page=9>
sample of 358 customers at convenience stores in Ho Chi Minh City. By using the partial least squared
structural equation modeling (PLS-SEM) with SmartPLS software for data analysis. The finding showed
that service quality has a significant positive effect on both of customer satisfaction and customer loyalty.
The finding of this paper also showed that price has a significant positive effect on both of customer
satisfaction and customer loyalty. The finding also showed that customer satisfaction has a significant
positive effect on customer loyalty.
<b>REFERENCES </b>
[1] Diễm Trang. (2018) Cửa hàng tiện lợi: Trong chán, ngoài thèm. [Online]. Available:
[2] Việt Đức. (2018) Người Việt mua sắm ở cửa hàng tiện lợi nhiều hơn siêu thị. [Online]. Available:
<i>[3] F. F. Reichheld and W. E. Sasser, Zero Defections: Quality Comes to Services, Harvard Business Review, pp. </i>
105–113, 1990.
[4] W. Yu and R. Ramanathan, Retail service quality, corporate image and behavioural intentions: the mediating
<i>effects of customer satisfaction, International Review of Retail, Distribution and Consumer Research, vol. 22, </i>
no. 5, pp. 485–505, 2012.
[5] C. Shpetim, Exploring the relationships among service quality, satisfaction, trust and store loyalty among retail
<i>customers, Journal of Competitiveness, vol. 4, no. 4, pp. 16–35, 2012. </i>
[6] M. Dimyati and N. A. Subagio, Impact of Service Quality, Price, and Brand on Loyalty with the mediation of
<i>Customer Satisfaction on Pos Ekspres in East Java, Mediterranean Journal of Social Sciences, vol. 14, no. 3, </i>
pp. 225–238, 2016.
[7] Y. F. Kuo, C. M. Wu, and W. J. Deng, The relationships among service quality, perceived value, customer
<i>satisfaction, and post-purchase intention in mobile value-added services, Computers in Human Behavior, vol. </i>
25, no. 4, pp. 887–896, 2009.
[8] A. Parasuraman, V. A. Zeithaml, and L. L. Berry, A conceptual model of service quality and its implications
<i>for future research, Journal of Marketing, vol. 49, no. 4, pp. 41–50, 1985. </i>
[9] A. Parasuraman, V. A. Zeithaml, and L. L. Berry, Servqual: A multiple-item scale for measuring consumer
<i>perceptions of service quality, Journal of Retailing, vol. 64, no. 1, pp. 12–40, 1988. </i>
<i>[10] J. J. Cronin and S. A. Taylor, Measuring quality: A reexamination and extention, Journal of Marketing, vol. </i>
56, no. 3, pp. 55–68, 1992.
[11] A. Parasuraman, V. A. Zeithaml, and L. L. Berry, Reassessment of expectations as a comparison standard in
<i>measuring service quality: Implications for further research, Journal of Marketing, vol. 58, no. 1, p. 111, 1994. </i>
<i>[12] V. A. Zeithaml, L. L. Berry, and A. Parasuraman, The behavioral consequences of service quality, Journal of </i>
<i>Marketing, vol. 60, pp. 31–46, 1996. </i>
[13] P. A. Dabholkar, D. I. Thorpe, and J. O. Rentz, A measure of service quality for retail stores: Scale
<i>development and validation, Journal of the Academy of Marketing Science, vol. 24, no. 1, pp. 3–16, 1996. </i>
[14] J. Beneke, C. Hayworth, R. Hobson, and Z. Mia, Examining the effect of retail service quality dimensions on
<i>customer satisfaction and loyalty: The case of the supermarket shopper, Acta Commercii, vol. 12, no. 1, pp. </i>
27–43, 2012.
</div>
<span class='text_page_counter'>(10)</span><div class='page_container' data-page=10>
<i>quality and perceived value on behavioural intentions in retail industry, in Proc. Int. Conf. on Economic and </i>
<i>Social Development, 2017, pp. 330–342. </i>
<i>[16] P. Kotler and K. L. Keller, Marketing Management, 14th ed. Pearson Education, 2012. </i>
<i>[17] A. Das, V. Kumar, and G. C. Saha, Retail service quality in context of CIS countries, International Journal of </i>
<i>Quality and Reliability Management, vol. 27, no. 6, pp. 658–683, 2010. </i>
[18] J. M. M. Joudeh and A. O. Dandis, Service Quality, Customer Satisfaction and Loyalty in an Internet Service
<i>Providers, International Journal of Business and Management, vol. 13, no. 8, p. 108, 2018. </i>
[19] F. Lai, M. Griffin, and B. J. Babin, How quality, value, image, and satisfaction create loyalty at a Chinese
<i>telecom, Journal of Business Research, vol. 62, no. 10, pp. 980–986, 2009. </i>
[20] M. S. Iqbal, M. U. Hassan, and U. Habibah, Impact of self-service technology (SST) service quality on
<i>customer loyalty and behavioral intention: The mediating role of customer satisfaction, Cogent Business and </i>
<i>Management, vol. 5, no. 1, pp. 1–23, 2018. </i>
[21] A. Ismail and K. Naser, Service quality as a predictor of customer satisfaction and customer loyalty,
<i>LogForum, vol. 12, no. 4, pp. 269–283, 2016. </i>
[22] I. G. Saura, D. S. Francés, G. B. Contrí, and M. F. Blasco, Logistics service quality: A new way to loyalty,
<i>Industrial Management and Data Systems, vol. 108, no. 5, pp. 650–668, 2008. </i>
<i>[23] P. Kotler and G. Armstrong, Princeple of Marketing, 16th ed. Pearson Education, 2016. </i>
<i>[24] J. R. Hanaysha, Customer retention and the mediating role of perceived value in retail industry, World Journal </i>
<i>of Entrepreneurship, Management and Sustainable Development, vol. 14, no. 1, pp. 2–24, 2018. </i>
[25] K. Yieh, Y. C. Chiao, and Y. K. Chiu, Understanding the antecedents to customer loyalty by applying
<i>structural equation modeling, Total Quality Management and Business Excellence, vol. 18, no. 3, pp. 267–284, </i>
2007.
[26] H. Han and K. Ryu, The roles of the physical environment, price perception, and customer satisfaction in
<i>determining customer loyalty in the restaurant industry, Journal of Hospitality and Tourism Research, vol. 33, </i>
no. 4, pp. 487–510, 2009.
[27] G. T. Yeo, V. V. Thai, and S. Y. Roh, An Analysis of Port Service Quality and Customer Satisfaction: The
<i>Case of Korean Container Ports, Asian Journal of Shipping and Logistics, vol. 31, no. 4, pp. 437–447, 2015. </i>
[28] Z. Deng, Y. Lu, K. K. Wei, and J. Zhang, Understanding customer satisfaction and loyalty: An empirical study
<i>of mobile instant messages in China, International Journal of Information Management, vol. 30, no. 4, pp. </i>
289–300, 2010.
[29] I. G. M. Y. Bakti and S. Sumaedi, An analysis of library customer loyalty:The role of service quality and
<i>customer satisfaction, a case study in Indonesia, Library Management, vol. 34, no. 6–7, pp. 397–414, 2013. </i>
<i>[30] R. L. Oliver, Satisfaction: A Behavioral Perspective on the Consumer. The McGraw-Hill Companies, 1997. </i>
<i>[31] T. O. Jones and W. E. Sasser, Why satisfied customer defect, Harvard Business Review, vol. 73, no. 6, pp. 88–</i>
99, 1995.
<i>[32] J. F. Hair, G. T. M. Hult, C. M. Ringle, and M. Sarstedt, A Primer on Partial Least Squares Structural </i>
<i>Equation Modeling (PLS-SEM), 2nd ed. SAGE Publications, 2017. </i>
</div>
<span class='text_page_counter'>(11)</span><div class='page_container' data-page=11>
[34] L. Hu and P. M. Bentler, Fit indices in covariance structure modeling: Sensitivity to underparameterized model
<i>misspecification., Psychological Methods, vol. 3, no. 4, pp. 424–453, 1998. </i>
<i>[35] G. D. Garson, Partial least squares: Regression & structural equation models, 2016 ed. Statistical Associates </i>
Publishers, 2016.
<i>[36] W. W. Chin, The partial least squares approach to structural equation modelling, in Modern Methods for </i>
<i>Business Research, G. A. Macoulides, Ed. Lawrence Erlbaum Associates, 1998, pp. 295–336. </i>
<i>[37] J. Cohen, Statistical power analysis for the behavioral sciences. Lawrence Erlbaum Associates, 1988. </i>
[38] L. H. P. Yaya, F. Marimon, and M. Casadesus, Assessing the Effects of Online Service Quality on Loyalty and
<i>the Mediation Role of Customer, in Proc. Int. Conf. on International Quality, 2014, pp. 223–234. </i>
<i>[39] N. U. Hadi, N. Abdullah, and I. Sentosa, Making sense of mediating analysis: A marketing perspective, Review </i>
<i>of Integrative Business and Economics Research, vol. 5, no. 2, pp. 62–76, 2016. </i>
</div>
<!--links-->