STUDYING TO BUILD THE DETERMINATION PROCESS OF AMMELIDE (AMD) AND DICYANDIAMIDE (DCD) IN ANIMAL FEED BY HIGH-PERFORMANCE LIQUID CHROMATOGRAPHY (HPLC) WITH A DIODE-ARRAY DETECTOR (DAD)
Bạn đang xem bản rút gọn của tài liệu. Xem và tải ngay bản đầy đủ của tài liệu tại đây (445.64 KB, 13 trang )
<span class='text_page_counter'>(1)</span><div class='page_container' data-page=1>
<b>STUDYING</b>
<b>TO</b>
<b>BUILD</b>
<b>THE</b>
<b>DETERMINATION</b>
<b>PROCESS</b>
<b>OF</b>
<b>AMMELIDE</b>
<b>(AMD)</b>
<b>AND</b>
<b>DICYANDIAMIDE</b>
<b>(DCD)</b>
<b>IN</b>
<b>ANIMAL</b>
<b>FEED</b>
<b>BY</b>
<b>HIGH-PERFORMANCE</b>
<b>LIQUID</b>
<b>CHROMATOGRAPHY</b>
<b>(HPLC)</b>
<b>WITH</b>
<b>A</b>
<b>DIODE-ARRAY</b>
<b>DETECTOR</b>
<b>(DAD) </b>
<b>Dang Van Su</b>
<b>1*</b><b><sub>, Phan Thi Thanh Dieu</sub></b>
<b>1</b><b><sub>, Bui Van Tam</sub></b>
<b>2</b><i>1<sub>Ho Chi Minh City University of Food Industry </sub></i>
<i>2</i>
<i>National Centre for Veterinary Drugs and Bio-Products Control No.2 </i>
<i>*Email: </i>
Received: 12 May 2020; Accepted: 24 July 2020
<b>ABSTRACT </b>
<i>The purpose of this study is to built a process for determining the content of fake protein </i>
enhancers such as Ammelide (AMD) and Dicyandiamide (DCD) in animal feed in accordance
with the sample preparation procedure combined with a solid phase extraction (SPE)
purification process and a high-performance liquid chromatography (HPLC) with a
diode-array detector (DAD). The content of AMD and DCD in animal feed samples were determined
with quantitative limits of 0.1-1.000 ppm, respectively for both substances, meeting AOAC
(Association of Official Analytical Chemists) requirements for method validation and
requirements for sensitivity, repeatable, linear intervals to be practically applicable. The
procedure of determination has been effectively applied at National Centre for Veterinary
Drugs and Bio-Products Control No. 2 to control the content of AMD and DCD in the basis
of actual animal feed samples.
<i>Keywords: Fake protein enhancers, AMD, DCD, animal feed, SPE, HPLC-DAD. </i>
<b>1. INTRODUCTION </b>
</div>
<span class='text_page_counter'>(2)</span><div class='page_container' data-page=2>
many different components such as proteins, fats, antibiotics, minerals and some other
components (existing components are available in natural materials). If these components are
not removed before quantifying AMD and DCD, they will cause errors in analysis results. The
purpose of this study is to develop a process to identify AMD and DCD according to the
sample preparation process combined with the cleaning process by solid phase extraction
(SPE) and quantification by HPLC-DAD analysis method, which is popularized in many
laboratories in Vietnam.
<b>2. METERIALSANDMETHODS </b>
<b>2.1. Materials </b>
<i>2.1.1. Chemicals </i>
Ammelide standard (99%, Dr. Ehrenstofer GmbH), cyanoguanidine (98%, Sigma);
ammonia solution: 25%, Merck; acetonitrile (ACN): 99.9%, Fisher; methanol: 99.9%, Fisher;
formic acid: 98-100%, Merck; ammonium acetate: 98%, Merck; super clean water: 18 MΩ-cm;
trifloroacetic acid (TFA): 99%, acros organic.
<i>2.1.2. Standard solutions, samples and mobile phases </i>
<i>DCD 1,000 ppm stock standard solution: Accurately weighed about 10 ± 0,1 mg of DCD </i>
standard in a 10 mL volumetric flask, add 8 mL of H2O, ultrasonic in 30 minutes, make up to
the mark with H2O. This solution is then stored in a refrigerator at 2-8 °C in a light-free
condition.
<i>AMD 1,000 ppm stock standard solution: Accurately weighed about 10 ± 0,1 mg of AMD </i>
standard in a 10 mL volumetric flask, add 50 µL of 25% ammonia solution (because ammelide
is sparingly soluble in water and easily soluble in mild alkaline solutions, add 8 mL of H2O,
ultrasound in 5 minutes, then make up to the mark with H2O. This solution is then stored in a
refrigerator at 2-8 o<sub>C in a light-free condition. </sub>
<i>The analysis standard solution is diluted from stock standard solution with a mixture of </i>
solvent ACN - ammonium acetate 10 mM (50:50, v:v).
<i>Ammonium acetate solution 10 mM: Accurately weighed about 393.3 mg of ammonium </i>
acetate (99%, Merck) into Becher 500 mL, dissolved with 500 mL H2O.
<i>Sample extract solution ACN:H</i>2<i>O (50:50, v:v): Dissolved 50 mL of ACN solution into </i>
50 mL H2O, mixed thoroughly with the vortex.
<i>Ammonium acetate soluble solution 10 mM - ACN (50:50, v:v): Dissolved 50 mL of </i>
10 mM ammonium acetate into 50 mL of ACN, mixed thoroughly with the vortex.
<i>TFA solution 0.1%: Dissolved 100 µL of 99% TFA solution in 100 mL H</i>2O, mixed
thoroughly with the vortex.
<i>Ammonia solution 5% in MeOH: Dissolved 20 mL of 25% ammonia solution into 80 mL </i>
MeOH, mixed thoroughly with the vortex.
<i>Mobile phase: Mobile phase A: ammonium acetate 10 mM, adjusted to pH 6.5 with 0.1% </i>
formic acid solution; Mobile phase B: ACN.
<i>2.1.3. Blank sample and standard spiked sample </i>
<i>Blank sample: The composition of blank sample was similar to the real sample but does </i>
</div>
<span class='text_page_counter'>(3)</span><div class='page_container' data-page=3>
<i>Standard spiked sample: Blank sample was added to a quantity of standard AMD, DCD </i>
solution with known concentrations, then mixed well and dried at a temperature of about 60 o<sub>C </sub>
in 8 hours.
<b>2.2. Methods </b>
<i>2.2.1. Analytical process </i>
The analytical procedure was based on analytical procedures (FDA LIB 4422, CLG
<i>Me.01,..) [7, 8] and studies by Shen et al. [9], Fu & Schreiber [10], Turowski Maciej [11], </i>
<i>Krunve et al. [12, 13]: Static phase with Hilic separation column: Inertsil, 5 àm (pore size </i>
100 ), 4.6 ì 250 mm; Flow rate: 0.3-0.5 mL/minute; pH 6-7; Mobile phase solvent (ACN):
50-70; Device used to survey results: HPLC-DAD: wavelength 210 nm; Mobile phase A:
amonium acetate 10 mM; Mobile phase B: ACN.
<i>2.2.2. Sample processing procedure </i>
Samples of animal feed were ground and homogenized by IKA homogenizer. Weighed
1-2 ± 0.5 g of homogenized sample into a 50 mL centrifuge tube, added exactly 25 mL of
ACN:H2O extraction solution (50:50, v:v). Shaked well with Vortex (2500 rpm) in 30 minutes,
then centrifuged the entire extract solution (6000 rpm, 4 °C) in 10 minutes. The resulting extract
is filtered through a membrane filter (0.45 µm - 25 mm) [7, 8]. Took exactly 20 mL of solution
after filtration to clean with solid phase extraction (SPE) with an extraction solvent of ACN:H2O
(50:50, v:v), SPE SCX (cation extraction) extraction column 500 mg/3 mL [7, 14, 15]. The
solution obtained after cleaning by SPE will be concentrated with nitrogen gas and redissolved
with 2 mL of dissolved solution. Injected then into the HPLC system.
<i>2.2.3. Optimization of the HPLC conditions </i>
2.2.3.1. Selection of static phase
Based on previous studies on AMD and DCD content determination methods [16-19],
the water-based interaction chromatography technique (Hilic) was selected.
2.2.3.2. Investigation of the flow rate, composition of mobile phase and pH
Standard solutions with concentrations of 50 ppb (AMD) and 50 ppb (DCD) were used
to investigate the effects of flow rate, mobile phase composition and pH. Investigation of the
optimal condition of the mobile phase component was conducted on HPLC-DAD: 210 nm
wavelength with the following parameters: Flow rate: 0.3-0.5 (low - high); Isocratic running
mode; Mobile phase A (ammonium acetate 10 mM): 20-60 (low - high); Mobile phase B
(ACN): 80-40 (low - high) and pH: 6-7 (low - high);
<i>Based on the research of Srinubabu et al. [20], the experimental model of 2</i>k<sub> was selected </sub>
and arranged according to Table 1.
Evaluating the influence of factors based on the result of comparing the ability of
separation, retention time, peak area and analyte stability from the obtained results.
<i>2.2.4. Investigation of SPE extraction </i>
2.2.4.1. Selection of extraction solvent
The extraction solvent, ACN:H2O (50:50, v:v), was selected according to the references
</div>
<span class='text_page_counter'>(4)</span><div class='page_container' data-page=4>
<i>Table 1. Experimental arrangement for investigating the optimal condition of mobile </i>
phase composition for HPLC
No. % ACN Flow rate pH of mobile phase
1 50 0.3 6
2 70 0.3 6
3 50 0.5 6
4 70 0.5 6
5 50 0.3 7
6 70 0.3 7
7 50 0.5 7
8 70 0.5 7
9 60 0.4 6.5
10 60 0.4 6.5
11 60 0.4 6.5
2.2.4.2. Investigation of SPE extraction procedure
The SPE extraction procedure was proposed according to the Phenomenex instructions,
including the following steps: Activated the column: added 5 mL MeOH and 5 mL H2O,
respectively; Added sample: took exactly 20 mL of sample into the column so that the flow
rate of the sample through the column is 2-4 drops/10s; Dried the column: used a vacuum
pump to dry the solution contained in the column; Washed impurities: added 5 mL H2O and
5 mL 0,1% TFA, respectively; Dried the column: used a vacuum pump to dry the solution
contained in the column; Recovery of analyte: Added 8-10 mL of 5%/MeOH ammonium
acetate eluent to the column, dripping speed of 2-4 drops/10 seconds. Because the amount of
elution solvent will determine the recovery of elution solvent volumes at 3 levels of 6 mL,
8 mL and 10 mL, with the analyte (AMD and DCD) content at two levels of 5 ppb and 120 ppb
will be surveyed; Dried the column: used a vacuum pump to dry the solution contained in the
column; All eluents were evaporated in a boiling pot (45-55 °C) combined with blowing
nitrogen, then redissolved with 1 mL 10 mM ammonium acetate - ACN (50-50) and then,
injected into the HPLC system.
The results of the survey were evaluated based on the comparison of the results of the
analyte content obtained and the theoretical concentration.
<i>2.2.5. Appraisal method </i>
2.2.5.1. Specificity
Following the guidelines of the European Analytical Society, the HPLC-DAD is
acceptable to confirm a positive sample [21].
2.2.5.2. Investigation of LOD, LOQ
LOD detection limit (qualitative limit) is determined according to the method evaluation
guidelines of the National Institute for Food Control [22], LOQ was determined by the
following formula:
</div>
<span class='text_page_counter'>(5)</span><div class='page_container' data-page=5>
LOD and LOQ of the device were determined as follows: Standard solution with
concentration of about 100 ppb or less, injected this solution into DAD; Diluted the
concentration of the above solution until a signal of the peak that met the signal / noise
requirements (S/N) ≥ 3 - 10 (for substances classified as toxin) and S/N ≥ 3 (for substances
not classified as toxic), according to SANCO/825/00 rev.8.1 16/11/2010 [23]; Calculated to
determine the LOD, LOQ of the device.
The LOD and LOQ of the method were as follows: From the LOD of the device, the
amount of standard solution added to the blank sample was calculated so that 1 g of the
standard spiked sample contained was equal to the LOD of the device; Homogenized the
standard spiked sample according to ISO Guide 35:2017 [24] and EC 657/2002 [25];
Processed sample and injected into the chromatographic system to determine S/N; Increased
or decreased the amount of standard solution added to the blank sample according to the results
of S/N until it complied with the requirements for the determination of LOD and LOQ
according to EC 657/2002 [25].
2.2.5.3. Investigating linear intervals
Standard solution with concentration ranged from 1 - 1,000 ppb, then injected into HPLC
system with injection procedure from low to high concentration solution. The standard
solution was treated the same as the sample solution. The calibration curve was investigated
on the DAD at 210 nm.
2.2.5.4. Investigating repeatability and recovery
Based on the guidance of ISO Guide 35:2017 [24] and EC 657/2002 [25], standard spiked
sample with known concentration of AMD and DCD standard solution created to investigate
the repeatability and recovery. The concentration of standard solution added to animal feed
samples is shown in Table 2 and Table 3.
<i>Table 2. Concentration of standard solution added to sample to investigate repeatability </i>
and recovery of HPLC - DAD
Substances Concentration (ppm)
Sample 1 Sample 2 Sample 3
AMD 10 50 100
DCD 10 500 100
<i>Table 3. Concentration added to sample for SPE extraction volume survey </i>
Substances Concentration (ppb)
Sample 4 (SPE) Sample 5 (SPE)
AMD 5 120
DCD 5 120
</div>
<span class='text_page_counter'>(6)</span><div class='page_container' data-page=6>
<b>3. RESULTSANDDISCUSSION</b>
<b>3.1. Optimized the HPLC mobile phase conditions </b>
Based on previous studies [12, 13], three factors influenced the analysis process were
mobile phase solvent (ACN) (50-70), flow rate (TDD) (0.3-0.5 mL/minute) and pH mobile
phase (pH 6-7) selected.
<i>Table 4. Results of optimization of HPLC mobile phase conditions </i>
No. % ACN Flow rate
(TDD)
pH
mobile phase
Retention time Peak area
AMD DCD AMD DCD
1 50 0.3 6 8.90 10.3 7,902.09 16,867.43
2 70 0.3 6 9.34 10.4 8,644.51 18,938.03
3 50 0.5 6 5.29 6.21 4,770.924 10,227.53
4 70 0.5 6 5.10 6.18 5,133.33 10,323.73
5 50 0.3 7 8.84 10.4 7,968.61 11,273.2
6 70 0.3 7 9.37 10.4 8,654.31 17,328.3
7 50 0.5 7 5.285 6.20 4,810.89 10,246.23
8 70 0.5 7 5.558 6.20 5,081.43 10,638.37
9 60 0.4 6.5 6.63 7.71 6,837.4 14,879.7
10 60 0.4 6.5 6.631 7.70 5,902.57 13,886.85
11 60 0.4 6.5 6.631 7.70 6,905.8 14,922.05
The results in Table 4 showed that the pH mobile phase varied from 6-7, the peak areas
of AMD and DCD were not significantly changed. Increasing the amount of ACN from 50%
to 70%, the substances were in the column longer. At the high flow rate, the substances output
faster, the peak parameters were better than at the low flow rate. According to the survey, the
results were stable at a flow rate of 0.4 mL/minute and 60% ACN.
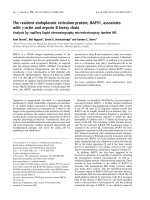
The data in Figure 1 and Table 5 showed that the flow rate of the mobile phase
significantly affected to the AMD analysis by HPLC. Similarly, results of DCD were shown
in Figure 2 and Table 5.
</div>
<span class='text_page_counter'>(7)</span><div class='page_container' data-page=7>
<i>Figure 2. Pareto frequency chart of DCD effects </i>
<i>Table 5. Variant values of AMD and DCD </i>
Substances DCD AMD
Source F-Ratio P-Value F-Ratio P-Value
A: % ACN 27.00 0.0351 1.69 0.3232
B: flow rate 191.99 0.0052 71.15 0.0138
C: pH 17.18 0.0536 0.00 0.9713
AB 21.22 0.0440 0.25 0.6657
AC 6.67 0.1229 0.01 0.9339
BC 20.67 0.0451 0.00 0.9607
ABC 0.00 0.9843
Lack-of-fit 8.11 0.1098 0.04 0.8667
R-squared (%) 93.9871 97.2903
R-squared (adjusted for Degree of
freedom) (%) 84.9678 90.9678
Standard Error of Est, 586.137 560.514
Mean absolute error 599.492 127.002
Factors with a P-Value < 0.05 significantly affected the analysis results (peak area).
Accordingly, the variant values in Table 5 showed: For AMD: flow rate of the mobile phase
(P-Value = 0.0138) significantly effected on the analysis results; For DCD: % ACN (P-Value = 0,0351)
and the mobile phase flow rate (P-Value = 0.052) have a significant influence on the analysis
results. Lack-of-fit parameters with P-Value = 0.1098 (> 0.05) and R-squared > 90% at α = 95%
showed that 2k<sub> model was suitable for experimental design. </sub>
For AMD, the prediction equation:
Area = 8,600.55 + 66,8136*%ACN – 12,746.3*TDD + 116.262*pH – 42.2666*%ACN*TDD –
0.198763*%ACN*pH + 306.751*TDD*pH - 8.78914*%ACN*TDD*pH (2)
For DCD, the prediction equation:
Area = 97,598.0 – 206.027*%ACN – 93,914.8*TDD – 15,675.6*pH - 954.671*%ACN*TDD +
107.011*%ACN*pH + 18,843.3*TDD*pH (3)
Where:
</div>
<span class='text_page_counter'>(8)</span><div class='page_container' data-page=8>
The results in Table 6 showed the optimization of parameters of HPLC technique for
AMD and DCD analysis.
<i>Table 6. Results of optimization of HPLC specifications for AMD and DCD </i>
Substances DCD AMD
Factors Low High Optimal values Optimal values
ACN 50.0 70.0 60.7355 61.3798
Flow rate 0.3 0.5 0.387795 0.378455
pH 6.0 7.0 6.51702 6.51686
To simply the installation of device, the following parameters were proposed: %ACN:
60%; Flow rate: 0.4 mL/minute: pH: 6.5. Ammonium acetate 10 mM - ACN (50:50, v:v) was
chosen as the solvent, pH 6.5. AMD standard solutions (50 ppm) and DCD (50 ppm) were used
to verify optimum results of HPLC. The verification results were shown in Table 7.
<i>Table 7. Compared results after optimization </i>
Values Peak area of DCD Peak area of AMD
The predicted optimal value 5,905.82 14,922.05
The actual optimal value 5,878.58 5,778.81 5,818.74 14,915.4 13,254.6 14,275.8
Tstat 2.775
Tcritical (α = 0.05) 4.302
The statistical results showed that there was almost no difference (tcritical > tstat;α = 0.05)
between the actual value and the predicted optimal value. Therefore, the selected parameters
can be applied in real sample.
<b>3.2. Investigation of sample cleaning procedure by SPE </b>
Table 8 and Table 9 showed the survey results of AMD and DCD contents at different
elution solvent volumes.
<i>Table 8. Survey results of AMD content at different elution solvent volumes </i>
AMD (5 ppb) AMD (120 ppb)
The volume of
eluting solvent 6 mL 8 mL 10 mL 6 mL 8 mL 10 mL
AMD content detected
(ppb)
</div>
<span class='text_page_counter'>(9)</span><div class='page_container' data-page=9>
<i>Table 9. Survey results of DCD content at different elution solvent volumes </i>
DCD 5 ppb DCD 120 ppb
The volume
of eluting solvent 6 mL 8 mL 10 mL 6 mL 8 mL 10 mL
DCD content
detected (ppb)
2.3425 4.5084 5.5057 82.2926 119.6097 129.3401
2.2589 4.7848 4.0333 107.1688 102.9985 107.8945
3.0764 4.8819 5.5259 71.6622 103.1706 108.7572
<i>Table 10. Results of the recovery survey </i>
The volume of
eluting solvent
AMD (5 ppb) AMD (120 ppb)
6 mL 8 mL 10 mL 6 mL 8 mL 10 mL
Recovery 38.35 % 87.31 % 78.66 % 85.3 % 95.5 % 78.7 %
DCD (5 ppb) DCD (120 ppb)
Recovery 50.95 % 95.2 % 92.97 % 72.53% 90.5 % 96.11 %
The analytical results in Table 10 showed that the amount of elution solvent was 6 mL,
the recovery efficiency varied between 38% and 85%. At the volumes of solvent respectively
8 mL and 10 mL, the results showed that there was not significant difference. Therefore, the
recommended elution volume was 8 mL.
<b>3.3. Validation of analytical methods </b>
<i>3.3.1. Specificity / selection </i>
The results of determination of AMD and DCD content of animal feed samples
"Concentrated feed for pigs from training - finishing" from Asian company were determined
that AMD and DCD content were negative.
<i>3.3.2. The limit of detection (LOD) and the limit of quantitation (LOQ) </i>
The results of the limit of detection (LOD) and the limit of quantitation (LOQ) for AMD
and DCD were presented in Table 11.
<i>Table 11. LOD, LOQ survey results for LC-DAD </i>
Substances Concentration (ppm) Ratio S/N Number of injections
AMD
LOD 0.05 5.01
7
LOQ 0.1 14.18
DCD
LOD 0.05 3.25
LOQ 0.1 10.16
</div>
<span class='text_page_counter'>(10)</span><div class='page_container' data-page=10>
<i>3.3.3. Results of investigating linear intervals </i>
Results of investigating linear intervals for HPLC-DAD in Table 12 showed that AMD
and DCD have linear range of 0.1-50 ppm.
<i>Table 12. Investigating linear intervals </i>AMD and DCD
Substances Concentration of standard
solution (ppm) Correlation coefficients
DCD
0.1
0.9998
0.5
1
5.0
10
50
AMD
0.1
0.9999
0.5
1
5.0
10
50
<i>3.3.4. Accuracy, repeatability and recovery </i>
Table 13 and Table 14 showed the results of the investigation of repeatability and
recovery of standard spiked animal feed samples. According to the AOAC (app-f)
documentation of the validity of the method, the results were on completely responsive.
Recoveries ranged from 92.4% to 98.2% that were relatively higher than those in previous
studies (84.6%-96.8% - DCD analysis with HPLC-UV) [3], (61.4%-117.2% - AMD analysis
with GC-MS/MS) [4].
<i>Table 13. Concentration added to the sample to investigate recovery, repeatability </i>
Substances Concentration (ppm)
Sample 1 Sample 2 Sample 3
AMD 1 5 10
</div>
<span class='text_page_counter'>(11)</span><div class='page_container' data-page=11>
<i>Table 14. Accuracy, repeatability and recovery </i>
Substances
Level
spiked
(ppm)
Assay concentration
(ppm) Results
AOAC
requirements
Sample 1 Sample 2 Sample 3 Average Recovery
%
RSD
(%)
Recovery
%
RSD
(%)
DCD
1 0.92 0.96 0.95 0.94 94.33 5.43
60 - 115 < 21
5 4.87 4.93 4.94 4.91 98.2 0.77
10 9.21 9.29 9.23 9.24 92.4 0.45 80 – 110 < 15
AMD
1 0.93 0.89 0.97 0.93 93.0 4.30
60 - 115 < 21
5 4.83 4.81 4.84 4.83 96.5 0.23
10 9.11 9.35 9.26 92.4 92.4 1.31 80 – 110 < 15
<b>4. CONCLUSION </b>
The study has established a process to identify AMD and DCD according to the sample
preparation process combined with SPE technique and quantification by HPLC-DAD. This
proposed analytical procedure included sample pretreatment using SPE SCX (cation
extraction) extraction column 500 mg/3 mL with an extraction solvent of ACN:H2O (50:50, v:v)
at elution volume of 8 mL, followed by pre-concentration using nitrogen gas and analysis
with HPLC-DAD. Static phase with Hilic separation column: Inertsil, 5 µm (pore size
100 Å), 4.6 × 250 mm; Flow rate: 0.4 mL/minute; pH 6.5; Mobile phase solvent (ACN): 60%;
Wavelength 210 nm. The method is capable of quantifying AMD and DCD content in real
animal feed samples with quantitative limits of 0.1-1.000 ppm, respectively, for both
substances, meeting the requirements of AOAC for method validation. The method has been
effectively applied at the National Centre for Veterinary Drugs and Bio-Products Control No.2
to control AMD and DCD content in animal feed sample background. The method satisfies
the requirements of sensitivity, repeatability, linear intervals to be practical in application. In
the future, this method may be proposed to further research and develop into a Vietnamese
Standard. However, more research is needed to assess the factors that influence the analysis
process from more feed sample bases to expand the applicability of the method to serve the
needs of analysis as well as contribute to the analysis, support the quality management of
animal feed, contribute to ensuring food safety and hygiene.
<b>REFERENCES </b>
1. Chen X.H., Zhou L.X., Zhao Y.G., Pan S.D., Jin M.C. - Application of nanoring
amino-functionalized magnetic polymer dispersive micro-solid-phase extraction and
ultra fast liquid chromatography–tandem mass spectrometry in dicyandiamide residue
<b>analysis of powdered milk, Talanta 119 (2014) 187-192. </b>
2. MacMahon S., Begley T.H., Diachenko G.W., Stromgren S.A. - A liquid
chromatography-tandem mass spectrometry method for the detection of economically
motivated adulteration in protein-containing foods, Journal of Chromatography A
<b>1220 (2012) 101-107. </b>
</div>
<span class='text_page_counter'>(12)</span><div class='page_container' data-page=12>
4. Miao H., Fan S., Wu Y.N., Zhang L., Zhou P.P., Li J.G., Chen H.J., Zhao Y.F. -
Simultaneous determination of melamine, ammelide, ammeline, and cyanuric acid in
milk and milk products by gas chromatography-tandem mass spectrometry,
<b>Biomedical and Environmental Sciences 22 (2) (2009) 87-94. </b>
5. Ono S., Funato T., Inoue Y., Munechika T., Yoshimura T., Morita H., Rengakuji S.,
Shimasaki C. - Determination of melamine derivatives, melame, meleme, ammeline
and ammelide by high-performance cation-exchange chromatography, Journal of
<b>Chromatography A 815 (2) (1998) 197-204. </b>
6. Yu H., Tang Y., Zhang G., Wang Z., Gao R. - A new chemiluminescence method for
determination of dicyandiamide based on the
<b>N-bromosuccinimide-merbromin-cetyltrimethylammonium bromide system, Journal of Luminescence 157 (2015) 327-332. </b>
7. United States Department of Agriculture - CLG-MEL1.01: Determination and
Confirmation of Melamine by LC/MS/MS, Effective: 12/02/2008.
8. Benvenuti M., O’Connor A. - Melamine, ammeline and cyanuric acid analysis by
UPLC/MS/MS and UPLC/PDA, Waters Corporation, USA (2007).
9. Shen Y., Han C., Zhou X., Chen X., Huang F., Zhu Z. - Microwave-assisted extraction
and determination of dicyandiamide residue in infant formula samples by liquid
<b>chromatography-tandem mass spectrometry, Journal of Dairy Science 96 (11) (2003) </b>
6877-6882.
10. Fu F., Schreiber A. - LC-MS/MS analysis of emerging food contaminants. Quantitation
and identification of dicyandiamide in milk and other protein-rich food (2013).
11. Turowski M., Deshmukh B. - Direct chromatographic method for determination of
<b>hydrogen cyanamide and dicyandiamide in aqueous solutions, Analytical Letters 37 </b>
(9) (2003) 1981-1989.
12. Kruve A., Rebane R., Kipper K., Oldekop M-L., Evard H., Herodes K., Ravio P., Leito I.
- Tutorial review on validation of liquid chromatography–mass spectrometry methods:
<b>part I, Analytica Chimica Acta 870 (2015) 29-44. </b>
13. Kruve A., Rebane R., Kipper K., Oldekop M-L., Evard H., Herodes K., Ravio P., Leito
I. - Tutorial review on validation of liquid chromatography–mass spectrometry
<b>methods: part II, Analytica Chimica Acta 870 (2015) 8-28. </b>
14. TCVN 9048:2012 (ISO/TS 15495:2010) - Milk, milk products and infant formulae -
Guidelines for the quantitative determination of melamine and cyanuric acid by liquid
chromatography - tandem mass spectrometry (LC-MS/MS).
15. Smoker M., Krynitsky A.J. - Interim method for determination of melamine and
cyanuric acid residues in foods using LC-MS/MS: Version 1.0, Laboratory
Information Bulletin LIB No.4422, U.S Food and Drug Administration, 2008.
16. Ibáñez M., Sancho J.V., Hernández F. - Determination of melamine in milk-based
products and other food and beverage products by ion-pair liquid chromatography–
<i><b>tandem mass spectrometry, Analytica Chimica Acta 649 (1) (2009) 91-97. </b></i>
17. Domenico Montesano, Oriella Gennari, Carmen Festa, Franco Zollo, Serenella Seccia,
Stefania Albrizio - A simple HPLC-DAD Method for the analysis of melamine in
protein supplements: validation using the accuracy profiles, Journal of Chemistry
<b>2013, ID 239342, 7 pages. </b>
</div>
<span class='text_page_counter'>(13)</span><div class='page_container' data-page=13>
<i>19. Joachim Weiss - Handbook of ion chromatography, Wiley-VCH Verlag GmbH & Co. </i>
KgaA (2016).
20. Srinubabu G., Raju ChA., Sarath N., Kumar P.K., Rao J.V. - Development and
validation of a HPLC method for the determination of voriconazole in pharmaceutical
<b>formulation using an experimental design, Talanta 71 (3) (2007) 1424-1429. </b>
21. Gowik P. - Criteria and requirements of commission decision 2002/657/EC, Bulletin
<b>- International Dairy Federation 383 (2003) 52-56. </b>
22. National Institute for Food Control - Evaluation of methods in chemical analysis and
microbiology analysis, Publishing House for Science & Technology, Ha Noi, 2010 (in
Vietnamese).
23. European Commission, Directorate General Health and Consumer Protection -
Guidance document on pesticide residue analytical methods, SANCO/825/00 rev.8.1
(2010).
24. ISO Guide 35:2017 - Reference materials - General and statistical principles for
certification (2017).
25. Gowik P. - Criteria and requirements of commission decision 2002/657/EC,
<b>Bulletin-International Dairy Federation 383 (2003) 52-56. </b>
26. AOAC International - Guidelines for standard method performance requirements
AOAC Official Methods of Analysis, Appendix F (2016) 1-18.
27. AOAC SMPR 2015.008 - Standard method performance requirements for alkaloids
<i>of Mitragyna speciosa, OAC International, 2015. </i>
<b>TĨM TẮT </b>
NGHIÊNCỨUXÂYDỰNGQUYTRÌNHXÁCĐỊNHHÀMLƯỢNGAMMELIDE
(AMD)VÀDICYANDIAMIDE(DCD)TRONGTHỨCĂNCHĂNNI
BẰNGSẮCKÝLỎNGHIỆUNĂNGCAOĐẦUDỊDAD(HPLC-DAD)
Đặng Văn Sử1<sub>*, Phan Thị Thanh Diệu</sub>1<sub>, Bùi Văn Tâm</sub>2
<i>1<sub>Trường Đại học Công nghiệp Thực phẩm TP.HCM </sub></i>
<i>2<sub>Trung tâm Kiểm nghiệm Thuốc Thú y Trung ương II </sub></i>
<i>*Email: </i>
Mục đích của nghiên cứu này là xây dựng quy trình xác định hàm lượng các các chất tăng
đạm giả Ammelide (AMD) và Dicyandiamide (DCD) trong thức ăn chăn nuôi (TACN), theo
quy trình chuẩn bị mẫu kết hợp với quá trình làm sạch bằng kỹ thuật chiết pha rắn (SPE) và
định lượng bằng phương pháp phân tích sắc ký lỏng hiệu năng cao đầu dò DAD (HPLC-DAD).
Hàm lượng AMD và DCD trong mẫu TACN được xác định với giới hạn định lượng LOD và
LOQ của AMD, DCD có nồng độ là 0.05 và 0.1 ppm, đáp ứng được yêu cầu của AOAC
(Association of Official Analytical Chemists) về thẩm định phương pháp và về độ nhạy, độ
lặp lại, khoảng tuyến tính để có thể ứng dụng vào thực tế. Quy trình xác định đã được áp dụng
hiệu quả tại Trung tâm Kiểm nghiệm Thuốc Thú y TW II để kiểm soát hàm lượng AMD và
DCD trong nền mẫu TACN thực tế.
</div>
<!--links-->
Improvement of nutrient removal and phosphorus recovery in the anaerobic/oxic/anoxic process combined with sludge ozonation and phosphorus adsorption
- 8
- 916
- 1


.push({});</script> </div> </div> </div> <div class="vf_link_relate px-2 my-2"> <h2 class="vf_doc_relate text-2xl font-bold my-4">Tài liệu liên quan</h2> <ul class="grid grid-cols-12 gap-2"> <li class="col-span-6 md:col-span-2"> <div class="card-doc " onclick="actionDocRelated(this)"> <a class="card-doc-img" href="https://text.123docz.net/document/559370-improvement-of-nutrient-removal-and-phosphorus-recovery-in-the-anaerobic-oxic-anoxic-process-combined-with-sludge-ozonation-and-phosphorus-adsorption.htm" title="Improvement of nutrient removal and phosphorus recovery in the anaerobic/oxic/anoxic process combined with sludge ozonation and phosphorus adsorption"> <i class="icon i_type_doc i_type_doc2"></i> <img class="lazy" src="data:image/gif;base64,R0lGODlhAQABAIAAAP///wAAACH5BAEAAAAALAAAAAABAAEAAAICRAEAOw==" data-src="https://media.store123doc.com/images/document/13/pt/sl/medium_sln1378348707.jpg" width="124" height="179" alt="Improvement of nutrient removal and phosphorus recovery in the anaerobic/oxic/anoxic process combined with sludge ozonation and phosphorus adsorption" onerror="this.src=)