Effects of different levels of biochar on methane, carbon dioxide production and digestibility of para grass (Brachiaria mutica) in in vitro incubation
Bạn đang xem bản rút gọn của tài liệu. Xem và tải ngay bản đầy đủ của tài liệu tại đây (250.27 KB, 5 trang )
<span class='text_page_counter'>(1)</span><div class='page_container' data-page=1>
<i>DOI:10.22144/ctu.jsi.2018.092 </i>
<b>Effects of different levels of biochar on methane, carbon dioxide production and </b>
<i><b>digestibility of para grass (Brachiaria mutica) in in vitro incubation</b></i>
Le Thi Thu Van
1*<sub>, Nguyen Van Thu</sub>
1<sub> and Nguyen Huu Chiem</sub>
2<i>1<sub>College of Agriculture and Appl. Biology, Can Tho University, Vietnam </sub></i>
<i>2<sub>College of Environment and Natural Resources, Can Tho University, Vietnam </sub></i>
<i>*Correspondence: Le Thi Thu Van (email: ) </i>
<b>ARTICLE INFO </b> <b> ABSTRACT </b>
<i>Received 23 May 2018 </i>
<i>Revised 12 Jul 2018 </i>
<i>Accepted 03 Aug 2018</i>
<i><b> The objectivie of this study was to evaluate adding levels of biochar on </b></i>
<i>methane, carbon dioxide and digestibility of para grass in in vitro </i>
<i>incuba-tion. The experiment was arranged in a completely randomized design with </i>
<i>three replications of five treatments which are different levels of biochar </i>
<i>added to para grass (Brachiaria mutica) at 0, 0.5, 1.0, 1.5, and 2.0%, </i>
<i>namely BC0, BC0.5, BC1, BC1.5, and BC2, respectively. The incubation </i>
<i>lasted for 72 hours with measurements of gas, methane and carbon dioxide </i>
<i>production at 0, 6, 12, 24, 48 and 72 hours. The results showed that the </i>
<i>total CH4 production (ml/g) and organic matter digestibility (%) after </i>
<i>72-hour incubation significantly decreased (P<0,05) among the treatments by </i>
<i>increase of levels of biochar with the highest values for the BC0 treatment </i>
<i>(54.8ml/g and 71.6%, respectively). It could be concluded that adding </i>
<i>bi-ochar to the para grass could reduce in vitro gas, methane and carbon </i>
<i>dioxide production up to 2.0%; however, the reduction of organic matter </i>
<i>digestibility was also found. These results supply key information for </i>
<i>ap-plication in vivo study to reduce greenhouse emissions and increase </i>
<i>rumi-nant performance. </i>
<i><b>KEYWORDS </b></i>
<i>Digestibility, greenhouse </i>
<i>emissions, incubation, </i>
<i><b>rumi-nant </b></i>
Cited as: Van, L.T.T., Thu, N.V. and Chiem, N.H., 2018. Effects of different levels of biochar on methane,
<i>carbon dioxide production and digestibility of para grass (Brachiaria mutica) in in vitro incubation. </i>
<i>Can Tho University Journal of Science. 54(Special issue: Agriculture): 34-38. </i>
<b>1 INTRODUCTION </b>
In recent years, many studies have reported that the
addition of biochar may reduce methane emissions
such as biochar reduces enteric methane and
im-proves growth and feed conversion in local
“yel-low” cattle fed cassava root chips and fresh cassava
<i>foliage (Leng el al., 2012). Biochar and leaves from </i>
<i>sweet or bitter cassava reduced in vitro gas and </i>
me-thane production using cassava root pulp as source
<i>of energy (Phanthavong el al., 2015). Biochar is a </i>
carbon-rich product that is obtained by burning
bio-bamboo, melaleuca, wood, or leaves) in an enclosed
chamber (anaerobic or less air). The purpose of this
experiment was to determine effects of adding
bio-char on methane, carbon dioxide production and
di-gestibility of para grass.
<b>2 MATERIALS AND METHODS </b>
<b>2.1 Location of this study </b>
</div>
<span class='text_page_counter'>(2)</span><div class='page_container' data-page=2>
<b>2.2 Experimental design </b>
The experiment was a completely randomized
de-sign with five treatments and three replications. The
treatments were the level of 0, 0.5, 1.0, 1.5, and
<i>2.0% of biochar added to para grass (Brachiaria </i>
<i>mu-tica) corresponding to the BC0, BC0.5, BC1, BC1.5 </i>
and BC2 treatment.
<b>Table 1: Ingredients in the substrate (g dry matter basis) of treatments </b>
<b>Feed </b> <b>Treatments </b>
<b>BC0 </b> <b>BC0.5 </b> <b>BC1.0 </b> <b>BC1.5 </b> <b>BC2.0 </b>
Para grass 0.2 0.2 0.2 0.2 0.2
Biochar 0 0.001 0.002 0.003 0.004
<b>2.3 Materials and methods </b>
<i>In vitro gas production was done following the </i>
<i>pro-cedure described by Menke el al. (1979). The para </i>
grass was cut into small pieces, about 1 cm of
length, and then dried at 65°C during 24 hours, then
ground through 1 mm seive. Representative samples
(0.2 gDM of para grass) were put into the incubation
50-ml syringes, which were added buffer solution
and cattle rumen fluid, prior to filling each bottle
with carbon dioxide following the method described
<i>by Menke el al. (1979). Then, the syringes were put </i>
in the water bath at 39o<sub>C. Gas, CH</sub>
4 and CO2
vol-umes over time (0, 6, 12, 24, 48 and 72 hours) were
recorded, while the CH4 and CO2 concentrations
were measured by the Biogas 5000 Geotechnical
In-struments (UK) Ltd, England. Unfermented solids at
24, 48 and 72 hours were determined by filtering
through two layers of cloth and drying at 105°C for
24 hours and ashing for 5 hours to measure the dry
matter digestibility (DMD) and organic matter
di-gestibility (OMD), respectively.The biochar used in
the experiment was made from by burning rice husk
with the anaerobic condition at 500o<sub>C by Electronic </sub>
furnace VMF-165, Yamada Denki Co. Ltd., Japan
at College of Environment and Natural Resources,
Can Tho University.
The ingredients in the substrate were analysed for
dry matter (DM), organic matter (OM), crude
pro-tein (CP), ether extract (EE), crude fiber (CF) and
ash according to the standard methods of AOAC
(1990), while neutral detergent fiber (NDF) and acid
detergent fiber (ADF) content were analyzed
<i>fol-lowing procedures suggested by van Soest el al. </i>
(1991).
The measurements of the experiment were gas, CH4
and CO2 production; OMD at 0, 6, 12, 24, 48 and 72
hours. The experiment data were analyzed through
ANOVA (with general linear model) and Tukey test
(with Minitab 2010 software).
<b>3 RESULTS AND DISCUSSION </b>
<b>3.1 Chemical composition of materials </b>
The chemical composition of feeds was presented in
Table 2.
<b>Table 2. Chemical composition (%) of feeds used in the experiment </b>
<b>Feed </b> <b>DM</b> <b>OM </b> <b>CP </b> <b>EE </b> <b>NFE </b> <b>CF </b> <b>NDF </b> <b>ADF </b> <b>Ash </b>
Para grass 95.2 88.5 11.0 3.52 45.1 28.8 64.8 32.7 11.5
Biochar 99.6 64.3 2.53 1.90 2.87 57.0 62.9 64.4 35.7
<i>DM: dry matter, OM: organic matter, CP: crude protein, EE: ether extract, CF: crude fiber, NFE: nitrogen free extract, </i>
<i>NDF: neutral detergent fiber, ADF: acid detergent fiber. </i>
Table 2 showed that para grass had dry matter (DM)
content (95.2%) and the crude protein (CP) content
(11.0%) that were lower than those of Tran Thi Dep
<i>(2012) and Nguyen Thi Thu Hong el al. (2008) were </i>
12.8% because Para grass used in the experiment
was harvested in the dry season, it had a high DM
content, but low CP content. Biochar had high ash
with the content of 35.7%.
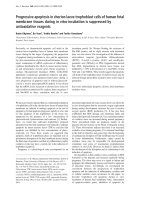
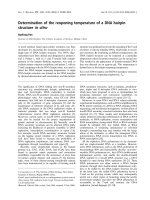
<i><b>3.2 In vitro gas production </b></i>
The in vitro gas production was presented in Fig. 1.
In general, the total accumulated gas increased with
</div>
<span class='text_page_counter'>(3)</span><div class='page_container' data-page=3>
<b>Fig. 1: In vitro gas production as affected by different levels of biochar over incubation times </b>
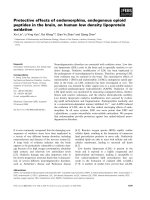
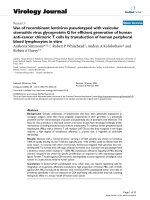
<i>In vitro CH</i>4 and CO2 production and OMD was
showed in Fig. 2 and Table 3.
<i>The In vitro methane production of different </i>
treatments was generally similar in development
patterns with the higher values for the BC0
treat-ment (Fig. 2) and the lower values for the BC2,
par-ticularly from 60 to 72 hours (P<0.05).
<b>Fig. 2: In vitro methane production as affected by different levels of biochar over incubation times </b>
<b>Table 3: Gas, CH4 and CO2 production (ml), DM and OMD (%) in different treatments at 72 hours in </b>
<b>the experiment </b>
<b>Item </b> <b>Treatment </b> <b>+SE </b> <b>P </b>
<b>BC0 </b> <b>BC0.5 </b> <b>BC1.0 </b> <b>BC1.5 </b> <b>BC2.0 </b>
Gas, ml 58,2a <sub>52,6</sub>b <sub>52,4</sub>b <sub>52,0</sub>b <sub>51,8</sub>b <sub>1,233 </sub> <sub>0,001 </sub>
CH4, ml 10,1a 9,08b 8,88bc 8,75bc 8,34c 0,244 0,001
CO2, ml 31,2a 28,2b 27,8b 27,4b 26,7b 0,667 0,001
DMD,% 69,5a <sub>62,6</sub>b <sub>62,2</sub>b <sub>61,5</sub>b <sub>60,5</sub>b <sub>1,239 </sub> <sub>0,001 </sub>
OMD,% 71,6a <sub>65,4</sub>b <sub>63,5</sub>b <sub>63,3</sub>b <sub>62,5</sub>b <sub>1,295 </sub> <sub>0,001 </sub>
Gas, ml/gOM 316a <sub>285</sub>b <sub>284</sub>b <sub>282</sub>b <sub>281</sub>b <sub>6,685 </sub> <sub>0,001 </sub>
Gas, ml/gDOM 441 436 448 446 450 8,716 0,329
CH4, ml/gOM 54,8a 49,3b 48,2bc 47,5bc 45,2c 1,324 0,001
CH4, ml/gDOM 76,5 75,4 75,9 75,0 72.4 1,563 0,069
CO2, ml/gOM 169a 153b 151b 149b 145b 3,617 0,001
CO2, ml/gDOM 236 234 238 235 232 5,480 0,796
</div>
<span class='text_page_counter'>(4)</span><div class='page_container' data-page=4>
<i>from the BC0 to the BC2 treatment. However, the in </i>
<i>vitro DM and OMD values were also reduced </i>
(P<0.05) from the BC0 to the BC2 treatment with
the lowest value of OMD for the BC2 treatment
(62.5%) compared to that of the BC0 treatment
(71.6%). The results were higher than those
<i>(ml/gOM) reported by Nguyen Van Thu el al. </i>
(2016) studying on ground maize being 222 (gas)
and 33.3 (CH4). Generally, the greenhouse
produc-tion and OMD were reduced when increasing the
bi-ochar levels from 0 to 2.0%.<i>Leng el al. (2012) </i>
as-serted that adding 1% biochar to diets reduced
11-13% of methane production; however, increasing
the amount of biochar by 2% to 5% did not reduce
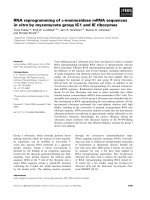
methane production. The linear relationship of
lev-els of biochar (%) and methane production (ml/g
OM) is high, when the biochar rate increases, the
methane production decreases linearly with R2 <sub>= </sub>
0.772 with the y = - 4.19 + 53.2 (Fig. 3).
<i><b>Fig 3: Linear relationship between biochar (%) and in vitro methane production </b></i>
The accumulated gas, CH4 and CO2 production
(ml/g DOM) in the experiment was not significantly
different among the treatments at 72 hours. The
re-sults of gas and methane production (ml/g DOM)
were similar to those reported at 72 hours by
Ngu-yen Ngoc Duc An Nhu (2016) studying with only
para grass (462 and 88.8, respectively) and Huynh
Doan Nghich Luy (2016) studying with para grass
supplemented probiotics (469 and 97.3,
respec-tively).
<b>4 CONCLUSION AND RECOMMENDATION </b>
<i>It was concluded that the in vitro gas, CH</i>4 and CO2
production (ml/g OM) was gradually reduced by
in-creasing levels of biochar to the substrate of para
grass from 0 to 2.0%. At 72 hours, methane
produc-tion (ml/g OM) was reduced from 10 to 17.5% when
adding 0.5 – 2 % of biochar compared to no biochar
addition. However, a gradual reduction of DM and
OMD when increasing biochar levels has been
<i>found in this study. The in vivo experiments on </i>
ru-minants with biochar in the diets should be
imple-mented to confirm the results for a potential
appli-cation.
<b>REFERENCES </b>
AOAC, 1990. Official Methods of Analysis (15th
edi-tion). Association of Official Analytical Chemists.
Washington, DC. Volume 1: 69-90.
Huynh Doan Nghich Luy, 2016.Effects of probiotics on
<i>in vitro gas production with substrates of para grass </i>
by using syringes system. Graduation thesis of
Animal Husbandry Engineer, College of Agriculture
and Appl. Biology, Can Tho University (in
Vietnam-ese).
Nguyen Ngoc Duc An Nhu, 2016. Effects of
<i>carbohy-drates and crude protein on in vitro gas production </i>
with substrates of para grass by using syringes
sys-tem.Master of Science thesis in agricultural sciences:
Animal Husbandry. Can Tho University, Vietnam (in
Vietnamese).
Nguyen Thi Thu Hong, Vo Ai Quac, Tran Thi Kim
Chung, Bach Van Hiet, Nguyen Thanh Mong and
<i>Phan The Huu, 2008. Mimosa pigra for growing </i>
<i>goats in the Mekong delta of Vietnam. Livestock </i>
<i>Re-search for Rural Development. 20(12): 1-7. </i>
Nguyen Van Thu, Nguyen Thi Kim Dong and Keisuke,
H., 2016. A study of in vitro CH4 and CO2 effected by
</div>
<span class='text_page_counter'>(5)</span><div class='page_container' data-page=5>
Leng, R. A., Preston, T. R. and Inthapanya, S., 2012.
Bio-char reduces enteric methane and improves growth
and feed conversion in local “Yellow” cattle fed
<i>cas-sava root chips and fresh cascas-sava foliage. Livestock </i>
<i>Research for Rural Development, 24(1): article #199. </i>
Menke, K.H., Raab, L., Salewski, A., Steingass, H.,
Fritz, D. and Schneider, W., 1979. The estimation of
the digestibility and metabolizable energy content of
ruminant feedingstuffs from the gas production when
<i>they are incubated with rumen liquor in vitro. </i>
Jour-nal of Agricultural Science, 93(1): 217-222.
Minitab, 2010. Minitab reference manual release 16.2.0,
Minitab Inc.
<i>Phanthavong, V., Viengsakoun, N., Inthapanya, S. and </i>
<i>Preston, T.R., 2015. Effect of biochar and leaves </i>
from sweet or bitter cassava on gas and methane
<i>pro-duction in an in vitro rumen incubation using cassava </i>
<i>root pulp as source of energy. Livestock Research for </i>
<i>Rural Development. Volume 27. </i>
Preston, T.R. and Leng, R.A., 1987. Matching ruminant
production systems with available resources in the
tropics and sub-tropics. Penambul Books. Armidale,
Australia, 265 pages.
Tran Thi Dep, 2012. Preliminary results of studying in
vitro greenhouse gas production of ruminant feeds in
the Mekong delta. Graduate thesis. Can Tho
Univer-sity (in Vietnamese).
</div>
<!--links-->