Determinants of income diversification and its effects on rural household income in Vietnam
Bạn đang xem bản rút gọn của tài liệu. Xem và tải ngay bản đầy đủ của tài liệu tại đây (5.78 MB, 10 trang )
<span class='text_page_counter'>(1)</span><div class='page_container' data-page=1>
<i>DOI: 10.22144/ctu.jen.2017.039 </i>
<b>Determinants of income diversification and its effects on rural household income in </b>
<b>Vietnam </b>
Ho Thi Ngoc Diep1<sub>, Ha Thuc Vien</sub>2
<i>1<sub>University of Economics Ho Chi Minh City, Vietnam </sub></i>
<i>2<b><sub>Vietnamese - German University, Vietnam </sub></b></i>
<b>Article info. </b> <b>ABSTRACT </b>
<i>Received 25 May 2016 </i>
<i>Revised 10 Jul 2016 </i>
<i>Accepted 29 Jul 2017</i>
<i>This article is aimed at examining determinants of income </i>
<i>tion among rural households in Vietnam and the impacts of </i>
<i>diversifica-tion on household income. The Poisson and Tobit regression methods </i>
<i>were applied. The data for this empirical study was detached from </i>
<i>Vi-etnam Household Living Standard Surveys (VHLSS) conducted from </i>
<i>2002 to 2010. The regression results showed that socio-economic </i>
<i>fac-tors have strong influence on household income diversification in the </i>
<i>rural areas, and, in turn, income diversification has positive impact on </i>
<i>household income growth. It implied that income diversification is an </i>
<i>important strategy to improve househo </i>
<i><b>Keywords </b></i>
<i>Determinants, impacts, </i>
<i>income diversification, </i>
<i>Poisson, Tobit, VHLSS, </i>
<i>Vietnam </i>
Cited as: Diep, H.T.N., Vien, H.T., 2017. Determinants of income diversification and its effects on rural
<i>household income in Vietnam. Can Tho University Journal of Science. Vol 6: 153-162. </i>
<b>1 INTRODUCTION </b>
Income diversification among rural households in
developing countries has been grown to become a
common phenomenon. There are several motives
for households to diversify their income: to manage
risks, to secure a smooth flow of income, to
allo-cate the surplus labor or to respond to different
kinds of market failures such as insurance and
credit market imperfection (Ellis, 1998). Hence, it
has become a critical topic which is paid
substan-tial attention by development economists and
poli-cy makers.
Given the potential role of income diversification
in stabilizing and improving household income as
well as alleviating rural poverty, governments in
developing countries have increasingly been
inter-ested in promoting diversification. Vietnam with
70% of the population lives in rural areas is not an
exception. Since 1986, the Government launched
economic reform with an aim of promoting
</div>
<span class='text_page_counter'>(2)</span><div class='page_container' data-page=2>
inves-tigating factors determining the ability to carry out
household income diversification and to measure
the impacts of diversification on household income
so as to draw some policy recommendations to
support the development of rural areas in Vietnam.
<b>2 METHODOLOGY </b>
<b>2.1 Conceptual framework </b>
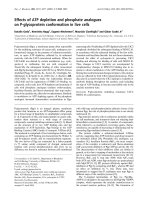
This study was based on Sustainable Livelihood
<b>Framework (SLF) (Figure 1) in which people are </b>
put at the centre of a variety of factors with
inter-relationship that influence them to create
liveli-hoods. Among these factors, the livelihood assets
that they can access to and use play a very
important role. These assets include natural capital,
physical capital, human capital, social capital and
financial capital. However, the extent to which they
can access these assets is strongly determined by
their contexts in the form of trends (e.g., economy,
politics) or shocks (e.g., natural disasters).
Moreo-ver, other social, institutional and political
envi-ronments all have certain effects on the ways
peo-ple access and use their assets to achieve their
<i>goals, which are known as livelihood strategies. </i>
Livelihood diversification is one of the strategies
that enable households to increase their income,
minimize the income fluctuations, and hence,
im-prove their livelihood.
<b>Fig. 1: The Sustainable Livelihood Framework (Scoones, 1998:4) </b>
The impacts of the mentioned assets on household
income diversification have been reflected in
em-pirical studies across countries. Barrett and
Rear-don (2001) pointed out in most of studies on
in-come diversification that better education has
im-portant effects on non-farm earnings. Studies in
Tanzania, Lanjouw and Feder (2001) found that a
</div>
<span class='text_page_counter'>(3)</span><div class='page_container' data-page=3>
in other developing economies also proved for the
significance of these factors. For instance, access to
public assets (e.g., roads, electricity, water), private
assets (e.g., education) and access to credit were
also pointed out as factors that affect the
house-holds’ ability and their extent to participate into
income diversification (Escobal, 2001; Babatunde
and Qaim, 2009).
Regarding to the influence of diversification on
household income, the positive relationship
be-tween income diversification and household
wel-fare has been found by a variety of empirical
stud-ies. Babatunde and Qaim (2009) pointed out in a
study in Nigeria that income diversification has
positive and significant impact on household
in-come regardless of the diversification measures
used. In Zimbabwe, Ersado (2003) employed the
number of income sources, the share of nonfarm
income, and the Simpson index as measures of
income diversification to study the relationship
between diversification and household welfare.
The author found that in rural areas, richer
house-holds are more diversified in income sources, while
the result is in the opposite way in urban areas.
Ersado (2003) also figured out in rural areas with
high variability in rainfall, households tend to have
more number of income sources.
Based on the relevant literature and empirical
stud-ies, this work would empirically examine the
de-terminants that significantly influence the income
diversification among households in rural Vietnam
and then impacts of income diversification on
household income.
<b>2.2 Data sources </b>
The data was derived from a set of Vietnam
Household Living Standard Surveys (VHLSS)
car-ried out in 2002, 2004, 2008 and 2010 with an aim
of examining the changes in income sources and
the contribution of each income source to
house-hold income.
In order to identify the factors influencing the
in-come diversification of households and study the
relationship between income diversification and the
household income, the study used the cross -
sec-tional data set of the VHLSS 2008. It was
conduct-ed nation-wide with a sample size of 45,945
households (36,756 households in the income
sur-vey and 9,189 households sursur-veyed on both
in-come and expenditure). As the research focusing
on examination of the income diversification in
rural Vietnam, only the surveys of 6,837
house-holds in rural areas were selected.
<b>2.3 Data analysis methods </b>
A variety of methods used to analyze the data,
in-cluding the descriptive statistics and the
economet-ric method. Firstly, the descriptive statistics tool
was used to portrait the income diversification
pat-terns over time as well as its patpat-terns across
differ-ent types of households and geographical regions
by comparing the measures of diversification from
the surveys of different years. Secondly, the
econ-ometric method was deployed to identify the
de-terminants of income diversification among
house-holds and examine its effects on household income
based on the data of the VHLSS 2008. For the
analysis of determinants, the regression of three
measures of diversification was applied, including
number of income sources (NIS), the Simpson
in-dex of diversity (SID) and non-farm income share
(NFS) on a set of independent variables
represent-ing for household assets. As the dependent variable
was in form of count data in the NIS model, the
Poisson regression was used. For SID and NFS
measures, the data was censored between zero and
one, hence, the Tobit regression employed, which
was similarly employed by Escobal (2001) to
ex-amine the determinants of income diversification in
rural Peru. Schwarze and Zeller (2005) is another
example to use the Tobit model in similar settings.
In order to analyze the impacts of income
diversifi-cation on household income, the three models were
used, in which the household income was the
de-pendent variable, and the diversification measures
were added to the set of explanatory variables. In
order to avoid the problem of endogeneity, the
in-strumental variables (IV) method - two stage least
squares (2SLS) was used in the analysis of the
im-pacts of income diversification on household
in-come. The three models are summarized as
fol-lows:
Y1 = f (NIS, ethnicity, age, gender, dep_ratio,
elec-tric, tapwater, market_dis, road_dis, road_pass1<sub>) </sub>
Y2 = f (NFS, ethnicity, age, gender, dep_ratio,
elec-tric, tapwater, market_dis, road_dis, road_pass)
Y3 = f (SID, ethnicity, age, gender, dep_ratio,
elec-tric, tapwater, market_dis, road_dis, road_pass)
In which:
<i>1<sub> Ethnicity: Kinh household head; age: Age of household </sub></i>
</div>
<span class='text_page_counter'>(4)</span><div class='page_container' data-page=4>
Y1, Y2, Y3 are household’s total income in model
1, model 2, model 3, respectively
NIS, NFS, SID are income diversification
measures, which are considered endogenous
varia-bles with the instrumental variavaria-bles: education,
credit and household size. The other variables in
the three equations are all exogenous variables.
<b>3 RESULTS </b>
<b>3.1 Patterns and trends in income </b>
<b>diversification </b>
<i>3.1.1 Diversity of income sources </i>
According to VHLSS, household income is divided
in 8 categories: wage, crop, livestock, fishery,
for-estry, enterprise, transfer and other income. Table 1
shows the trends in income diversity among rural
households across regions by two measures: NIS
and SID. Households in rural areas tend to obtain
their income from a variety of sources. These
fig-ures reflect a modest increase in the number of
income sources between 2004 and 2002 before a
gradual decline in the next two periods in 2006 and
2008. The level of diversity increases again, with
an average number of income sources go up from
3.57 in 2008 to 4.36 in 2010. This trend happens to
all geographical and economic regions.
Among different regions, Northeast and Northwest
are found to be most diverse while Southeast is
least diverse in income sources, as shown by most
of indicators in almost of all years of surveys. As
Northeast and Northwest are the poorest regions in
Vietnam and Southeast is most urbanized and least
poor, the phenomenon may be explained that the
poorest households tend to have higher level of
diversity in income. Similarly, both indicators NIS
and SID increasing along with the level of poverty
of households in every single year showing that
poorer households have a tendency to diversify
their income sources more than the richer ones.
While this contradicts the results by Abdulai and
Crole-Rees (2001) for Mali, it is in consistent with
the findings by Schwarze and Zeller (2005) for
rural Indonesia. The fact that the income
diversifi-cation is higher among poorer than richer
house-holds supports the idea that diversification is a
mean to reduce risks related to the variation in
in-come from each source.
<b>Table 1: Diversity of income sources by regions across years </b>
<b>Region </b> <b>Number of income sources (NIS) </b> <b> Simpson index of diversity (SID) </b>
<b>2002 </b> <b>2004 </b> <b>2006 </b> <b>2008 2010 </b> <b>2002 </b> <b>2004 </b> <b>2006 </b> <b>2008 2010 </b>
Red River Delta 3.91 4.30 4.05 3.30 4.18 0.51 0.53 0.51 0.43 0.47
North East 4.60 4.86 4.79 3.81 4.80 0.58 0.59 0.58 0.47 0.51
North West 4.80 5.16 4.84 4.44 5.18 0.53 0.56 0.56 0.44 0.49
North Central Coast 4.11 4.45 4.26 3.41 4.62 0.53 0.54 0.53 0.46 0.50
South Central Coast 3.99 4.32 3.99 3.48 4.38 0.49 0.50 0.47 0.41 0.47
Central Highlands 4.65 4.69 4.32 3.57 4.39 0.48 0.46 0.44 0.38 0.40
Southeast 3.60 3.53 3.30 3.03 3.30 0.40 0.40 0.37 0.34 0.31
Mekong River Delta 3.87 4.08 3.80 3.51 4.02 0.42 0.43 0.42 0.37 0.39
<b>Average2</b> <b><sub>4.19 </sub></b> <b><sub>4.42 </sub></b> <b><sub>4.17 </sub></b> <b><sub>3.57 4.36 </sub></b> <b><sub>0.49 </sub></b> <b><sub>0.50 </sub></b> <b><sub>0.49 </sub></b> <b><sub>0.41 0.44 </sub></b>
<i>(Source: Statistical analysis of VHLSS 2002, 2004, 2006, 2008 and 2010) </i>
<i>2<sub> NIS, NFS, SID are income diversification measures, which are considered endogenous variables with the instrumental </sub></i>
</div>
<span class='text_page_counter'>(5)</span><div class='page_container' data-page=5>
Considering not only the number of income
sources, but also the balance among them, the SID
shows the similar result in portraying the tendency
of income diversification among rural households
in Vietnam as well as most of its different regions
(Table 1).
Regionally, the Northeast and Northwest are found
to be most diverse while Southeast is least diverse
in income sources, as shown by most of indicators
across surveys. As the Northeast and Northwest are
the poorest regions in Vietnam while the Southeast
is the richest, the phenomenon may be explained
that the poorest households tend to have higher
level of diversity in income. Similarly, both
indica-tors NIS and SID increasing along with the level of
poverty of households in every single year showing
that poorer households have a tendency to diversify
their income sources more than the richer ones.
While this contradicts the results by Abdulai and
Crole-Rees (2001) for Mali, it is in consistent with
the findings by Schwarze and Zeller (2005) for
rural Indonesia. The fact that the income
diversifi-cation is higher among poorer than richer
house-holds supports the idea that diversification is a
mean to reduce risks related to the variation in
in-come from each source.
<i>3.1.2 Diversification as a shift to non-farm </i>
<i>activities </i>
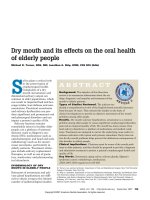
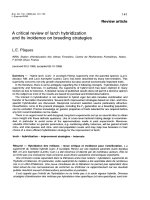
Despite the dominant importance of agriculture
(including crop, livestock, fishery, forestry), Figure
2 shows that there is a marked increase in the share
of income deriving from non-farm activities in
household income over time, from 27.40% in 2002
to 30.90%, 33.00%, 35.60% and 37.10% in 2004,
2006, 2008 and 2010, respectively. This indicates
the growing importance of non-agricultural sector,
in line with the gradual structural transformation of
the economy.
<i> </i>
<b>Fig. 2: Share of nonfarm income in rural household income </b>
<i>(Source: Statistical analysis of VHLSS 2002, 2004, 2006, 2008 and 2010) </i>
The growing importance of income generating
from non-agricultural or non-farm activities to
household income occurs to all groups of
house-holds from different income quintiles, though it
varies in level and speed. As shown in Table 2, the
share of non-farm income in household income is
lower for the poorer than the richer. According to
the VHLSS 2002, the non-farm income share of the
fifth quintile (the richest) is 40.80% while this
number is only 15.40% among the first quintile
(the poorest). During the period from 2002 to 2008,
all income groups experience the increase in the
share of income from outside agriculture to reach
23.10%, 35.00%, 38.90%, 42.60% and 44.80%,
respectively for the five groups of income from the
poorest to the richest. However, in 2010, the
poor-est group decreased 5.70% in non-farm income
share to 17.40%. Similarly, there is a slight decline
of 1.90% in the amount for the second quintile.
Whereas, this share among the other three groups
goes up sharply at 4.80%, 8.70% and 10.10% to
27,4%
30,9% 33,0%
35,6% 37,1%
13,3%
17,9% 19,8%
22,1%
24,7%
14,0%
13,0% 13,1% 13,5%
12,4%
0,0%
5,0%
10,0%
15,0%
20,0%
25,0%
30,0%
35,0%
40,0%
2002 2004 2006 2008 2010
<b>percent</b>
</div>
<span class='text_page_counter'>(6)</span><div class='page_container' data-page=6>
reach 43.70%, 51.30%, 54.90% for the third, the
fourth and the fifth group respectively.
Overall, rural households tend to be more
diversi-fied in terms of non-farm income share in
house-hold income over time. The level of diversity is
varied among different groups of income quintile,
which is much lower for the poor compared to the
rich. This may be explained by the fact that the
poor face more constraints in participating in
non-farm activities than the rich.
<b>Table 2: Share of non-farm income in household income by income quintiles across years </b>
<b>Income quintile </b> <b><sub>2002 </sub></b> <b>Share of non-farm income (%) <sub>2004 </sub></b> <b><sub>2006 </sub></b> <b><sub>2008 </sub></b> <b><sub>2010 </sub></b>
Quintile 1 (Poorest) 15.40 17.90 21.20 23.10 17.40
Quintile 2 23.90 30.00 32.00 35.00 33.10
Quintile 3 30.10 34.90 36.10 38.90 43.70
Quintile 4 36.00 38.50 40.40 42.60 51.30
Quintile 5 (Richest) 40.80 41.50 42.50 44.80 54.90
Average 27.40 30.90 33.00 35.60 37.10
<i>(Source: Statistical analysis of VHLSS 2002, 2004, 2006, 2008 and 2010) </i>
<i>3.1.3 Diversification as commercialization of </i>
<i>production </i>
Generally, the degree of commercialization among
rural households increases gradually over time. The
share of crop output that is marketed of rural
households in the country as a whole rises from
61.7% in 2002 to 67.60% in 2010 (Table 3).
<b>Table 3: Measure of commercialization by income quintile across years </b>
<b>Income quintile </b> <b>Share of crop output sold (%) </b> <b>Share of agri. output sold (%) </b>
<b>2002 </b> <b>2004 </b> <b>2006 </b> <b>2008 </b> <b>2010 </b> <b>2002 2004 </b> <b>2006 2008 2010 </b>
Quintile 1 (Poorest) 43.00 45.40 42.50 45.50 41.70 54.30 55.20 51.40 53.40 47.90
Quintile 2 54.00 56.90 53.60 58.60 59.10 65.20 67.30 63.30 66.20 64.70
Quintile 3 62.60 66.40 66.20 67.50 65.90 72.30 74.80 72.90 74.30 71.50
Quintile 4 71.20 72.10 73.10 77.60 74.70 79.50 80.80 80.70 82.60 81.00
Quintile 5 (Richest) 80.20 85.30 86.00 82.40 87.80 86.60 88.50 89.60 86.50 80.50
Average 61.70 65.00 65.00 67.30 67.60 71.80 73.80 73.30 74.10 71.80
<i>(Source: Statistical analysis of VHLSS 2002, 2004, 2006, 2008 and 2010) </i>
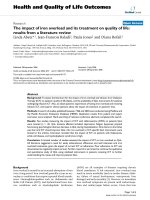
As shown in Figure 3, among different
geograph-ical regions, the Northeast has a very small share of
crop output that is sold or bartered, accounting for
only 30.60% in 2002 and 24.90% in 2010. The
other areas having relatively low commercial share
of crop production include the North Central Coast,
the Northwest and the Red River Delta, with just
38.70%, 40.20% and 41.40%, respectively. In
con-trast, the marketed proportion of crop products is
more than 80.00% for the Central Highlands, the
Mekong Delta and the Southeast regions. This
con-sequence is strongly influenced by market
accessi-bility, economic development and local conditions.
Considering the agricultural commercialization
across different income categories, it is clear that
the richer are more commercialized than the
poor-er. According to VHLSS 2010, the share of crop
output and agricultural output that is marketed of
the highest income level is 87.80% and 80.50%
while this figure for the lowest income level is just
41.70% and 47.90% (Table 3).
</div>
<span class='text_page_counter'>(7)</span><div class='page_container' data-page=7>
<b>Fig. 3: Share of output sold or bartered by region and year </b>
<i>(Source: Statistical analysis of VHLSS 2002, 2004, 2006, 2008 and 2010)</i>
<i>3.1.4 Determinants of income diversification </i>
<b>Table 4 shows the analysis results regarding to </b>
determinants of different indicators of income
di-versification. Independent variables, education,
household size, farm size and access to electricity
have the consistent positive influence on all of the
three measures of diversification in question.
Edu-cation is the proxy of human capital which is very
important in taking up complicated wage-earning
jobs as well as self-managing business. Education
also broadens the opportunity of households in
pursuing various activities to earn income, hence,
having the positive impact on the number of
in-come sources and also helps to gain the balance
among different income sources. Household size is
an indicator of labor available for production and
taking part in non-farm activities such as non-farm
wage job. Households headed by Kinh people tend
to specialize more in non-farm activities while
households headed by minority people are likely to
stretch to more activities for income earning and to
maintain the balance among these income sources.
Age of household head which stands for experience
and management skills is positively correlated with
the number of income sources and the SID, and
therefore not much concentrating on the non-farm
activities. The location such as the distance to a car
road and the period that a road is passable
signifi-cantly affect the level of diversity into non-farm
activities. The distance of the settlement from a car
road has negative effect on a number of income
sources as well as SID due to higher transaction
cost and transportation cost. Access to formal
cred-it enables households to diversify their income
sources and gain the balance among these sources.
Nevertheless, it has negative relation with the share
of non-farm income, which suggests that rural
household tend to use the credit investing into
agri-cultural production like livestock, fishing and
for-estry, etc. rather than into non-farm business.
Considering the income diversification across
dif-ferent groups of income, it is found that the rich
have higher share of their income generating from
non-farm activities than the poor. The richest group
of households earns 21.60 percent points more
from non-farm activities than the poorest group,
holding other variables constant. This means that
household economic transformation is closely
linked with income growth and economic
devel-opment.
0 20 40 60 80 100
Red River Delta
North East
North West
North Central Coast
South Central Coast
Central Highlands
Southeast
Mekong River Delta
Vietnam
<b>Share of crop output sold (%)</b>
</div>
<span class='text_page_counter'>(8)</span><div class='page_container' data-page=8>
<b>Table 4: Determinants of income diversification </b>
<b>NIS </b> <b>SID (1<sub>) </sub></b> <b><sub>NFS (</sub>2<sub>) </sub></b>
<b>Marginal </b>
<b>effect </b>
<b>Std. </b>
<b>Err. </b>
<b>Marginal </b>
<b>effect </b> <b>Std. Err. </b>
<b>Marginal </b>
<b>effect </b>
<b>Std. </b>
<b>Err. </b>
Kinh household head (Ethnicity) -0.4431*** 0.0492 -0.0520*** 0.009 0.1578*** 0.0214
Age of household head (Age) 0.0040*** 0.0011 0.0017*** 0.0002 -0.0044*** 0.0005
Male household head (gender) 0.1599*** 0.0377 0.0256*** 0.007 -0.0519*** 0.0159
Average education of members
in household (education) 0.0121* 0.0067 0.0021* 0.0013 0.0210*** 0.0029
Household size (hhsize) 0.0884*** 0.0095 0.0027 0.0018 0.0521*** 0.0042
Dependency ratio (dep_ratio) -0.0371 0.0231 -0.0013 0.0042 -0.0017 0.0099
Farm_size 0.0000 0.0000 0.0000** 0 0.0000*** 0
Access to electricity (electric) 0.0308 0.0748 0.0230* 0.0125 0.0802** 0.0324
Access to tap water (tapwater) -0.1900*** 0.0484 -0.0279*** 0.0092 0.1010*** 0.0192
Distance to a daily market
(market_dis) 0.0137*** 0.0021 0.0002 0.0004 -0.0037*** 0.001
Distance to a car road (road_dis) -0.0126* 0.0065 -0.0023* 0.0013 -0.0102** 0.0043
Period that a road is passable
(road_pass) 0.0071 0.0074 0.0014 0.0012 0.0065** 0.0031
Access to formal credit (credit) 0.1817*** 0.0279 0.0278*** 0.0052 -0.0264** 0.0116
<b>Geographical regions </b>
North East 0.0810 0.0516 0.0059 0.0091 -0.0857*** 0.0201
North West 0.3207*** 0.0798 -0.0354** 0.014 -0.0921*** 0.0311
North Central Coast 0.0498 0.0460 0.0189** 0.0085 -0.2062*** 0.0194
South Central Coast 0.1397*** 0.0524 -0.0202** 0.0103 -0.0422** 0.0214
Central Highlands -0.1381** 0.0638 -0.0792*** 0.0125 -0.3267*** 0.0303
Southeast -0.3993*** 0.0501 -0.0958*** 0.0106 -0.0684*** 0.023
Mekong River Delta 0.1347*** 0.0474 -0.0590*** 0.0089 -0.1497*** 0.0201
<b>Income quintile 2008 </b>
Income quintile 2 0.0764* 0.0405 0.0027 0.0074 0.0926*** 0.0177
Income quintile 3 0.0098 0.0443 -0.0035 0.0082 0.1393*** 0.0191
Income quintile 4 -0.0319 0.0473 -0.0175* 0.0091 0.1688*** 0.0207
Income quintile 5 -0.0597 0.0588 -0.0101 0.011 0.2160*** 0.0237
_cons 2.3453 0.0000 0.3284 0.0253 -0.0295 0.0601
N 6058 6058 6058
R2 <sub>0.0138 </sub> <sub>0.2416 </sub> <sub>0.1672 </sub>
F – statistics 973.22 19.69 68.15
<i>Note: *, **, *** Coefficients are significant at the 10%, 5%, 1% level respectively </i>
<i>(1) 91 left-censored observations at SID<=0; 5967 uncensored observations; 0 right-censored observations at SID>=1; </i>
<i>(2) 1826 left-censored observations at NFS<=0; 4182 uncensored observations; 50 right-censored observations at </i>
<i>NFS>=1 </i>
<i>(Source: Statistical analysis of VHLSS 2008) </i>
<b>3.2 Impacts of income diversification on </b>
<b>household income </b>
The regression results in Table 5 show that all of
the three diversification measures have significant
and positive impact on household income.
Specifi-cally, each additional source of income increases
household income by 32,977,000 VND on average,
holding other variables constant (column 1).
Col-umn (2) and (3) show that an increase of 10 percent
in the share of non-farm income will bring
</div>
<span class='text_page_counter'>(9)</span><div class='page_container' data-page=9>
<b>Table 5: Impacts of income diversification on total income of household </b>
Variable <b>Total income </b>
<b>(1) </b> <b>(2) </b> <b>(3) </b>
NIS 47,877*** <sub>(5,422) </sub>
NFS 1,763*** <sub>(162) </sub>
SID 141,279*** <sub>(44,585) </sub>
Kinh ethnicity of household head (ethnicity) 28,904*** <sub>(3,583) </sub> -14,636*** <sub>(3,494) </sub> 13,221*** <sub>(3,073) </sub>
Age of household head -264*** <sub>(72) </sub> 407*** <sub>(82) </sub> -260*** <sub>(85) </sub>
Male household head (gender) <sub>(2,360) </sub>-3,498 9,672*** <sub>(2,354) </sub> <sub>(2,159) </sub>3,484
Dependency ratio (dep_ratio) 2,637* 2,749** 1,582
(1,378) (1,316) (1,124)
Farm_size 0.34** <sub>(0.16) </sub> 0.95*** <sub>(0.16) </sub> 0.50*** <sub>(0.15) </sub>
Access to electricity (electric) 3,370 -5,918* 1,231
(4,388) (3,477) (3,287)
Access to tap water (tapwater) 8,201*** <sub>(2,932) </sub> -16,301*** <sub>(3,594) </sub> <sub>(2,710) </sub>4,615*
Distance to a daily market (market_dis) -767*** 529** -31
(222) (208) (174)
Distance to a car road (road_dis) 1,039* <sub>(552) </sub> 1,408** <sub>(615) </sub> <sub>(472) </sub>708
Period that a road is passible (road_pass) -56 -497 148
(411) (371) (292)
Geographical regions
North East -10,176*** <sub>(3,239) </sub> 9,260*** <sub>(3,316) </sub> -6,742*** <sub>(2,487) </sub>
North West -24,920*** <sub>(5,202) </sub> 10,168** <sub>(4,515) </sub> <sub>(3,914) </sub>-389
North Central Coast -11,890*** <sub>(2,774) </sub> 19,576*** <sub>(3,869) </sub> -11,427*** <sub>(2,275) </sub>
South Central Coast -11,122*** <sub>(3,337) </sub> <sub>(3,578) </sub>1,120 <sub>(3,041) </sub>-484
Central Highlands <sub>(4,098) </sub>432 37,155*** <sub>(5,761) </sub> <sub>(5,149) </sub>7,128
Southeast 28,052*** <sub>(3,829) </sub> 20,704*** <sub>(3,970) </sub> 24,650*** <sub>(5,530) </sub>
Mekong River Delta -380*** 31,908*** 14,392***
(3,456) (4,622) (3,908)
Income quintile 2008
Income quintile 2 2,983 -4,177* 4,824***
(2,059) (2,246) (1,323)
Income quintile 3 13,823*** <sub>(2,207) </sub> <sub>(2,739) </sub>-2,559 12,843*** <sub>(1,453) </sub>
</div>
<span class='text_page_counter'>(10)</span><div class='page_container' data-page=10>
Variable <b>Total income </b>
<b>(1) </b> <b>(2) </b> <b>(3) </b>
Income quintile 5 54,150*** <sub>(4,524) </sub> 22,319*** <sub>(4,281) </sub> 48,493*** <sub>(3,832) </sub>
_cons -160,605*** <sub>(19,284) </sub> -62,494*** <sub>(10,363) </sub> -50,506*** <sub>(16,119) </sub>
Observations 6,058 6,058 6,058
<i>Note: *, **, *** Coefficients are significant at the 10%, 5%, 1% level respectively </i>
<i>(Source: VHLSS 2008)</i>
<b>4 CONCLUSIONS AND </b>
<b>RECOMMENDATIONS </b>
It is concluded that pursuing multiple income
source strategy and tends to increase in diversity
level over time are very common among
geograph-ical and economic regions as well as among
house-holds across income quintiles. However, the
diver-sity degree is varied depending on regions and
in-come quintiles. The poorer have a tendency to be
more diversified in terms of a number of income
sources than the richer. This suggests that
diversi-fication is a mean to reduce risks of variation of a
certain income source. In terms of non-farm
in-come, the poor are much less diversified than the
rich for the fact that the poor often face more
con-straints compared to the rich due to unequal ability
- asset endowments to diversify income. The
in-come diversification has significantly positive
ef-fect on the household income. In other words, rural
households may increase their income by pursuing
the diversification strategy. The diversification
income sources are good in enabling households to
increase income and reduce the risk of variation in
income, but it is not always encouraged to take
income diversification. Under some certain
cir-cumstances, it is better to specialize in specific
activities, which household has the comparative
advantages.
Several useful policy implications can be drawn
from the research findings as follows (1)
Improv-ing education in order to help households in rural
areas to gain knowledge and skills required for
different income-generating activities; (2)
Improv-ing rural infrastructure, includImprov-ing roads, electricity,
water, telecommunications, quantitatively and
qualitatively; (3) Improving rural market
condi-tions; (4) Improving extension services and
provid-ing the technical support to rural households; (5)
Paying special attention to the poor in remote and
mountainous areas who encounter many constraints
in all policies and programs to foster income
diver-sification.
<b>REFERENCES </b>
Abdulai, A., Crole-Rees, A., 2001. Determinants of
In-come Diversification amongst Rural Households in
Southern Mali. Food Policy Journal. 26(4): 437-452.
Babatunde, R.O., Qaim, M., 2009. Patterns of income
diversification in rural Nigeria: determinants and
im-pacts. Quarterly Journal of International Agriculture.
48(4): 305-320.
Barrett, C.B., Reardon, T., 2001. Asset, Activity, and
Income Diversification among African
Agricultural-ists: Some Practical Issues. Food Policy Journal.
26(4): 315-331.
Ellis, F., 1998. Household Strategies and Rural
Liveli-hood Diversification. Journal of Development
Stud-ies. 35(1): 1-38.
Ersado, L., 2003. Income diversification in Zimbabwe:
Welfare implications from urban and rural areas.
FCND Discussion Paper. 152. International Food
Policy Research Institute. Washington, DC.
Escobal, J., 2001. The Determinants of Non-farm
In-come Diversification in Rural Peru. World
Devel-opment Journal. 29(3): 497-508.
GSO, General Statistics Office of Vietnam. 2008. Result
of the Survey on Households Living Standards 2008.
Statistical Publishing House. Hanoi.
Lanjouw, P., G. Feder, 2001. Rural Non-farm Activities
and Rural Development: From Experience towards
Strategy. The World Bank Rural Development
Strat-egy Background Paper. 4.
Schwarze, S., Zeller, M., 2005. Income diversification of
rural households in Central Sulawesi, Indonesia.
Quarterly Journal of International Agriculture. 44(1):
61-73.
</div>
<!--links-->