Optical properties of PbS and Au-PbS Core-Shell Nanoparticles
Bạn đang xem bản rút gọn của tài liệu. Xem và tải ngay bản đầy đủ của tài liệu tại đây (631.47 KB, 7 trang )
<span class='text_page_counter'>(1)</span><div class='page_container' data-page=1>
<b>Optical properties of PbS and Au-PbS Core-Shell Nanoparticles </b>
Sai Cong Doanh, Pham Nguyen Hai and Ngac An Bang*
<i>Faculty of Physics, VNU Hanoi University of Science</i>
<i>334 Nguyen Trai Road, Thanh Xuan District, Hanoi</i>
<i>, Tel. 0912197071</i>
<b>Abstract</b>
Lead sulfide (PbS) and Au-PbS core-shell nanoparticles were
successfully synthesized using the sonochemical method at room temperature.
The morphology of the synthesized particles was characterized by FESEM and
TEM images. Pure fcc phase of PbS and Au crystal structures was examined
and confirmed by XRD patterns. The quantum confinement effect plays a
crucial role in blue-shifting the absorption edge and the band gap energy of
both solid PbS nanoparticles and a thin spherical PbS shell toward shorter
wavelength region in comparison to those of PbS bulk. Due to the high
refractive index of PbS shell, Surface Plasmon Resonance (SPR) peak of Au
nanocores is significantly red-shifted by roughly 80 nm toward the longer
wavelength region. More sophisticate experimental data and some adequate
theoretical models are needed to fully explain the matters.
Keywords: PbS nanoparticle, Au-PbS core-shell nanoparticle, quantum confinement,
Surface Plasmon Resonance (SPR).
<b>1. Introduction</b>
Lead sulfide (PbS) is classified to be in a class of IV-VI semiconductors with a
<i>narrow direct band gap energy of 0.41 eV at 300 K [1]. Due to the strong quantum</i>
confinement effect, the band gap energy of PbS nanomaterils can be tuned in the
near infrared and even in the visible regions leading them to be employed in a lot
of applications such as IR detectors, glucose sensor [2, 3], photo-transitors [4],
solar absorber [5] or materials for luminescent display device [6], recently.
Furthermore, metal-semiconductor heterostructures such as Au-PbS, Au-Cu2O,
Ag-Cu2O and Au-SnO2 core-shell nanoparticles or TiO2-Ag and ZnO-Au
composites have been finding themselves in many applications since they can
integrate several functionalities required in one single structure [7 - 12].
</div>
<span class='text_page_counter'>(2)</span><div class='page_container' data-page=2>
<b>2. Experimental</b>
Lead sulfide nanoparticles were synthesized using the sonochemical method [13].
Briefly, a mixed aqueous solution of lead acetate trihydrate Pb(CH3COO)2.3H2O
(Pb(Ac)2), thioacetamide CH3CSNH2 (TAA) and cetyltrimethyl ammonium
bromide C19H42BrN (CTAB) at a certain molar ratio was treated with ultrasonic
irradiation for an hour at room temperature. The resulting precipitate was then
centrifuged and washed with absolute ethanol five times to remove the surfactant
and other possible residues.
Quasi-spherical gold nanoparticles were synthesized and then used as the core for
the fabrication of Au-PbS core-shell nanoparticles. The synthesis procedure of the
gold nanoparticles was reported in detail elsewhere [14]. The Au-PbS
nanoparticles were fabricated using the same sonochemical method with sodium
dodecyl sulfate C12H25NaO4S (SDS) being used as both surfactant and
structure-directing agent instead of CTAB.
The crystal structure of the synthesized samples was characterized by a Siemens
D5005 XRD diffractometer. The morphologies of the nanoparticles were observed
by a Nova nanoSEM 450 and a FEI Tecnai G2<sub>20 FEG (TEM). The absorption</sub>
spectra of the samples were recorded at room temperature using a Shimadzu
UV-Vis-2450PC and Carry 5000 spectrometer.
<b>3. Results and Discussion</b>
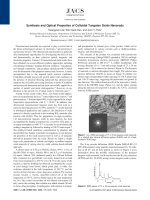
Figure 1.a. shows a typical XRD pattern of the as-synthesized PbS
samples and the standard card of the fcc phase of lead sulfide crystal structure
(PDF 05-0667 ICDD). Several well-resolved diffraction peaks at 26.0o<sub>, 30.1</sub>o<sub>,</sub>
43.1o<sub>, 51.0</sub>o<sub>, 53.5</sub>o<sub> and 63.6</sub>o<sub> can readily be well-indexed to those of the (111),</sub>
(200), (220), (311), (222) and (400) planes of the pure fcc phase of PbS (PDF
<i>05-0667 ICDD). No other impurities were found and the lattice constant a was</i>
<b>determined to be. A typical FESEM image of the as-synthesized PbS</b>
nanoparticles is shown in Fig.1.b. The PbS nanoparticles appear to be
quasi-spherical in shape with a rough surface and their average size was estimated to
be 41.6 nm with the standard deviation of 5.1 nm.
Optical properties of the synthesized PbS nanoparticles were
investigated by using the absorption spectrum. As it can be seen in Fig. 1. c.,
the absorption spectrum of the synthesized PbS nanoparticles exhibits no
absorption peak but a stiff absorption edge in the near-infrared region. Since
<i>PbS is a direct band gap semiconductor, the band gap energy E</i>g of synthesized
<i>PbS nanoparticles was determined from the plot of (αhν)</i>2<sub> as a function of the</sub>
<i>incident photon energy hν with α being the absorption coefficient. A modified</i>
<i>linear function, where A is a constant, was fitted to the straight portion of the</i>
<i>graph on the edge as shown in Fig.1.d. The band gap energy E</i>g was then
</div>
<span class='text_page_counter'>(3)</span><div class='page_container' data-page=3>
<i>edge and the band gap energy E</i>g of the synthesized PbS nanoparticles can be
attributed to the quantum confinement effect of PbS nanoparticles. There are
several theoretical models such as the effective mass model, hyperbolic band
model, cluster model … which can be used to explain the dependence of the
band gap energy on the size of PbS nanoparticle [15]. Unfortunately, all of
those models fail in describing our experimental data. Beside the fact that the
synthesized PbS nanoparticles have a rather broad size distribution, the
<i>size-dependent effect of the dielectric constant ε of PbS nanoparticle should also be</i>
taken into account in those mentioned theoretical models.
a. Typical XRD spectrum of PbS
nanoparticles
b. Typical TEM image of PbS
nanoparticles
c. Absorption spectrum of PbS
nanoparticles <i>d. Plot of (αhν)</i>
2<sub> as a function of the</sub>
<i>incident photon energy hν</i>
Fig.1. The typical XRD patterns (a), TEM image (b), absorption spectrum (c) of the
<i>synthesized PbS nanoparticles and the plot of (αhν)</i>2<sub> as a function of the incident</sub>
<i>photon energy hν (d).</i>
</div>
<span class='text_page_counter'>(4)</span><div class='page_container' data-page=4>
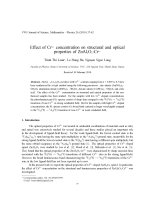
<i>constant a was calculated to be </i><sub>Figure 2.b. shows a typical FESEM image of the</sub>
synthesized gold nanoparticles. Being quasi-spherical in shape, the average size
of the Au nanoparticles was estimated to be 41.4 ± 4.7 nm. The UV_Vis
spectrum of the synthesized Au nanoparticles is shown in Fig.2.c. As expected,
the UV_Vis spectrum exhibits only one absorption peak at about 534 nm
corresponding to the dipole Surface Plasmon Resonance (SPR) of the
symmetric spherical gold nanoparticles [14, 16].
a. Typical XRD pattern of the
synthesized Au nanoparticles c. Absorption spectrum of the synthesized Au nanoparticles
b. Typical FESEM image of the
synthesized Au nanoparticles
Figure 2. The typical XRD pattern (a),
FESEM image (b) and UV_vis spectrum
(c) of the synthesized Au nanoparticles.
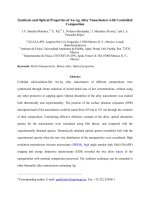
Crystal structure of the synthesized Au-PbS nanoparticles was again examined
by using the XRD pattern. A typical XRD pattern of the synthesized Au-PbS
nanoparticles is shown in Fig.3.a. As already described above, Au-PbS colloidal
nanoparticles were synthesized and then suspended in ethanol at a very low
concentration. Thus, there are only three clear, but rather weak, diffraction peaks at
26.0o<sub>, 30.1</sub>o<sub> and 43.1</sub>o<sub>, which could be identified as those of the (111), (200) and (220)</sub>
planes of the pure fcc phase of PbS (PDF 05-0667 ICDD), respectively. The pattern
also exhibits a well-resolved diffraction peak at 38.2o<sub> which could be well indexed to</sub>
</div>
<span class='text_page_counter'>(5)</span><div class='page_container' data-page=5>
characterized using TEM images with the help of the image processing program
<b>ImageJ. A typical TEM images of the synthesized Au-PbS core-shell nanoparticles is</b>
shown in Fig.3.b., which clearly indicates the core-shell structure with only one Au
core at the center and a thin PbS shell. No particle with multiple cores or without core
was observed. Due to their similar crystal structure, it is possible that PbS could be
nucleated and epitaxially grown on the surface of the Au core to form a rough shell of
PbS covering the entire surface of gold particle. On average, the thickness of the PbS
shell was estimated to be about 5.1 ± 1.1 nm.
a. Typical XRD pattern of the synthesized
Au-PbS core-shell nanoparticles. b. Typical TEM image of the synthesized<sub>Au-PbS core-shell nanoparticles.</sub>
c. Absorption spectrum of the synthesized
Au-PbS core-shell nanoparticles.
<i>d. Plot of (αhν)</i>2<sub> as a function of the </sub>
<i>incident photon energy hν</i>
Figure 3. The typical XRD patterns (a), TEM image (b), absorption spectrum (c) of the
<i>synthesized Au-PbS core-shell nanoparticles and the plot of (αhν)</i>2<sub> as a function of the incident</sub>
<i>photon energy hν (d).</i>
</div>
<span class='text_page_counter'>(6)</span><div class='page_container' data-page=6>
in comparison to the case of the solid PbS nanoparticles discussed above. The band
<i>gap energy E</i>g of the synthesized Au-PbS core-shell nanoparticles was again
<i>determined from the plot determined from the plot of (αhν)</i>2<sub> as a function of the</sub>
<i>incident photon energy hν with α being the absorption coefficient as shown in Fig.3.d.</i>
<i>The band gap energy E</i>g <i>was then determined to be 2.64 eV, which is much larger than</i>
that of the solid PbS nanoparticles of 41.6 ± 5.1 nm in size. The observed blue-shift of
<i>the absorption edge and the band gap energy E</i>g of the PbS layer of about 5.1 nm in
thickness are again due to the quantum confinement effect. Unlike the case of the
solid PbS nanoparticle, there is no suitable theoretical model to explain the
dependence of the band gap on the thickness of a thin spherical PbS shell.
The UV_vis spectrum of the Au-PbS core-shell nanoparticles shown in Fig.
3.c. also exhibits an absorption peak at about 615 nm which can be attributed to the
SPR peak of quasi-spherical Au nanocores. In comparison to the SPR of Au nanocores
suspended in water shown in Fig. 2.c, the SPR peak of the Au cores is significantly
red-shifted from 534 nm to 615 nm. SPR of noble metallic nanoparticles depends not
only on the shape and size of the particles but also on the refractive index of the
medium in which they are embedded in [16]. In the case of the Au-PbS core-shell
nanoparticles, the high refractive index of PbS shell (ranging from 3.6818 to 4.5975 in
the visible region [17]) is responsible for the large red shift of the SPR peak of Au
core. The broader SPR peak of the gold cores may indicate the variation of the
thickness and uniformity of the PbS shell.
<b>4. Conclusion</b>
PbS and Au-PbS core-shell nanoparticles were successfully synthesized
using the sonochemical method at room temperature. Due to the quantum
confinement effect, the band gap energy of PbS solid nanoparticles of 41.6 ±
<i>5.1 nm in size is significantly blue-shifted to 1.16 eV in comparison to that of</i>
the bulk PbS. For a thin spherical PbS shell of about 5.1 nm in thickness, the
<i>band gap energy is drastically shifted further to 2.64 eV. Current theoretical</i>
calculations appear to be not suitable to explain the obtained experimental data.
More sophisticate experimental data and some adequate theoretical models are
needed.
</div>
<span class='text_page_counter'>(7)</span><div class='page_container' data-page=7>
SPR of noble metallic nanoparticles on the electrical properties of the surrounding
medium.
<b>Acknowledgments. Financial support from VNU Hanoi University of Science (Project TN. 16.05) is</b>
gratefully acknowledged. The authors wish to thank the Center for Materials Science and the
Department of Solid State Physics at the Faculty of Physics, VNU Hanoi University of Science,
for making some experimental facilities such as SIEMENS D5005 XRD diffractometer, Nova
nanoSEM 450, Shimadzu UV-Vis-2450PC and Carry 5000 spectrometers available to us.
<b>References</b>
1. Kohn S E, Yu P Y, Petroff Y, Shen Y R, Tsang Y and Cohen M L 1973 Phys. Rev. B 8
1477.
2. Xiaofei Liu, Mingde Zhang, International Journal of Infrared and Millimeter Waves,
2000, Volume 21, Issue 10, pp 1697–1701.
3. Sai Cong Doanh, Luu Manh Quynh, VNU Journal of Science: Mathematics – Physics,
Vol. 31, No. 2 (2015) 61-67.
4. Zhenhua Sun, Jinhua Li and Feng Yan, J. Mater. Chem., 2012,22, 21673-21678
5. V.M. García, M.T.S. Nair, P.K. Nair, Solar Energy Materials, Volume 23, Issue 1,
November 1991, Pages 47-59
6. Vanessa Wood and Vladimir Bulovic, Nano Reviews 2010, 1: 5202.
7. Chun-Hong Kuo, Tzu-En Hua and Michael H. Huang, J. Am. Chem. Soc., 2009, 131
(49), pp 17871–17878.
8. Jiangtian Li, Scott K. Cushing, Joeseph Bright, Fanke Meng, Tess R. Senty, Peng Zheng,
Alan D. Bristow, and Nianqiang Wu, ACS Catal., 2013, 3 (1), pp 47–51.
9. Jong-Soo Lee, Elena V. Shevchenko and Dmitri V. Talapin, J. Am. Chem. Soc., 2008,
130 (30), pp 9673–9675
10. Kuai Yu , Zhengcui Wu , Qingrui Zhao , Benxia Li , and Yi Xie, J. Phys. Chem. C, 2008,
112 (7), pp 2244–2247.
11. Tsutomu Hirakawa and Prashant V. Kamat, J. Am. Chem. Soc., 2005, 127 (11), pp 3928–
3934.
12. Jih-Jen Wu, Chan-Hao Tseng, Applied Catalysis B: Environmental, Volume 66, Issues 1–
2, 2006, Pages 51–57.
13. Le Van Vu, Sai Cong Doanh, Le Thi Nga, and Nguyen Ngoc Long, e-J. Surf. Sci.
Nanotech. Vol. 9 (2011) 494-498.
14. Ngac An Bang, Phung Thi Thom and Hoang Nam Nhat, 2013, Volume 46, Issue 2, pp
91–96.
15. Y. Wang, A. Suna, W. Mahler, and R. Kasowski, J. Chem. Phys. 87, 7315 (1987).
16. Perez-Juste J, Pastoriza-Santos I, Liz-Marzan LM, Mulvaney P, Coord Chem Rev (2005)
249:1870
</div>
<!--links-->