Factors Effect on Capital Structure The Caseof Delisted Companies on the Vietnam Stock Market
Bạn đang xem bản rút gọn của tài liệu. Xem và tải ngay bản đầy đủ của tài liệu tại đây (185.6 KB, 10 trang )
<span class='text_page_counter'>(1)</span><div class='page_container' data-page=1>
Factors Effect on Capital Structure
The Caseof Delisted Companies on the Vietnam Stock Market
Nguyen Vinh Khuong
1,*<sub>, Dinh Thi Thu Thao</sub>
2<i>1<sub>University of Economics and Law,</sub></i>
<i>Quarter 3, Linh Xuan Ward, Thu Duc Dist., Ho Chi Minh City</i>
<i>2<sub>Nguyen Tat Thanh University, No. 300A,</sub></i>
<i>Nguyen Tat Thanh Str., Ward 13, Dist. 4, Ho Chi Minh City</i>
Received 03 November 2016
Revised 10 December 2016, Accepted 22 December 2016
<b>Abstract: </b>The intent of this study is to investigate the factors effect on the capital structure of
companies delisted on the stock market. In the period from 2012 to 2015, 120 companies delisted
on Vietnam’s stock markets (HNX and HOSE). We classified the chosen companies delisted by
delisting reason. We then we chose those companies delisted relating to the issue of capital. Based
on data from 80 companies delisted on Vietnam stock markets using quantitative research
methods, we find a correlation between the debt ratio of the firms and the proxy of firm’s
performance, the proxy of firm size, the liquidity ratio and return on assets. The study results have
implications for investors and for managers in making decisions about optimal capital structure.
The results are a basis for investors to predict the health of the companies in which they intend to
invest, or delisted companies that have still the capability of developing.
<i>Keywords: Capital structure, stock market, delisted firms, Vietnam.</i>
<b>1. Introduction *</b>
Firms make their decisions to get the most
out of the proportion they are using of their
capital. How to structure capital is the very first
question that financial managers ask
themselves before getting into any financial
activity. Capital structure is not only
concerned with discovering the right class of
finance but it is more than that; it focuses on
the optimal mix that should be created to
maximize the shareholder’s wealth. So, capital
structure is characterized as the mix of debt and
equity in the total capital of the firm which
entails accomplishing the overall objectives of
the firm.
The conflict that arises between managers
and the shareholders is as follows: shareholders
assume that managers do not spend the cash in
the right way, this is due to their different
* <sub> Corresponding author. Tel</sub><sub>.:</sub><sub> 84-935997116</sub>
Email:
interests. The goal of managers is to find
investments that will lead to growth of the
company. More growth means more power for
them, because of the increasing resources. A
developing company usually means a higher
compensation for managers as well. Another
reward for managers when they deliver good
work can be a promotion. Therefore, managers
first investigate how they can increase their
own wealth before thinking about the
shareholder's interests. The shareholders of the
company want the manager to spend money in
such a way that they will get the highest value
or dividend for their investment in the shares of
the company. To let the company grow,
investments must be made. Hence, managers
use some of the money that can be paid as
dividends for their own interest to expand the
companies value [1].
</div>
<span class='text_page_counter'>(2)</span><div class='page_container' data-page=2>
quantifying the impact of financial distress
costs on debt ratios is difficult. Early empirical
studie of capital structure use a firm’s operating
risk, measured as either the coefficient of
variation or the standard deviation of earnings
before interest and taxes (EBIT), to proxy for
financial distress costs [2]. These studies find
no evidence of a negative relationship between
financial distress costs and leverage. Several
other studies that investigate the relationship
between leverage and financial distress costs do
so incorporating firm size as the inverse proxy
for expected financial distress costs in their
empirical specification states that companies
with higher growth opportunities will have a
smaller amount of debt comparable to
companies with low growth opportunities [3, 4,
5]. Companies find it too costly to finance
projects by using debt [6]. Higher growth
opportunities increase the likelihood of
investing in risky or suboptimal projects. This
makes it more difficult to obtain debt since it is
less likely for debt providers to get their money
back. Therefore, debt suppliers are not willing
to lend money to companies that make
over-investments [7]. When there is
under-investment, the opposite happens. From the
overinvestment perspective, it is expected that
growth opportunities have a negative influence
on leverage. This is in line with the findings in
the article Gaud et al. (2007) [8], who found out
that growth opportunity, has a negative
influence on the leverage of European
companies. The results of Chen and Jiang
(2001) indicate that for Dutch companies,
growth opportunities are positive influences
with leverage [6].
Modigliani and Miller (1958) did
extraordinary work on capital structure and in
response to their theory many authors and
scholars jumped into this topic and presented
many theories on corporate capital structure [9].
All the theories presented by the authors
linked capital-structure with firm-specific
features and the institutional environment.
Agency costs are a type of internal cost that
arise from, or must be paid to, an agent acting
on behalf of a principal. These costs arise
because of core problems, such as conflicts of
interest between shareholders and management.
For the case in point some features and
institutional environments are: tax advantages
of debt [9], debt as a signal of firm’s quality
[10], agency cost of debt [11], use of debt to
overcome the free cash flow problem [1] and
use of debt as an anti-takeover device [12].
The structure of the remaining part of this
paper is as follows: review of the chief
theoretical and empirical studies related to the
research; summary of some potential theories
of capital structure; the main factors that drive
the capital structure of companies; detailed
discussion on sources of data and methodology
adopted; results and discussions and finally,
findings and conclusion of the study.
</div>
<span class='text_page_counter'>(3)</span><div class='page_container' data-page=3>
Companies are delisted and make financial
losses and reduce the confidence of the public.
The number of companies delisted has
increased in recent years, therefore, research on
capital structure for delisted companies on
Vietnam stock markets is essential.
<b>2. Literature review and hypotheses</b>
Capital structure relates to the deciding
sources to finance companies’ businesses.
Ordinarily, at the start-up of a firm, equity is
used to run the business, since equity charges
no fixed cost on the firm; on the other hand, as
the firm grows, debt becomes a preferred
choice of a firm’s capital, and in the remainder
of their life cycle, debt is preferred.
In 1958, Modigliani and Miller
[9]conducted research that pointed out that in
an ideal world with no bankruptcy cost, a
frictionless capital market and no taxes, the
value of a firm does not depend on the structure
of capital. Various empirical research studies
have been conducted to examine Modigliani
and Miller’s theory, and most of them studied
the relevance of capital structure on business
firms. As a result, in 1963 Modigliani and
Miller [17] included taxes and other market
imperfections, and found that firms really can
maximize their value by using debt in their
operations to take advantage of the tax shield.
Other authors (Bradley et al., 1984 [18]; Kraus
and Litzenberger, 1976 [19]; Harris and Raviv,
1991 [20]) showed that there is an optimal
capital structure of firms’ financing.
There are a number of factors that settle on
the capital structure of any firm. Many theories
have been developed so far, enlightening the
optimal capital structure. Some theories are
endowed with evidence that supports the
utilization of debt and some argue that equity is
the best way of enhancing a firm's capital
structure. Here, we will briefly review the
literature that is the motivation of our research
and is related to or study.
Modigliani and Miller (1958) argued that
firm value was independent of firm capital
structure, using debt or equity had no material
effect on firm value. According to this paper,
they relaxed their assumption by incorporating
corporate tax benefits as determinants of the
capital structure of firms [17]. They proposed
that firms should employ as much debt capital
as possible in order to achieve the optimal
capital structure.
Some assumptions put a ceiling on
Modigliani and Miller's theorem of debt
peripheral nature, which does not exist in
reality. When these assumptions are not taken
into account, then the choice of the capital
structure becomes very indispensable. Fischer
et al. (1989) argued that with the passage of
time corporations are inclined towards their
preferred leverage range by issuing new
securities and equity [21].
<i><b>Profitability (PROF): Based on the</b></i>
pecking-order theory, businesses with high
profitability will prefer internal financial
sources rather than external ones. Specifically,
the internal source of retained earnings will be
used first, followed by new bonds issued.
Finally, new shares will be issued as the last
preferred source, if necessary. Profitability is
net income before tax divided by net premium.
The perceived relationship between profitability
and leverage is inversely proportionate. This
suggests that there exists a negative relationship
between profitability and capital structure. This
view is supported by many empirical studies
conducted in different countries, including
Booth et al. (2001) [22], Eriotis et al. (2007)
[23], Faris (2010) [24], Bambang et al. (2013)
[25]. In Vietnam, the empirical studies of Tran
Dinh Khoi Nguyen and Ramachandran (2006)
[13]), Dzung et al. (2012) [16], Okuda and Lai
Thi Phuong Nhung (2012) [15],) also found a
negative relationship between profitability and
capital structure. According to the pecking order
theory and empirical results of the previous
authors, the author hypothesizes as follows:
<i>H1: Profitability has a negative</i>
<i>relationship (-) with capital structure </i>
</div>
<span class='text_page_counter'>(4)</span><div class='page_container' data-page=4>
affects the capital structure of the business.
According to the tradeoff theory of capital
structure and the pecking order theory, firms
with high volatility in income face greater risk
in the payment of debts. This implies that firms
with high earnings volatility will borrow less
and prefer internal funds. Thus, a negative
relationship between business risk or earnings
volatility and capital structure is expected. The
empirical studies supporting this view include
Booth et al. (2001) [22], Fama and French
(2002) [26], Jong et al. (2008) [27], Sharif et al.
(2012) [28]. The author suggests the following
hypothesis:
<i>H2: Business risks has a negative relation</i>
<i>(-) to the capital structure </i>
<i><b>F</b><b>irm performance (</b><b>TOBINQ): TOBINQ</b></i>
reflects the market value of the business.
TOBINQ is measured by market capitalization
over average total assets. As enterprises
increasingly work well, then the value of the
enterprise market grows higher. Conversely,
when the signal is now operating at a loss, at
once the market will reflect the value of the
business. Meanwhile, the index will be smaller
TOBINQ. Therefore, the independent variable
TOBIN is added to the model.
<i>H3: Firm performance has a negative</i>
<i>relation (-) to the capital structure</i>
<i><b>Firm size (SIZE): According to the </b></i>
trade-off theory of capital structure, large-scale firms
are generally able to get more loans than
small-scale enterprises. Specifically, in order to obtain
external capital, small businesses bear higher
costs than big ones due to asymmetric
information. Hence, big businesses have an
advantage over small businesses when
accessing capital markets, which indicates that
there exists a positive relationship between
capital structure and company size. This view is
supported by many empirical studies conducted
in different countries, including Booth et al.
(2001) [22], Eriotis et al. (2007) [23], Faris
(2010) [24]. According to the trade-off theory
of capital structure and the empirical studies’
results obtained by national and international
researchers, the author suggests the following
hypothesis:
<i>H4: Firm size has a positive relation (+) to</i>
<i>the capital structure </i>
</div>
<span class='text_page_counter'>(5)</span><div class='page_container' data-page=5>
to finance the investment. This refers to a
negative relationship between liquidity and
capital structure. The empirical studies
supporting this view include Eriotis et al.
(2007) [23], Afza et al. (2011) [29]. However,
the trade-off theory of capital structure states
that firms with high liquidity generally maintain
a higher debt ratio, indicating a positive relation
between liquidity and capital structure.
According to the pecking order theory and
empirical results of the preceding authors, the
author hypothesizes as follows.
<i>H5: Liquidity has a negative relation (-) to</i>
<i>capital structure </i>
<i><b>Return on assets (ROA): ROA is an</b></i>
indicator to assess the profitability of business
assets. It is calculated by the formula ROA =
Profit after tax/Total Assets. The index shows a
property contract could create many profitable
contracts. Profit is the ultimate goal of the
company and is a basis for investors to assess
the performance of the business. However, to
assess the profitability of each business, and
make comparisons between businesses, there is
a need to compare profit with other indicators
such as total assets, equity or revenue. ROA is
an important financial indicator to assess this
aspect. From the comparison between years
ROA, corporate managers will assess the
performance of the entire enterprise, shrinking
investments that are inefficient or ineffective,
and avoiding spreading investment inefficiency
causing a loss of capital resulting in insolvency
affecting the whole social economy. If the
enterprise’s ROA is low, this will of course,
affect the ability to pay debts and increase the
risk of falling into bankruptcy. Thus the ROA is
an independent variable in nature in the same
way as the dependent variable.
<i>H6: ROA has a negative relation (-) to</i>
<i>capital structure </i>
The mixed results among the empirical
results encourage us to use both short-term debt
and long-term debt, with the total debt as
capital structure. However, the study would be
lacking if it did not include other factors such as
profitability, business risks, firm performance,
firm size, liquidity, return on assets effect on
capital structure.
<b>3. Data and variables</b>
<i>3.1. Sample description</i>
In this study, the data set includes 80
companies delisted on the Vietnamese stock
markets (HNX and HOSE) in the period from
2012 to 2015. For 80 companies, collected data
consists of balance sheets and income
statements. Following the above sample
selection process, a total of 192 observations
were collected.
<i>3.2. Variables</i>
Our dependent variable is the debt ratio. It
is used as the main measure of capital structure
which is defined as the ratio of total debt
divided by the total assets of the firm.
LEV = Total debt/Total assets
In this study, on the basis of previous
studies, six independent variables are used:
profitability, business risk, firm performance,
firm size, liquidity and ROA. As far as
independent variables are concerned, we have
selected several proxies that appear in the
empirical literature.
PROF = Earnings before Interest and
Tax/Total revenue
RISK = Interest Payments/Earnings before
Interest and Tax
TOBINQ = Market capitalization/Average
Total assets
SIZE= Natural logarithm of total assets
LIQ= Current Assets/Current Liabilities
ROA = Retain Earnings/Total Assets
<b>4. Research methodologies</b>
</div>
<span class='text_page_counter'>(6)</span><div class='page_container' data-page=6>
follows two stages. In the first stage, we
conduct regressions of all determinants related
to a firm’s characteristics (profitability,
business risks, firm performance, firm size,
liquidity, return on assets) on capital structure.
In the second stage, we add a dummy variable
(DUM) to evaluate the differences in the capital
structure and its determinants between (LEV
57.39%) and (LEV > 57.39%).
These regression models can be specified as
follows:
<i>4.1. Research model</i>
- Model 1 is applicable to companies
delisted on VN market stock:
LEVi,t = α + β1 PROFi,t + β2RISKi,t +
β3TOBINQi,t + β4SIZEi,t + β5LIQi,t + β6ROAi,t + εi,t
- Model 2 is applicable to evaluate the
differences about the capital structure (LEV >
57.39%):
LEVi,t = α + β1 PROFi,t + β2RISKi,t +
β3TOBINQi,t + β4SIZEi,t + β5LIQi,t + β6ROAi,t +
DUM<i>i, t </i>+ εi,t
- Model 3 is applicable to evaluate the
differences about the capital structure (LEV
57.39%):
LEVi,t = α + β1 PROFi,t + β2RISKi,t +
β3TOBINQi,t + β4SIZEi,t + β5LIQi,t + β6ROAi,t +
DUM<i>i, t </i>+ εi,t (Table 1).
<b>5. Results </b>
<i>5.1. The reality of the companies delisted in the</i>
<i>Vietnam stock markets</i>
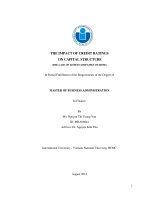
The number of companies delisted has
increased in recent years. Specifically,
calculated from 2012 to 06/30/2015, the
number of delisted companies is 120 of which
78 companies were delisted on the HNX and 42
companies on the HOSE for much different
reasons (follow on the website: www.hnx.vn,
www.hsx.vn) (Table 2).
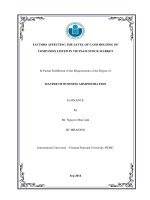
Table 1. Proxies, Expected relationship
and supported theories
<b>No.</b> <b>Independent variables</b> <b>Hypothesis</b> <b>Theories</b>
Name Sign
1 Profitability PROF (-) Bankruptcy cost, trade off theory, pecking <sub>order theory</sub>
2 Business <sub>risks</sub> RISK (-) Agency theory, bankruptcy cost
3 Firm <sub>performance</sub> TOBINQ (-) Agency theory, market timing theory
4 Firm size SIZE (+) Agency cost of debt, bankruptcy cost
5 Liquidity LIQ (-) Free cash flow theory, agency cost of debt, <sub>trade off theory</sub>
6 Return on <sub>assets </sub> ROA (-) Agency theory
<i>Source: Adapted from: Deesomsak et al. (2004) [7]</i>
Table 2. Statistics of the company
delisted each year
<b>Year</b> <b>2012</b> <b>2013</b> <b>2014</b> <b>Total</b>
Number companies delisted 18 46 32 96
</div>
<span class='text_page_counter'>(7)</span><div class='page_container' data-page=7>
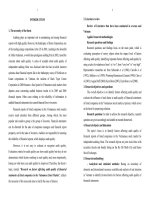
<i>5.2. Results</i>
Table 3. Descriptive statistics of sample variables
<b>Variable</b> <b>Obs</b> <b>Mean</b> <b>Std.Dev</b> <b>Min</b> <b>Max</b>
LEV 192 0.7635938 0.3495294 0.04 2.69
PROF 192 -0.9375 2.398223 -11.75 28.25
RISK 192 0.6683333 11.12382 -21.01 121.51
TOBINQ 192 0.1730729 0.4786712 0 6.35
SIZE 192 26.32849 1.216191 23.46 29.38
LIQ 192 1.386146 2.133767 0.1 18.13
ROA 192 -0.1059896 0.2107555 -2.21 0.14
<i>Source: Descriptive statistics with STATA.</i>
The mean of the variable explains the
average total debt with respect to total assets of
the companies in the sample of this study. From
Table 3 it also can be stated that companies in
this study use a maximum of 269% of total debt
to finance the companies’ assets. The results of
the variable non-debt tax shield are a little bit
higher than the mean of 0,026 and 0,028 of De
Jong (2002), which indicates that companies in
this sample use more depreciation and
amortization with regard to total assets.
Companies in this study make less use of
tangible assets in comparison with the article of
De Jong (2002), who found that the mean is
0,556 and median is 0,586. Deesomak et al.
(2004) used the same method to measure
volatility as this study, but they used data from
companies from Asia (Table 4).
To test the correlation between the
variables, the Pearson correlation coefficient
was used. With this test how variables move
from each other has been measured. The
correlations between the variables in Table 4,
gives a first indication of the sign and the
influence of the variables in determining
leverage. The correlation of -0.05 for profit and
leverage indicates that there is a negative
relation between the variables. The same
applies for the TOBINQ, LIQ and ROA with a
correlation of -0.1668, -0,4878 and -0,6151.
Firm size and leverage are positively correlated,
with a correlation of 0.4186. The same applies
for the RISK with a correlation of 0.0169
(Table 5).
Table 4. Pearson correlation coefficient matrix
<b>LEV</b> <b>PROF</b> <b>RISK</b> <b>TOBINQ</b> <b>SIZE</b> <b>LIQ</b> <b>SIZE</b>
LEV 1.0000
PROF -0.0500 1.0000
RISK 0.0169 0.0095 1.0000
TOBINQ -0.1668 0.0070 -0.0173 1.0000
SIZE 0.4186 0.0099 0.0449 0.0053 1.0000
LIQ -0.4878 0.0133 -0.0174 0.1477 -0.2554 1.0000
ROA -0.6151 0.2094 0.0465 0.0818 -0.0297 0.1422 1.0000
</div>
<span class='text_page_counter'>(8)</span><div class='page_container' data-page=8>
<b>Independent variables</b> <b>Coef.</b> <b>P>| t |</b>
PROF 0.0103136 0.114
TOBINQ *-0.0555263 0.087
SIZE ***0.092262 0.000
LIQ ***-0.0515206 0.000
ROA ***-0.9443178 0.000
CONS ***-1.682591 0.000
Observations 192
R-squared 63.77%
P_Value > X2<sub>= 0.0000 ***</sub>
<i>Source: Regression with STATA.</i>
Table 6. The regression results of model 2- (LEV > 57.39%)
<b>Independent variables</b> <b>Coef.</b> <b>P>| t |</b>
PROF **0.0032961 0.023
TOBINQ **-0.025756 0.016
SIZE ***0.0409082 0.001
LIQ ***-0.0879829 0.000
ROA ***-0.8482399 0.000
CONS -.2009464 0.534
Observations 137
R-squared 67.13%
P_Value > X2 <sub>= 0.0000 ***</sub>
<i>Source: Regression with STATA.</i>
Table 7. The regression results of model 3- (LEV 57.39%)
<b>Independent variables</b> <b>Coef.</b> <b>P>| t |</b>
PROF ***0.0409525 0.004
SIZE ***0.1033748 0.004
LIQ **-0.0123674 0.035
ROA ***-1.488746 0.001
CONS **-2.297706 0.011
Observations 55
R-squared 72.13%
P_Value > X2 <sub>= 0.0000 ***</sub>
<i>Source: Regression with STATA.</i>
<i><b>For firm performance (TOBINQ) has a</b></i>
negative sign relationship with a leverage ratio
and is statistically significant at 10%,
<i>specifically, it supports hypothesis H3: Firm</i>
<i>performance has a negative relation (-) to the</i>
<i>capital structure. As the stock market in</i>
Vietnam has low trading, that way relies more
on the debt and the companies can meet
problems. And if these companies cannot earn
more, then a rise in interest payments may
result in bankruptcy.
<i><b>For firm size (SIZE), the variable of size</b></i>
also bears a positive relationship with the
leverage ratio and is statistically significant at
<i>1%., Specifically it supports hypothesis H4:</i>
<i>Firm size has a positive relation (+) to the</i>
<i>capital structure. The result shows that a larger</i>
</div>
<span class='text_page_counter'>(9)</span><div class='page_container' data-page=9>
and the experimental research findings by Booth
et al. (2001) [22], Eriotis et al. (2007) [23], Tran
Dinh Khoi Nguyen and Ramachandran (2006)
[13] . According to trade off theory, large firms
may rely more on debt as they can diversify
their risk and enjoy tax shield benefits. Though
trade-off theory suggests benefits, it also
predicts adverse factors such as the cost of
bankruptcy, arguing that benefits of lower debt
is the same as a rising in the debt level.
<i><b>For liquidity (LIQ), regression coefficients</b></i>
of this variable are negative and statistically
significant at 1%. Specifically, this supports
<i>hypothesis H5: Liquidity has a negative</i>
<i>relation (-) to capital structure. This negative</i>
relation is agreed by the author to fit in the
context of the companies delisted in Vietnam,
because of their capital structure characterized
by the large proportion of short-term or
working capital over the total capital.
<i><b>For return on assets (ROA), </b></i> regression
coefficients of this variable are negative
(-0.9443) and statistically significant at 1%,
<i>specifically. This supports hypothesis H6: ROA</i>
<i>has a negative relation (-) to capital structure.</i>
<b>6. Conclusion</b>
In this study, we conducted our analysis in
order to investigate how some specific firm
characteristics determine a firm’s capital
structure. We use the data of the financial
statements of 80 companies delisted on the
Vietnamese stock exchanges during 2012-2015.
According to the results, there is a negative
relation between the debt ratio of the firms and
their firm performance, their liquidity ratio and
their return on assets. Size appears to maintain a
positive relation. The variable non-debt tax
shield is the most important factor, which is
measured for the trade-off theory. The other
variables are significant and do influence the
amount of leverage. Many researchers also use
firm size to test trade-off theory, because bigger
firms are more stable and it is less risky for
them to borrow debt. Therefore, the result for
firm size confirmed the trade-off theory.
This research contributes to the existing
literature by adding evidence for some
important factors in determining the capital
structure. As mentioned before, research on the
capital structure using data of Vietnamese
delisted companies is scarce. The results
contribute due to the most recent data that has
been used in comparison with other studies on
Vietnam firms.
<b>References</b>
[1] Jensen, M., “Agency cost of free cash flow,
corporate finance, and takeovers”, American
Economic Review, 76 (1986) 2, 323.
[2] Titman S, Wessels R., “The Determinants of
Capital Structure Choice”. T. J. Financ., 43
(1988) 1.
[3] Sunder, L. and S.C. Myers, “Testing Static
Tradeoff against Pecking Order Models of
Capital Structure”, Journal of Financial
Economics, 51 (1999), 219.
[4] Fama EF, French KR. “Testing trade-off and
pecking order predictions about dividends and
debt”. T. Rev. Financ. Stud., 15 (2002), 1.
[5] Myers, S. C., “Capital structure”, The Journal of
Economic Perspectives, 15 (2001) 2, 81.
[6] Chen, Linda H., and George J. Jiang. The
determinants of dutch capital structure choice.
University of Groningen, 2001.
[7] Deesomsak, R., Paudyal, K., & Pescetto, G..
“The determinants of capital structure: Evidence
from the Asia Pacific region”, Journal of
Multinational Financial Management, 14 (2004)
4, 387.
[8] Gaud, P., E. Jani, M. Hoesli, and A. Bender.,
“The Capital Structure of Swiss Companies: An
Empirical Analysis Using Dynamic Panel Data,”
European Financial Management, 11 (2005), 51.
[9] Modigliani F, Miller MH, “The cost of capital,
corporation finance, and the theory of investment”.
Am. Econom. Rev., 48 (1958) 3, 261.
[10] Hayne E. Leland, and David H. Pyle.
“Informational asymmetries, financial structure,
and financial intermediation”, The Journal of
Finance 32 (1977) 2, 371-387.
</div>
<span class='text_page_counter'>(10)</span><div class='page_container' data-page=10>
[12] Harris, Milton, and Artur Raviv, “Corporate
control contests and capital structure”, Journal of
financial Economics, 20 (1988), 55.
[13] Tran Dinh Khoi Nguyen, Ramachandran,
Neelakantan, “Capital Structure in Small and
MediumsizedMedium sized Enterprises: The
Case of Vietnam”, ASEAN Economic Bulletin,
23 (2006), 192.
[14] Biger Nahum, Nam V. Nguyen and Quyen X.
Hoang, “The determinants of capital structure:
evidence from Vietnam”, Asia-Pacific Financial
Markets: Integration, Innovation and Challenges
International Finance Review, 8 (2008), 307.
[15] Okuda Hidenobu, Lai Thi Phuong Nhung, “The
Determinants of the Fundraising Structure of Listed
Companies in Vietnam: Estimation of the Effects
of Government Ownership”, Global COE Hi-Stat
Discussion Paper Series 110 (2010).
[16] Dzung Nguyen, Ivan Diaz-Rainey and Andros
Gregoriou, “Financial Development and the
Determinants of Capital Structure in Vietnam”,
Social Science Research Network, 2012.
[17] Modigliani, F. and Miller, M., “Corporate
income taxes and the cost of capital: A
correction”, The American Economic Review,
53 (1963), 443.
[18] Bradley M, Jarrelli GA, Kim EH., “On the
Existence of an Optimal Capital Structure: theory
& evidence”. T. J. Financ., 39 (1984) 3, 857.
[19] Kraus, Alan, and Robert H. Litzenberger,
“Skewness preference and the valuation of risk
assets”, The Journal of Finance 31 (1976) 4, 1085.
[20] Harris, Milton and Artur Ravrv., “The theory
of capital structure”, Journal of Finance, 46
(1991), 297.
[21] Fischer EO, Heinkel R, Zechner J., “Dynamic
Capital Structure Choice: Theory and Tests”, J.
Financ., 44 (1989), 19.
[22] Booth LV, Aivazian V, Demirguc-Kunt A,
Maksimovic V., “Capital structure in developing
countries”, The Journal of Finance, Vol. LVI,
(2001) 1.
[23] Eriotis Nikolaos, “How firm characteristics
affect capital structure: An empirical Study”,
Managerial Finance, 33 (2007) 5, 321.
[24] Faris AL- Shubiri, “Determinants of Capital
Structure Choice: A Case Study of Jordanian
Industrial Companies”, An-Najah Univ. J. of
Res. (Humanities), 24 (2010) 8, 2457.
[25] Bambang Sudiyatno and Septavia Mustika Sari,
“Determinants of debt policy: An empirical
studying Indonesia stock exchange”, International
Research Journal, 4 (2013) 1, 98-108.
[26] Fama EF, French KR. “Testing trade-off and
pecking order predictions about dividends and
debt”, The Review of Financial Studies, 15
(2002) 1, 1.
[27] Jong AD, Kabir R, Nguyen TT, “Capital
structure around the world: the roles of of
firm-and country-specific determinants”, Journal of
Banking Finance, 32 (2008) 9, 1954.
[28] Sharif et al., “Firm’s characteristics and capital
structure: A panel data analysis of Pakistan’s
insurance sector”, African Journal of Business
Management, 6 (2012) 14, 4939.
[29] Afza Talat, Amer Hussain, “Determinants of
Capital Structure across Selected Manufacturing
Sectors of Pakistan”, International Journal of
Humanities and Social Science, 1 (2011)
12, 254.
</div>
<!--links-->
andrew willis - the insiders guide to trading the world stock markets
- 92
- 747
- 0


.push({});</script> </div> </div> </div> <div class="vf_link_relate px-2 my-2"> <h2 class="vf_doc_relate text-2xl font-bold my-4">Tài liệu liên quan</h2> <ul class="grid grid-cols-12 gap-2"> <li class="col-span-6 md:col-span-2"> <div class="card-doc " onclick="actionDocRelated(this)"> <a class="card-doc-img" href="https://text.123docz.net/document/1325318-andrew-willis-the-insiders-guide-to-trading-the-world-stock-markets.htm" title="andrew willis - the insiders guide to trading the world stock markets"> <i class="icon i_type_doc i_type_doc2"></i> <img class="lazy" src="data:image/gif;base64,R0lGODlhAQABAIAAAP///wAAACH5BAEAAAAALAAAAAABAAEAAAICRAEAOw==" data-src="https://media.store123doc.com/images/document/14/ri/jd/medium_jdm1398244296.jpg" width="124" height="179" alt="andrew willis - the insiders guide to trading the world stock markets" onerror="this.src=)