Development of Water Quality Index for Coastal Zone and Application in the Hạ Long Bay
Bạn đang xem bản rút gọn của tài liệu. Xem và tải ngay bản đầy đủ của tài liệu tại đây (605.55 KB, 24 trang )
<span class='text_page_counter'>(1)</span><div class='page_container' data-page=1>
4
Development of Water Quality Index for Coastal Zone
and Application in the H
aạ
Long Bay
Nguyễn Thị Thế Nguyên
1,<sub> *, Đồng Kim Loan</sub>
2<sub> , Nguyễn Chu Hồi</sub>
2<sub> </sub>
*<sub> </sub>Nguyen Thi The Nguyen
*,1<sub>, Dong Kim Loan</sub>
2<sub>, Nguyen Chu Hoi</sub>
2*1
Water Resources University
2<sub>VNU University of Science</sub>2<sub> VNU University of Science, 334 </sub><sub>Nguyen TraiNguyễn Trãi, Thanh Xuân</sub><sub>,</sub>
Hanoi, Vietnam
Received 05 October 2013
Revised 14 November 2013; Accepted 15 December 2013Received 6 Frbruary 2013
Revised 16 March 2013; Accepted 20 June 2013
<b>Abstract: In this study, a water quality index (WQI</b>HL) <b>has beenwas</b> developed in accordance with
the nature of coastal zone and applied to assess the water quality in Ha Long Bay. The <b>nN</b>ine
parameters, including %DOsat (0.08), COD (0.11), TOC (0.08), oil and grease (0.17) total
coliforms or feacal coliform (0.07), TSS (0.17), TN or NH4 (0.11), TP or PO+ 43- (0.11) and
chlorophyll a (0.11) are employed for the estimation of water quality. <b>The Nn</b>umbers in the
parentheses <b>areindicate</b> weight of each parameter. Sub-indices are built based on the QCVN
10:2008/MONRE, the standards on coastal water quality of ASEAN, Australia, Japan … and other
requirements <b>offor</b> water quality <b>forin</b> marine ecosystems. <b>The aA</b>ssessment of the eclipsing and
ambiguous effects and the sensitivity of four aggregation functions reveal that the weighted
geometric mean function is the most appropriate to calculate WQIHL with the selected weights. The
application of the developed WQIHL in the H<b>aạ</b> Long Bay shows that the water quality in the core
zone is good, except some tourist areas and fishing villages. The buffer zone of the Bay possesses
poor water quality. The WQIHL formula can be a good tool for water quality management and
planning<b>,</b> which support<b>s</b> for the integrated coastal zone management.
<i>Keywords: Water quality index, weighted geometric mean function, coastal zone, H</i><b>aạ</b> Long Bay.
1. Introduction<b> *</b>
The use of water quality index gained
acceptance in many years before. It is a tool to
improve understanding of water quality issues
by integrating complex data and generating
different levels that describes water quality
status and evaluates water quality trends [1]
[16]. In this way, the index can be used to
assess water quality relative to its desirable
state (as defined by water quality objectives)
* <sub> Corresponding author. Tel.: 84-983033532</sub>
E-mail:
and to provide insight into the degree to which
water quality is affected by human activity.
Although some information is lost when
integrating multiple water quality variables,
this loss is outweighed by the gain in
understanding of water quality issues by the
public and decision makers [2]. [14].
</div>
<span class='text_page_counter'>(2)</span><div class='page_container' data-page=2>
Vietnam, there is not any study about WQI for
the coastal area.
In this study, a WQI is developed suitably
with coastal zone conditions and tried to apply
in assessment of water quality in the Ha Long
Bay. Coastal characteristics and issues in the
Ha Long Bay are taken into account during the
WQI development. Therefore, the study result
is significant for tasks of environmental
assessment, planning and management in the
coastal zone.
<b>2. Methodology</b>
There are four steps involved in the
development of most water quality indices [1,
3] [16], .. These include: (1) selecting the set
of water quality parameters
(indicators/variables) of concern, (2) weighting
the indicators based on their relative
importance to overall water quality, (3)
developing sub indices for comparing
indicators on a common scale (Indicator
transformation), and (4) formulating and
computing the overall water quality index
(Aggregation function).
<i>2.1. Indicator selection </i>
There are six criteria for a meaningful
variable [4] [18], including: (1) Water quality
variables that are widely and regularly
measured; (2) Variables that have clear effects
on aquatic life, recreational use, or both; (3)
Variables that have man-made sources as
opposed to natural sources; (4) Variables those
are amenable to control through pollution
abatement programs, (5) Realistic ranges of
each variable - from no pollution to gross
pollution, (6) Sensitivity to reasonably small
changes in water quality. In addition, Dunnette
(1979) and Tebbutt T.H.Y (2002)
recommended that variables of concern should
be selected from 5 commonly recognized
impairment categories like (1) oxygen status
and demand, (2) eutrophication, (3) health
aspect, (4) physical characteristics, and (5)
solid substances [5-7]. [15], [17], .
<i>2.2. Indicator weighting</i>
It is also generally acknowledged that
some indicators are more important to
“average water quality” than others [8] . It is
thus necessary to weight the indicators
appropriately. In this study, the weight of the
indicator is determined through importance
and roles of the indicator to aquatic system and
current status of that parameter in the Ha Long
Bay. Temporary weight is developed by
dividing the significant rating by the average
significance rating of individual parameters.
Then, weighting scale for each parameter is
defined as the ratio of temporary weight to the
sum of temporary weights. Final weight
(Weighting scale) is obtained by
approximating the ratio of temporary weight
for each variable to the sum of temporary
weights [4]. [18].
<i>2.3. Indicator transformation </i>
</div>
<span class='text_page_counter'>(3)</span><div class='page_container' data-page=3>
1-10
quality standards and criteria of ASEAN,
Thailand, Indonesia, Japan, Australia [9] [13],
and (3) Requirements of water quality for coral
reef and seabed grass.
<i>2.34. Aggregation function</i>
The aggregation process is one of the most
important steps in calculating any
environmental index. Generally, aggregation
functions, either additive or multiplicative
forms, are suffered from both eclipsing and
ambiguous effects [1] [16]. There are some
kinds of functions to calculate an aggregated
score (index score) for WQI. To minimize the
ambiguity and eclipsing effect, it is necessary
to identity an appropriate function for
calculating an aggregated score. Four kinds of
functions have been considered in this study.
They are the weighted Solway function [8] ,
the weighted arithmetic mean function [10] ,
the weighted geometric function [10] <i> and the</i>
weighted harmonic mean function [1]. [16].
<b>3. Results and discussions</b>
<i>3.1. Variable selection </i>
<b>(1)</b> <b>Oxygen status and demand: Indicator</b>
for the oxygen status in water body is %DOsat.
Organic matter has the greatest impact on
dissolved oxygen concentrations [11]. [11].
Consequently, COD and oil and grease should
be taken into account. Oil pollution prevents
not only oxygen in atmosphere from dissolving
into the sea water but also phytoplankton from
catching carbonic in atmosphere for
photosynthetic reaction. In addition, the
process of biodegradation of oil makes some
microorganisms more active and then reduces
the amount of oxygen in the water. TOC is
also an important parameter is selected as the
Vietnamese coast receives many organic
pollutants and grease. The TOC content is a
measure of the concentration of organically
bound carbon and is therefore a direct
indication of the pollution levels by organic
compounds [12]. [12].
<b>(2) Eutrophication: the indicators for the</b>
eutrophication are: TN, NO3- , NO2- , NH4+ , TP,
PO4 and chlorophyll-a. The chosen indicators
3-are TN, TP, and chlorophyll-a. The two
parametters TN and TP can be replace by NH4 +
and PO43- . The two parameters NO3- , NO2 can-
be ignored in calculating the WQI for coastal
waters for the following reasons: Due to tidal
activity in the coastal zone, NO2- is not high
and easily transformed into NO3- . High
concentration of NO3- makes algae flourish and
thereby causes adverse effects to the
environment if the eutrophication occurs.
Then, chlorophyll a is a more important
parameter to measure the eutrophic state than
NO3- .
<b>(3) Health aspect: The parameters in this</b>
</div>
<span class='text_page_counter'>(4)</span><div class='page_container' data-page=4>
areas having water sports activities [9] [13].
Currently, the total coliforms is monitoring
quite often so that it is convenient for
evaluation of microbial pollution in general.
However, to strictly control the quality of the
coastal water used for aquatic sports activities
such as swimming or water skiing, the fecal
coliform parameter is more important and
should be included in monitoring programs.
<b>(4) Physical characteristics: While the</b>
importance of this category is evident for
freshwater systems, the meaning of physical
characteristics in term of coastal zone is not
significant for coastal water [8] .
Due to the dynamic nature of estuarine and
coastal water masses under “normal”
conditions, physical characteristics in that
water bodies are highly variable and could not
be controlled. The pH is strongly controlled by
the mixing of marine and fresh water [5] [15].
Given the buffering capacity of sea water, the
pH of river water entering an estuary will be
driven to 8. Thus, the pH of estuarine and
coastal water generally increases towards the
sea. Salinity (measure of total dissolved solids)
is a much more important indicator of the
extend of seawater mixing than water quality
impairment [5] [15]. In fact, it is the brackish
nature of estuarine and coastal water that
makes this habitat unique and contributes to its
resource value. Temperature of coastal water
greatly depends on solar energy, mixing of sea
currents and other water than human impacts.
Consequently, this parameter is not considered
as pollutant. However, oxygen concentration in
water body will decrease when the temperature
raises. Thus, the temperature should be taken
into account in process of oxygen
concentration determination.
As a consequence of above, the parameters
of the physical characteristics are not chosen
for WQI in the coastal zone.
<b>(5) Solid substances. The selected</b>
parameter is total suspended solids (TSS). In
the water, TSS consists of organic matter,
minerals, heavy metals, sulfur, algae (including
toxic algae), and bacteria (including
pathogenic bacteria). TSS contributes to
turbidity of the water and reduces not only the
amount of transmitted light needed for
photosynthesis but also the landscape of the
coast. High TSS concentration (above 20 mg/l)
will degrade or can destroy mangrove, coral
reefs, sea grass ecosystems.
The selected parameters for the WQI for
the coastal zone are summarized in the table 1.
<i>3.2. Indicator weighting</i>
The weights of parameters are determined
depending on whether they have direct or
indirect effects on the ecosystem. Two types of
parameters that directly affect aquatic
ecosystems can be distinguished: those that are
directly toxic to biota, and those that, while not
directly toxic, can result in adverse changes to
the ecosystem [11] [11]. The parameters that
directly affect aquatic ecosystems have higher
weight than those that, while not directly toxic,
can result in adverse changes to the ecosystem.
The detail importance and final weights are
shown in the table 1.
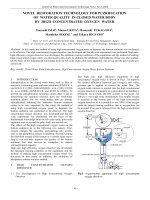
<i>3.3. Sub-indices</i>
Sub-indices (qi) are within the range 1-100
</div>
<span class='text_page_counter'>(5)</span><div class='page_container' data-page=5></div>
<span class='text_page_counter'>(6)</span><div class='page_container' data-page=6>
Table 1. 1 The selected parameters for the WQI in the coastal zone and their weights
No. Parametter Importance Temporary <sub>weight</sub> Final <sub>weight</sub> Note
1 Oil and grease; <sub>TSS</sub> 1 2.5 0.17 Stressors directly toxic to marine<sub>ecosystems</sub><sub> [11] </sub><sub>[11]</sub>
2
COD, TN (or
NH4+ ), TP (or
PO43- ), chlorophyll
a
1.5 1.7 0.11 Stressors that are not directly toxic but candirectly affect marine ecosystems [9, 11]
[11][13]
3 TOC 2 1.3 0.08
- Assess the level of organic pollution
which is major pollution problem in the Ha
Long Bay
4 Total coliforms (orFeacal coliform),
DO 2.5 1 0.07
- Total coliforms (or Feacal coliform)
directly toxic to human being [9][13]
- DO affect process of respiration of
marine creature [9, 11] [11][13]
Table 2. 2 Sub-index values (qi)
i qi
Concentration values (Ci) for each parameter
TOC
(mg/l) (mg/l)COD DO%sat Oil and grease(mg/l) (mg/l)TN (mg/l)TP
1 100 ≤ 1.2 ≤ 3 100 0 ≤ 0.25 ≤ 0.02
2 67 1.6 4 65 or 140 0.1 0.35 0.05
3 34 10 25 40 0.2 0.75 0.5
4 1 > 20 > 50 20 > 0.3 > 1.5 > 1
i qi PO4
3—
P
(mg/l)
NH4+ -N
(mg/l)
Chla
(µg/l)
T. Coli
(MPN/100ml)
F. Coli
(F.Coli/100ml)
TSS
(mg/l)
1 100 ≤0.015 ≤ 0.1 ≤ 1.4 ≤500 ≤100 ≤ 20
2 67 0.045 0.3 3 1000 - 50
3 34 0.08 0.5 10 - 500
</div>
<span class='text_page_counter'>(7)</span><div class='page_container' data-page=7>
1-10
Figure 1. The sub-index transformation curses of each selected variable.
dg
<i>3.4. Aggregation function</i>
In this study, for the purpose of
minimizing the eclipsing and ambiguous
effects on the formulation for WQI, the four
<i>aggregation functions, including the Solway</i>
<i>function, the weighted arithmetic mean</i>
<i>function, the weighted geometric function and</i>
<i>the weighted harmonic mean function, were</i>
chosen to compare the eclipsing and
ambiguous effects on the final results of WQI.
These functions are widely used to develop
WQI over the world. The aggregation function
should be also sensitive to small changes in
water quality.
</div>
<span class='text_page_counter'>(8)</span><div class='page_container' data-page=8>
Table 3. <b>3 General assessment of the average functions</b>
TT Property Weighted
arithmetic Weighted geometric Weightedharmonic Weighted Solway
1 Easy to apply 4 4 2 3
2 Ambiguous 4 3 2 1
3 Eclipsing 1 3 4 4
4 Sensitive 1 3 3 4
Sum 10 13 11 12
<b>Table 4. 4 Thresholds ofwaterqualityclassification</b>
No. Threshold States of parameters in comparison with the allowance in the QCVN
10:2008/BTNMT and others
Upper limit 100
1 Excellent From good threshold to 100
2 Good One water quality parameter exceed allowance for aquaculture and aquatic
conservation (qi = 67) or qi min ≥ 67
3 Medium One water quality parameter exceed allowance for beach or areas for recreation
activities with directed water contact (qi = 34)
4 Bad One water quality parameter exceed allowance for “other areas” like ports … (qi = 1)
5 Very bad Three water quality parameters exceeds allowance for “other areas” like ports …(qi = 1)
Lower limit 1
Table 5. 5 Water quality classification and usages
No. WQIHL Water quality Water use ability
1 97 - 100 Excellent Can be used for any purpose.
2 92 – 96 Good Can be used for any purpose, except protection of aquatic<sub>life or special aquaculture </sub>
3 70 - 91 Medium Tourism, recreation without direct water contract, ports <sub>and navigation, industrial water supply</sub>
4 35 - 69 Bad Ports and navigation, industrial water supply or other <sub>purposes which do not need high water quality. </sub>
5 1- 34 Very bad Ports and navigation only
gj
Based on the analysis results in Table 3, the
weighted geometric mean function has the highest
score. Consequently, the weighted geometric mean
is use to build WQI for the coastal zone. With the
selected weights in this study, the weighted
geometric mean has a small eclipsing and
ambiguous effects and a high sensitivity. In
addition, the weighted geometric mean is easy to
apply in the comparison to the harmonic mean or
the Solway. Finally, the WQI for the coastal zone is
following:
WQI HL =
n
i
1
1/ w
1
( <i>i</i>)
<i>n</i>
<i>w</i>
<i>i</i>
<i>q</i>
In which, qi and wi are the sub-indices and
weights of the chosen parameters which shown
in the table 1.
<i>3.5. Water quality classification and range</i>
<i>scales </i>
</div>
<span class='text_page_counter'>(9)</span><div class='page_container' data-page=9>
1-10
parameters violating the allowable limits. WQI
values are divided into 5 ranges which are very
good, good, medium, bad and very bad as
shown in table 4. Waterqualityclassification is
calculated by the WQI HL formula with the
thresholds in the table 4. The final results of
water quality classification are summarized in
table 5.
<i>3.6. Application in assessment of water quality</i>
<i>in the Ha Long Bay</i>
<i>* Data: Monitoring data at 12 points in</i>
4/2013 (table 6) and at 32 points in 8/2013 in
the Ha Long Bay.
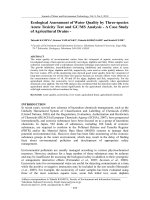
<i><b>* </b><b>Results and discussions</b><b>::</b></i> The example
results are shown in table 6 and figure 1. It can
be seen that the water quality in the buffer
zone of the bay is from very bad to medium,
while that in the core is still good to very good.
However, there is local pollution in the core
zone, especially at the tourist areas and fishing
villages. In the figure 1, that locations are
monitoring point number 11 (Thien Cung –
Dau Go islands), 12 (Titop island), 17 (Cong
Do area), 19 (Hoa Cuong fishing village), 20
(Cua Van fishing village).
The calculation results also reveal that
there are differences between the three
calculation methods. For example at the
monitoring point of Cua Van fishing village,
the two formulas WQIHL and WQIPNH show
that the water quality is very good, whereas the
CWQI formula gives bad result. Monitoring
results here show that most of the water quality
parameters are within the allowable limits,
only COD value (3.1 mg/l) was slightly higher
than the allowance (3 mg/l) of QCVN
10:2008/BTNMT for aquatic conservation
areas. The CWQI formula results in poor water
quality due to the parameter F1 (% ratio
between the number of failed parameters and
the total number of parameters) affects largely
to the final results. This is one of the
limitations pointed out in the workshop on
water quality indicators in Canada in 2003
[14].
It can be concluded that the usage of the
WQIHL to evaluate and classify the water
quality in the Ha Long bay with monitoring
data in 4/2013 and in 8/2013 gives quite
reasonable results. Still it needs more testing
with other monitoring sites in the coastal zone
of Vietnam.
Table 6. 6 Some examples of the water quality classification in the Ha Long Bay
in 4/2013
with different WQI formula
<b>No.</b> <b>Monitoring point</b> <b>WQIHL</b> <b>CWQI</b> <b>WQI P.N.H</b>
1 Bang bridge 69 Medium 37 Bad 88 <sub>Medium</sub>Bad to
2 At the middle of Cua Luc Bay 48 Bad 27 Bad 54 Medium
3 Bai Chay bridge 55 Bad 29 Bad 71 Medium
4 Bai Chay beach 60 Bad 20 Bad 32 Very bad
5 Bai Chay tourist wharf 30 Very bad 29 Bad 61 Medium
6 Tuan Chau beach 66 <sub>Medium</sub>Bad to 20 Bad 33 Very bad
</div>
<span class='text_page_counter'>(10)</span><div class='page_container' data-page=10>
8 Pillar 5 - pillar 8 56 Bad 33 Bad 75 Medium
9 Nam Cau Trang wharf 49 Bad 40 Bad 50 Bad
10 Islet 1 100 Excellent 100 Excellent 100 Excellent
11 Titop beach 96 Excellent 100 Excellent 100 Excellent
12 Cua Van fishing village 98 Excellent 41 Bad 97 Excellent
Color WQI
Water
quality
clarification
97-100 Excellent
92-96 Good
70-91 Medium
35-70 Bad
1-34 Very bad
Figure 1. Some examples of the water quality classification in the Ha Long Bay in 8/2013.
3.7. Overall assessment of the water
quality index for the coastal zone
The WQIHL is evaluated following 15
characteristics that an ideal water quality index
should possess [10] . . Evaluation results show
that the WQIHL formula has met 13 out of 15
characteristics for the ideal water quality index
recommended by the Environmental Protection
Agency of the U.S. This is due to the keeping
abreast of the recommended characteristics in
the construction of the WQIHL. Thus, the
WQIHL formula can be used to assess the status
and changes in water quality in the coastal
zone and serve the management and
conservation natural ecosystems here.
<b>4. Conclusion</b>
In this study, the water quality index has
been built in accordance with the nature the
coastal zone in Ha Long Bay. The index
consists of 9 parameters, including %DOsat
(0.07), COD (0.11), TOC (0.08), oil and grease
(0.17) total coliforms or feacal coliform (0.07),
TSS (0.17), TN or NH4 (0.11), TP or PO+ 43-
(0.11) and chlorophyll a (0.11). The weighted
geometric mean function is used to integrate
sub-indices. The WQIHL provides a convenient
way for evaluating the water quality of the
coastal zone in terms of the specific water use
for marine ecosystem protection and human
contact, and comparing water quality among
different areas of the coast. The application of
the developed WQIHL shows that the water
environment in the core zone of Ha Long Bay
is good, except some points that concentrate
tourist activities and fishing villages. The core
zone currently is subjected to damage by the
poor water quality in the buffer zone which is
</div>
<span class='text_page_counter'>(11)</span><div class='page_container' data-page=11>
1-10
currently impacted by socio - economic
activities in Ha Long city.
<b>References</b>
[1] Cude Curtis G. (2001). Oregon water quality: A
tool for evaluating water quality management
effectiveness. Journal of American Water
Resources Association. Vol. 37, No. 1, pages 125
– 137.
[2] CCME (2003). National Water Quality Index
Workshop Proceedings, Halifax, Nova Scotia,
Canada.
[3] Ram Pal Singh et al. (2008). “Selection of
Suitable Aggregation Function for Estimation of
Aggregate Pollution Index for River Ganges in
India”, Journal of Environmental Engineering,
Vol 134, No. 8, August 1 (2008). ©ASCE, ISSN
0733-9372/2008/8-689–701.
[4] Ott W.R (1978). Environmental indices theory
and practice. Ann Arbor Science. Michigan,
USA.
[5] Cooper J. A. G. (2000). Geomorphology,
ichthyofauna, water quality and aesthetics of
South African estuaries. Technical report.
Department of Environmental Affairs & Tourism
of South Africa.
[6] Dunnette, D.A. (1979). A geographically variable
water quality index used in Oregon. Journal of
Water Pollution Control Federation 51(1), pages
53-61.
[7] Tebbutt T.H.Y (2002). Principles of Water
Quality Control. Butterworth Heinemann (An
imprint of Elservier Science).
[8] Tim Carruthers and Catherine Wazinak (2004).
Development of Water Quality Index for
Maryland Coastal Bays. Maryland Department of
Natural Resources. Annapolis, MD 21401. US.
[9] ASEAN Secretariat (2008). ASEAN Marine
Water Quality: Management Guidline and
Monitoring.
[10] U.S. EPA (1978). Water Quality Indices: A
survey of indices used in the United States. U.S.
Environmental Protection Agency.
[11] ANZECC & ARMCANZ (2000). Australian
water quality guidelines for fresh and marine
waters. Australian and New Zealand
Environment and Conservation Council
Agriculture and Resource Management Council
of Australia and New Zealand. Canberra,
Australia.
[12] APHA (2005). Standard methods for the
Examination of Water and Wastewater. 21st
Edition. American Public Health Association,
Washington, D.C.
[13] ASEAN Secretariat (2008). ASEAN Marine
Water Quality: Management Guidline and
Monitoring
[14] CCME (2003). National Water Quality Index
Workshop Proceedings, Halifax, Nova Scotia,
Canada.
[15] Cooper J. A. G. (2000). Geomorphology,
ichthyofauna, water quality and aesthetics of
South African estuaries. Technical report.
Department of Environmental Affairs & Tourism
of South Africa.
[16] Cude Curtis G. (2001). Oregon water quality: A
tool for evaluating water quality management
effectiveness. Journal of American Water
Resources Association. Vol. 37, No. 1, pages 125
- 137
[17] Dunnette, D.A. (1979). A geographically variable
water quality index used in Oregon. Journal of
Water Pollution Control Federation 51(1), pages
53-61
[18] Ott W.R (1978). Environmental indices theory
and practice. Ann Arbor Science. Michigan,
USA
[19] Pham Ngoc Ho (2012), Total Water Quality
Index Using Weighting Factors and Standardized
into a Parameter. Available online at
www.tshe.org/EA EnvironmentAsia 5(2) (2012)
63-69
Ram Pal Singh et al. (2008). “Selection of Suitable
Aggregation Function for Estimation of Aggregate
Pollution Index for River Ganges in India”,
Journal of Environmental Engineering, Vol 134,
No. 8, August 1 (2008). ©ASCE, ISSN
0733-9372/2008/8-689–701
U.S. EPA (1978). Water Quality Indices: A survey
of indices used in the United States. U.S.
Environmental Protection Agency
</div>
<span class='text_page_counter'>(12)</span><div class='page_container' data-page=12>
[20]
[21]
[22]
Xây dựng chỉ số chất lượng nước cho vùng ven biển
và áp dụng đánh giá chất lượng nước vịnh Hạ Long
Nguyễn Thị Thế Nguyên
1<sub> </sub>
*,<sub> </sub>
1<sub>, Đồng Kim Loan</sub>
2<sub> </sub>
2<sub>, Nguyễn Chu Hồi</sub>
2*<sub> </sub>
21
<i>1<sub>Đại học Thủy Lợi</sub></i>
2
2<i><sub>Trường </sub><sub>Đại học Khoa học Tự nhiên</sub><sub> – Đại học Quốc gia Hà Nội, ĐHQGHN, 334 Nguyễn Trãi, Thanh</sub></i>
<i>Xuân, Hà Nội, Việt Nam</i>
Received 6 Frbruary 2013
Revised 16 March 2013; Accepted 20 June 2013
<b>Tóm tắt: Trong nghiên cứu này, chỉ số chất lượng nước (WQI</b>HL) đã được xây
dựng phù hợp với tính chất của vùng biển ven bờ và áp dụng để đánh giá chất
lượng nước vịnh Hạ Long. Các thông số sử dụng để tính tốn WQI là %DOBH
(0.07), COD (0.11), TOC (0.08), dầu và mỡ (0.17) tổng coliforms hoặc feacal
coliform (0.07), TSS (0.17), TN hoặc NH4+ (0.11), TP hoặc PO43- (0.11) và
chlorophyll a (0.11). Trọng số của các thông số được ghi trong dấu ngoặc. Các chỉ
số phụ được xây dựng dựa trên QCVN 10:2008/MONRE, các tiêu chuẩn chất
lượng nước biển ven bờ của ASEAN, Australia, Nhật … và các yêu cầu chất
lượng nước cho các hệ sinh thái biển. Q trình đánh giá tính mơ hồ, tính che
khuất, độ nhạy và mức độ dễ tính tốn của các phương pháp tổng hợp chỉ số phụ
thường dùng cho thấy hàm tích có trọng số là phương pháp tổng hợp thích hợp
nhất để tính WQIHL. Việc áp dụng cơng thức WQIHL để đánh giá chất lượng nước
</div>
<span class='text_page_counter'>(13)</span><div class='page_container' data-page=13>
1-10
những công cụ hiệu quả trong quản lí và phân vùng chất lượng nước nhằm phục
vụ q trình quản lí tổng hợp vùng bờ.
<i>Từ khóa:</i>Cchỉ số chất lượng nước, tích có trọng số, vùng ven bờ, vịnh Hạ Long.
.
Geochemical
characteristics
of Quaternary sediments
in the
Hanoi area
Dang Mai1,*, Nguyen Thuy Duong1, Tong Thi Thu Ha2, Dang Quang Khang1, Nguyen Van Niem2, Dinh Xuan
Thanh1
1<sub>Falculty </sub><sub>of Geology, VNU University of Science, 334 Nguyen Trai, Hanoi, Vietnam</sub><sub> </sub>
2<sub>Vietnam Institute of Geosciences and Mineral Resources</sub>
Nhận ngày 01 tháng 4 3 năm 2013
Chấp nhận xuất bảnChỉnh sửa ngày 029 8 tháng 4 năm 2013; chấp nhận đăng ngày 07 tháng 5 năm 2013
<b>Abstract. 17 samples collected from two drill holes (QO.01 and QO.03) at Quoc Oai (Hanoi)</b>
were analysed the main chemical compositions in oxides SiO2, TiO2, Al2O3, Fe2O3, MnO,
MgO, CaO, Na2O, K2O by XRF method and some trace metal elements such as As, Cu, Pb,
Zn, Sb, V, Cr, Ni, Cd by AAS method. According to these results, content of SiO2, Al2O3,
Fe2O3 are the highest, the next is K2O, TiO2 and the other oxides are very low. The
sediments in the Vinh Phuc formation have rich Fe2O3 by laterization, whereas those in the
Hai Hung formation have rich K2O by the potassium-absorption in the organic matters. In the
sediments, there are close relationship between the alkaline and alkaline earth elements, and
the titan oxide is positively correlative with Al2O3 and Fe2O3.
The arsenic content in almost samples is higher than 10mg/kg, somewhere else up to 41 mg/kg, exceeding
many folds compared to the average level found in the earth’s crust and in the clay sedimentary. The antimony content
(Sb) is also increased high with the clark index from 8.06 to 125.6 mg/kg. The behaviors of As, Cu, Pb, Zn are very
similar to each other in the samples of 02 holes QO.01 and QO.03, that is highly concentrated in the upper
sediments of the Vinh Phuc formation and in the rich-organic lower sediments of the Hai
Hung formation. It seem probable that As is existed as sulfur phases and absorbed by the
organic materials. It is able to infer sedimentary source and accumulated arsenic content from
the linear correlation coefficient between siderophile and Cu, As, which, as a basic for
judging the cause pollution of Hanoi groundwater.
<i>Keywords: Vinh Phuc formation; arsenic, antimony, copper; siderophile elements; drill hole;</i>
Hanoi area
1. Introduction
According to finding of researcher at Vietnam and abroad, arsenic concenstrations in the groundwaters of the
Holocene and Pleistocene layers in Hanoi is very high, at many sites higher than the level permitted
<sub>Tác giả liên hệ. ĐT: 84-4-38584943.</sub>
</div>
<span class='text_page_counter'>(14)</span><div class='page_container' data-page=14>
by the World Health Organization (WHO) (Do Trong Su, 2000; Pham Hung Viet, 2001; Nguyen
Van Dan, 2004; Nguyen Kim Dung, 2006; Berg.M., 2008: Norman J., 2008). Arsenic
concenstrations in water well in Hoai Duc, Phu Xuyen, Thuong Tin is more than 100g/l that
is exceeded 10 time comparing to WHO’s criteria. According to Bui Huu Viet (2010) soil in
the west of Hanoi has been polluted by heavy elements, such as As, Cu, Ni, Mn, Cr, Zn, Cd.
Content of trace elements found in the soil and the water have a close relationship with the
host rocks that first of all is the Quaternary sedimentary. Indeed, on the causes of arsenic
contamination, most researchers cling to the point of view that, the arsenic found in
groundwater originated from the Quaternary sediments [1, 3, 5, 6, 9, 10]
In order to find more evidences and to know geochemical characteristics at the soil of the
Quaternary sediments in the Hanoi, arsenic and heavy metal elements concentration were
researched in Quaternary sediments of Quoc Oai (Hanoi).
2. Methods
The sediment samples were collected in 3 deep drill holes, which belonged to project
VINOGEO. One of 3 drill holes that names QO.03 was in Tam village, Thach Than
commune, Quoc Oai district (Ha Noi) and the othes were ịn Quoc Oai district (Ha Noi). The
depths of the drill holes were 48, 53 and 42 m. The drill hole samples were collected about
300gr for each 1m depth and packaged in the polypropylene bags at the sites.
The major elements and some heavy metals (such as: V, Cu, Cr, Ni, Sr, Ba, Zn, Rb, Zr)
chemical compositions of sedimentary were determined by X-ray Fluorescent (XRF Philips
2404). The heavy metals, such as As, Pb, Cu, Zn, Cd, were analyzed by atomic absorption
spectrometry method (AAS). As was analysed on an atomic absorption spectrometry device
employing a graphite burnt furnace (Perkin-Elmer 4110 ZL Zeeman), and the other elements
were determined by a flame absorption spectrometry (Analytik Jena, AAS Vario 6).
3. General ideas on the Quaternary sediments at the Hanoi area
The Quaternary sediments in Ha Noi belong to 5 formations whose age were from early
Pleistocene to Holocene, such as: 1) Le Chi formation; 2) Ha Noi formation; 3) Vinh Phuc
formation; 4) Hai Hung formation and 5) Thai Binh formation (Ngo Quang Toan et al, 1998).
The Le Chi formation (<i>Q lc</i>11 <sub>): includes early Pleistocene’s fluvial deposits; was not appear in</sub>
the surface and only found them in drill holes at depths from 45 to 80m. Their thickness was
from 2.5 to 24.5m. The lithological compositions of the Le Chi formation include: pebble (quartz,
silica, marble), gravel, sand, silt, brown-gray clay …
The Ha Noi formation (Q12-3<i>hn), that aged in middle-late Pleistocen, was formed from the</i>
</div>
<span class='text_page_counter'>(15)</span><div class='page_container' data-page=15>
1-10
underground water containing object of the Hanoi. In relationship to other formations, the Ha Noi
formation lies unconformable upon the Le Chi formation and was covered unconformable by
the Vinh Phuc formation.
The Vinh Phuc formation (Q13vp), which was formed in late-Pleistocene, occurred as the first
bench (the area exposed on the surface) and widely distributed at Soc Son, Dong Anh, Thach
That, Quoc Oai, Chuong My, Xuan Mai and Co Nhue. They were at the absolute altitude of
8-20m; whereas down in the plains, from South Dong Anh, Co Nhue to further south, they were
appeared at 2-26.5 m deep of the drill holes. The sedimentary origin of the Vinh Phuc
formation were fluvial, fluviolacustrine, fluviomarine. Material of fluvial deposit includes
gravel, sand, quartz sand, silt, clay. Their structure was oblique lamination. The laterized sedimentary surface
was mottled yellow-gray and brown-red. The fluviolacustrine was restrictedly distributed and
includes silt, gray and dark-gray clay, white-gray kaolin clay containing late-Pleistocene floral
relics. The composition of fluviomarine was silty clay mixed with gray sand. Their surface
was weathered mottled.
In Hanoi area, the origin of Hai Hung formation (Q21-2<i>hh) was bog lake, fluviomarine and</i>
marine. The bog lake sediment whose material was dark gray silty clay containing floral relics
and lens-shaped peat, was formed before the Flandrian transgression. The components of the
fluviomarine sediments mainly include silty clay fixed fine-grained sand, dark gray silty sand, peat
<b>containing floral relic and foraminifera that was appeared in the early-middle Holocene. The</b>
marine sediments belong to lagoon phase mainly include clay, silty clay mixed with a little
fine-grained sand that is green gray or yellow gray, plastic and smooth. The clay mineral
association are: hydromica, kaolinite, montmorilonite, chlorite
The Thai Binh formation (Q23<i>tb) includes the modern sediments that was formed after the</i>
marine regression period. The formation’s deposits belong to the inner-dyke and outer-dyke
alluvial facies. Their composition was sand, silt, clay, gravel, pebble, grit.
4. Results and discussion
Major compositions
[1] Table 1. Oxide contents (% wt.) of Quaternary sediments in Hanoi area
Samples Drill
hole
Depth
</div>
<span class='text_page_counter'>(16)</span><div class='page_container' data-page=16>
NH.30 QO-01 44.7 60.03 1.97 19.33 8.49 0.06 0.58 0.18 0.08 1.66
NH.65 QO-03 3.7 71.96 0.67 10.20 7.21 0.10 0.94 0.44 0.73 2.00
NH.66 QO-03 4.3 57.00 0.86 21.43 6.19 0.08 1.67 0.34 0.45 3.32
NH.69 QO-03 8.3 60.10 0.88 17.32 5.03 0.04 1.72 0.49 0.61 2.94
NH.71 QO-03 9.8 68.26 0.74 14.28 6.77 0.03 0.64 0.22 0.13 1.97
NH.72 QO-03 12.3 75.76 0.62 11.08 4.45 0.03 0.49 0.14 0.12 1.91
NH.75 QO-03 19.2 72.20 1.85 15.25 2.07 0.02 0.53 0.08 0.10 1.40
NH.76 QO-03 20.8 68.54 1.91 16.90 3.44 0.02 0.56 0.10 0.10 1.43
NH.77 QO-03 22.0 23.67 1.59 10.93 51.67 0.12 0.21 0.19 0.07 0.41
High contents were SiO2, Al2O3 and Fe2O3, next was K2O, TiO2 the other oxides were very
low, especially MnO (table 1). In average, SiO2 was the highest in the Thai Binh formation
(71.96%), next was in the Hai Hung formation (62.06%) and was the lowest in the Vinh Phuc
formation (54.1% - table 3). Al2O3 was from 6.31% to 30.42%. This constituent in average
was the highest in the Vinh Phuc formation (18.12%) and the lowest in the Thai Binh
formation (10.20%). The average of Fe2O3 was highest in Vinh Phuc formation (10.46%)
relating to the laterization; the lowest in gray-green clay of the Hai Hung formation (6.45%)
and reached average in the Thai Binh formation (7.21%).
K2O in the Hai Hung formation was surpassed the other formations because of relating to the
potassium absorption of organic materials. The collected samples of the Hai Hung formation
had K2O from 1.91 to 3.32%. in average 2.87% (table 3). whereas in the Vinh Phuc formation.
K2O was from only 0.34 to 1.66%. and within the Thai Binh formation. the average content of
K2O was just 2%. The other alkali and alkaline earth elements were very low but they were
close correlated close each other with a linear correlation coefficient higher than 0.8 (table 4).
TiO2 that was also importance in the Quaternary sediments varied from 0.62 to 4.02% (table
1). It was the highest in the Vinh Phuc formation with an average value of 1.94%; next was in
the Hai Hung formation (0.86%). and the lowest in the Thai Binh formation (0.67%). TiO2
</div>
<span class='text_page_counter'>(17)</span><div class='page_container' data-page=17>
1-10
Trace elements
The trace elements that were researched consisted of the chalcophile elements such as Cu. Zn.
Sb. As. Pb. Cd and the siderophile elements such as V. Cr. Ni. Their components are
displayed in table 2. The following describes in detail their behaviors that are influential
hardly in soil and water.
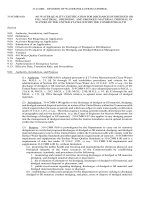
Arsenic
The arsenic content of drill hole QO.01 was varied from 10.1mg/kg in mottled clay layer of
Vinh Phuc formation to 41.5 mg/kg in greenest gray mixed-clay layer of Hai Hung formation.
According to Smedley P.L. Kinniburgh D.G. (2002). the average As level of the friable
sediments was ranged from 3 to 10 mg/kg. and then As content of research area was so much
higher. If compared to the average As level of the earth’s crust. which was 1.7 mg/kg
(Vinogradop. 1962) then it was 8 to 24 times higher. So. this thing show that regional
sedimentary could be source to pollute Hanoi underground water.
In the drill hole QO.03. As content was from 5.77 mg/kg at 19.3 m depth in mottled clay of
Vinh Phuc formation to 14.8 mg/kg at 4.3 m depth in greenest gray, dark gray clay- mud of
Hai Hung formation (tab. 1). In comparison to the clay deposits. the As maximum was 2.2
times higher and 9 times higher than the average level in the earth’s crust. It is possible that
the source of arsenic of underground water in Ha Noi area could be from sedimentary layers.
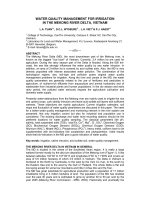
In variation charts. As content decreased with depth (Fig. 1a. 2a)
[2] Table 2. Trace element contents (mg/kg) of Quaternary sediments in Hanoi area
Sampl
e
Drill
hole
Dept
h (m) Cu Zn Sb As Pb Cd V Cr Ni
NH.07
QO-01 9.2 35.2
102.
0 12.4 18.7 35.2
0.04
8 135 104 56
NH.10
QO-01 11.7 92.8 94.1 6.6 41.5 47.6
<0.0
1 456 339 64
NH.17
QO-01 20.2 62.7 55.8 4.4 13.7 6.1
<0.0
1 122 174 71
NH.21
QO-01 25.7
116.
0
130.
0 62.8 15.3 22.2
<0.0
1 279 248 137
NH.25
QO-01 35.7
112.
0
173.
0 4.8 21.1 25.9
<0.0
1 336 246 125
NH.30
QO-01 44.7 70.8
118.
0 4.0 10.1 16.6
<0.0
</div>
<span class='text_page_counter'>(18)</span><div class='page_container' data-page=18>
NH.65
QO-03 3.7 20.1 63.0 7.1 12.2 16.1
0.05
7 78 87 42
NH.66
QO-03 4.3 42.8
124.
0 4.7 14.8 34.1 0.18 167 120 71
NH.69
QO-03 8.3 35.8
152.
0 3.9 13.3 29.4 0.12 139 113 58
NH.71
QO-03 9.8 30.0
139.
0 3.1 10.9 18.2
<0.0
1 110 90 42
NH.72
QO-03 12.3
105.
0 69.3 8.0 13.6 21.5
<0.0
1 84 74 30
NH.75
QO-03 19.2 43.4 63.8 5.6 5.8 23.1
<0.0
1 183 130 38
NH.76
QO-03 20.8 49.6 78.3 11.0 6.5 25.1
<0.0
1 197 129 44
[3] Table 3. The mean of chemical component contents of Quaternaary sediment formations in Hanoi area (<sub>*)</sub>
Formations Oxides (%)
SiO2 TiO2 Al2O3 Fe2O3 MnO MgO CaO Na2O K2O
Thai Binh 71.96 0.67 10.20 7.21 0.10 0.94 0.44 0.73 2.00
Hai Hưng 68.04 0.75 14.23 5.42 0.03 0.95 0.28 0.29 2.27
Vinh Phuc 54.84 2.27 17.82 14.82 0.04 0.42 0.12 0.08 1.10
Ha Nôi 80.78 0.20 9.48 2.28 0.38 0.85 0.50 0.21 1.31
Le Chi 78.59 0.28 9.12 2.85 1.44 0.97 0.65 0.17 1.39
Trace elements (mg/kg)
Cu Zn Sb As Pb Cd V Cr Ni
Thai Binh 20.10 63.00 7.10 12.20 16.10 0.06 78.00 87.00 42.00
Hai Hưng 49.76 117.26 6.42 14.26 27.68 0.12 127.00 100.20 51.40
Vinh Phuc 78.19 101.86 14.17 16.29 23.80 <0.01 253.86 199.29 82.00
Ha Nôi - - -
</div>
<span class='text_page_counter'>(19)</span><div class='page_container' data-page=19>
1-10
Le Chi - - -
-Copper
In the drill hole QO.01. the lowest of Cu content was 35.2 mg/kg in the top soil layer and the
highest was 116 mg/kg at 25.7 m depth in mottled clay of Vinh Phuc formation. In the drill
hole QO.03. it was varied from 20 mg/kg at 3.7 m depth in silt sand layer of Thai Binh
formation to 105 mg/kg at 22.5 m depth in clay layer of Vinh Phuc formation. Copper
component was trended to increase with depth (Fig. 1b. 2b). With the average level in
sedimentary of the world [6]. copper content in this area reaches approximately and has clark
index from 0.62 to 2.04.
Lead
</div>
<span class='text_page_counter'>(20)</span><div class='page_container' data-page=20>
<b>As Content (mg/kg)</b>
5
10
15
20
25
30
35
40
45
0 20 40 60
<b>a - As</b>
<b>D</b>
<b>ep</b>
<b>th</b>
<b> (</b>
<b>m</b>
<b>)</b>
<b>Cu Content (mg/kg)</b>
5
10
15
20
25
30
35
40
45
0 50 100 150
<b>b - Cu</b>
<b>D</b>
<b>ep</b>
<b>th</b>
<b> (</b>
<b>m</b>
<b>)</b>
<b>Pb Content (mg/kg)</b>
5
10
15
20
25
30
35
40
45
0 20 40 60
<b>c - Pb</b>
<b>D</b>
<b>ep</b>
<b>th</b>
<b> (</b>
<b>m</b>
<b>)</b>
<b>Zn Content (mg/kg)</b>
5
10
15
20
25
30
35
40
45
0 50 100 150 200
<b>d - Zn</b>
<b>D</b>
<b>ep</b>
<b>th</b>
<b> (</b>
<b>m</b>
<b>)</b>
<b>Sb Content (mg/kg)</b>
5
10
15
20
25
30
35
40
45
0 20 40 60 80
<b>e - Sb</b>
<b>D</b>
<b>ep</b>
<b>th</b>
<b> (</b>
<b>m</b>
<b>)</b>
[4] Figure 1<b>. The variation of trace element contents with depth in drill holes QO.01 (longitude:105</b>0<sub>38’11,46”;</sub>
latitude: 200<sub>59’41,03”)</sub>
<i>Zinc</i>
The variation of zinc contents trends to differ at the 2 drill holes a little bit. The zinc tends to
increase in drill holes QO.01 (fig. 1d) and decrease in drill hole QO.03 (fig. 2d) with the
depth. In the drill hole QO.01. Zn content was varied from 55.8 mg/kg at 20.2m depth in
sediments of Hai Hung formation to 173 mg/kg in sedimentary layers of Vinh Phuc
formation. In drill hole QO.03. it was ranged from 63 mg/kg at 3.7 m depth in sediments of
Thai Binh formation to 152 mg/kg at 8.3m depth in sediments of Hai Hung formation. In
comparison to the general level of the world. the Zn content in Hanoi friable sediments was
reached the average level and its concentration coefficient in clay layers was from 0.7 to 2.16
and its clark index was 0.79 to 1.83.
</div>
<span class='text_page_counter'>(21)</span><div class='page_container' data-page=21>
1-10
In drill hole QO.01. the antimony content was ranged from 4.03 mg/kg to 62.8 mg/kg. It was
higher 2.4 to 31.4 times than the average level in clay stones and 8.1 to 125.6 times than the
average Sb level in the earth’s crust. Unlike other elements. it was difficult to find the Sb
content variation (fig. 1c. 2c). In the top and bottom sedimentary layers. the Sb content was
very low and about the same but in the middle layer at 25.7 m depth. the Sb content was
increased to 62.8 mg/kg. In drill hole QO.03. the Sb content was varied from 3.07 mg/kg at
9.8 m depth in Hai Hung formation to 11 mg/kg at 20.8 m depth in Vinh Phuc formation.
However. in the average level. Sb content in the sediments of Vinh Phuc formation was
higher than its of Hai Hung and Thai Binh formation. The concentration coefficient of Sb was
reached to 1.54 - 5.5. and the clark index was from 6.14 to 22. Thus. the Sb content in
research area was much higher than its common situation in the world.
<b>As Content (mg/kg)</b>
3
5
7
9
11
13
15
17
19
0 5 10 15
<b>a - As</b>
<b>D</b>
<b>e</b>
<b>p</b>
<b>th</b>
<b> (</b>
<b>m</b>
<b>)</b>
<b>Cu Content (mg/kg)</b>
3
5
7
9
11
13
15
17
19
0 50 100 150
<b>b - Cu</b>
<b>D</b>
<b>e</b>
<b>p</b>
<b>th</b>
<b> (</b>
<b>m</b>
<b>)</b>
<b>Pb Content (mg/kg)</b>
3
5
7
9
11
13
15
17
19
0 20 40
<b>c - Pb</b>
<b>D</b>
<b>e</b>
<b>p</b>
<b>th</b>
<b> (</b>
<b>m</b>
<b>)</b>
<b>Zn Content (mg/kg)</b>
3
5
7
9
11
13
15
17
19
0 100 200
<b>d - Zn</b>
<b>D</b>
<b>e</b>
<b>p</b>
<b>th</b>
<b> (</b>
<b>m</b>
<b>)</b>
<b>Sb Content (mg/kg)</b>
3
5
7
9
11
13
15
17
19
0 5 10 15
<b>e - Sb</b>
<b>D</b>
<b>e</b>
<b>p</b>
<b>th</b>
<b> (</b>
<b>m</b>
<b>)</b>
</div>
<span class='text_page_counter'>(22)</span><div class='page_container' data-page=22>
The siderophile elements
The siderophile elements that was analysed include V. Cr. Ni and Ti. In almost samples. their
contents were very low and below the average level in the global sedimentary. Therefore. they
had non-significant roles to the researched area environment.
The correlation between the chemical components
Researching the correlation between the chemical components enabled to define sedimentary
origin and behavior of the elements.
That are similar for behaviours of As. Pb. Zn and Cu by their distribution in sedimentary
layers. They gathered high content at 11.7 m depth in mottled clay layers of Vinh Phuc
formation. That suggests that As element could be substitutional element remaining sulfur
phases in the sediments. The correlative matrix of the chemical components is given in table
4. The data show that there are close combinations each other of siderophile elements such as
Fe. V. Cr. Ni. Cu and their correlative coefficients are higher than 0.55. In the other side. As
also has a very close relation to V (r = 0.74). Cr (r = 0.77). Fe2O3 (r = 0.8) and Ni (r = 0.23).
So. in the Quaternary sediments of researched area. there is element assemblage including Fe.
Cu. V. Cr. Ni. As. This element assemblage was determine in the weathering crust upon the
mafic volcanic rocks of the Vien Nam formation belong to gold ore zone of Doi Bu (Luong
Son – Hoa Binh) by Dang Mai et al (2000) [4]. These data show that the Quaternary
sedimentary could be created from weathering mafic rocks of Vien Nam formation. This is
source of As that pollutes Hanoi underground water.
[7] Table 4. Correlate coefficients of chemical components
SiO2 TiO2 Al2O3 Fe2O3 MgO CaO Na2O K2O V Cu Cr Ni Zn As Pb
SiO2 1,0 -0,7 -0,9 -0,6 -0,1 0,0 0,1 0,0 -0,8 -0,7 -0,8 -0,8 -0,8 -0,6 -0,6
TiO2
-0,7
(<sub> * </sub>
)
1,0 0,7 0,5 -0,5 -0,5 -0,5 -0,5 0,8 0,9 0,8 0,8 0,5 0,3 0,2
Al2O3 -0,9 0,7 1,0 0,2 0,1 0,0 -0,1 0,1 0,7 0,6 0,6 0,7 0,7 0,3 0,5
Fe2O3 -0,6 0,5 0,2 1,0 -0,3 -0,2 -0,3 -0,4 0,7 0,7 0,8 0,6 0,4 0,8 0,2
MgO -0,1 -0,5 0,1 -0,3 1,0 0,9 0,8 0,9 -0,3 -0,5 -0,4 -0,2 0,3 -0,1 0,4
CaO 0,0 -0,5 0,0 -0,2 0,9 1,0 0,9 0,8 -0,3 -0,5 -0,4 -0,3 0,1 0,0 0,3
Na2O 0,1 -0,5 -0,1 -0,3 0,8 0,9 1,0 0,8 -0,4 -0,5 -0,4 -0,3 0,0 -0,1 0,2
K2O 0,0 -0,5 0,1 -0,4 0,9 0,8 0,8 1,0 -0,4 -0,6 -0,6 -0,2 0,3 -0,2 0,4
V -0,8 0,8 0,7 0,7 -0,3 -0,3 -0,4 -0,4 1,0 0,8 0,9 0,5 0,5 0,7 0,6
</div>
<span class='text_page_counter'>(23)</span><div class='page_container' data-page=23>
1-10
Cu -0,7 0,9 0,6 0,7 -0,5 -0,5 -0,5 -0,6 0,8 1,0 0,9 0,9 0,6 0,5 0,1
Cr -0,8 0,8 0,6 0,8 -0,4 -0,4 -0,4 -0,6 0,9 0,9 1,0 0,6 0,4 0,8 0,4
Ni -0,8 0,8 0,7 0,6 -0,2 -0,3 -0,3 -0,2 0,5 0,9 0,6 1,0 0,8 0,2 0,0
Zn -0,8 0,5 0,7 0,4 0,3 0,1 0,0 0,3 0,5 0,6 0,4 0,8 1,0 0,2 0,3
As -0,6 0,3 0,3 0,8 -0,1 0,0 -0,1 -0,2 0,7 0,5 0,8 0,2 0,2 1,0 0,7
Pb -0,6 0,2 0,5 0,2 0,4 0,3 0,2 0,4 0,6 0,1 0,4 0,0 0,3 0,7 1,0
5. Conclusions
In Hanoi Quaternary sediments. components that include SiO2. Al2O3. Fe2O3 were high. then
lower were K2O. TiO2 and other oxides were negligible. The sedimentary of Vinh Phuc formation was
characterized by high Fe2O3 that was a result of laterization. whereas in Hai Hung formation. K2O was high because
of potassium absorption by organic materials. In researched sediments. there are close relationship between the
alkaline and earth alkaline elements; TiO2 is positively correlative with Al2O3 and Fe2O3.
In the Hanoi Quaternary sediments. the arsenic content that pollutes underground water was
much higher than average level of the earth’s crust. Like arsenic. antimony was also high
concentrated. its clark index was higher than 20. The behaviors of As. Cu. Pb. Zn were same.
Their contents were high in the upper sediments of Vinh Phuc formation and low layer of Hai
Hung formation where organic material remainders gather. Those events suggest that. arsenic
which is dangerous polluting Hanoi underground water could be in sulfide phases and
absorption forms of organic substances of Hai Hung formation.
The close relationship between Fe. V. Cr. Ni. Cu. As show that mafic rocks in Vien Nam
formation were a source to have a part in forming the Quaternary sediments in Hanoi and to
rich As there. However. there are more detailed researches on sedimentology and mineralogy.
Acknowledgements
This current research was supported by Vietnam National University. Hanoi in project
QGTĐ.10.03. We deeply appreciate the heading board of the Project VINOGEO allow to
collect the hole drill samples and Geochemistry and Mineralogy Institute. University of
Freiburg (Germany) help to analyse chemical compositions by XRF and AAS.
References
Berg.M., Pham Thi Kim Trang, Caroline Stengel, Johanna Buschmann, Pham Hung Viet,
Nguyen Van Dan, Walter Giger, Doris Stüben. Hydrological and sedimentary controls leading
to arsenic contamination of groundwater in the Hanoi area. Vietnam: The impact of
iron-arsenic ratios. peat. river bank deposits. and excessive groundwater abstraction. Chemical
Geology 249 (2008) 91-112.
</div>
<span class='text_page_counter'>(24)</span><div class='page_container' data-page=24>
<i>and reason of the soil and water in Hatay province and proposing solutions to reducte the</i>
<i><b>pollution impact on community life. Archives of Vietnam Institute of Geosciences and</b></i>
Mineral Resources (2010)
Dang Mai, Hoang Minh, Do Van Phi. Mathematical modeling of Secondary Geochemical
Anomalies (Case Study of Doibu Area). Jounal of Geology 256 (2000) 28-38.
<i>Dang Mai. Potential of pollution of arsenic in doibu gold ore area. Proceeding International</i>
Workshop. As pollution (2000) 49-54. Ha Noi.
<i>Do Trong Su. The status of water pollution by arsenic in Hanoi and some surrouning areas.</i>
Proceeding International Workshop. As pollution (2000) 49-54. Ha Noi.
<i>Krauskopf K.B and Dennis K. Bird. Introduction to Geochemistry. Mc Graw Hill Inter</i>
Edition (1995)
<i>Ngo Quang Toan et al. Geology and Mineral resources of Ha Noi on 1:200.000 scale.</i>
Departement of Geology and Minerals of Vietnam (1993)
<i>Nguyen Van Dan, Nguyen Thi Dung. Current status of groundwater pollution in Hanoi area.</i>
Jounal of Geology 280 (2004) 48-57
Norrmal.J., Charlotte J. Sparrenbom, Michael Berg, Dang Duc Nhan, Pham Quy Nhan, Håkan
Rosqvist, Gunnar Jacks, Emma Sigvardsson, David Baric, Johanna Moreskog,Peter
<i>Harms-Ringdahl, Nguyen Van Hoan. Arsenic mobilisation in a new well field for drinking water</i>
<i>production along the Red River, Nam Du, Hanoi. Applied Geochemistry 23 (2008) </i>
3127-3142
<i>Pham Hung Viet et al. Preliminary surveys for evalution arsenic level in ground and supply</i>
<i>water in Ha Noi area. Proceeding International Workshop. As pollution (2000) 49-54. Ha</i>
Noi.
Smedley P.L.. Kinniburgh D.G. A review of the source. behaviour and distribution of
arsenic in natura waters. Applied Geochemistry 17 (2002) 127-3142
<i>Tran Nghi, Ngo Quang Toan. Depositional characteristics and geology development history</i>
<i>during Quarternary of the Ha Noi and adjacent areas. Geology Map magazine. the issue</i>
celebrating 35 years of Geology map field of study (1994) 154-161.
Nhận ngày 01 tháng 4 3 năm 2013
Chấp nhận xuất bảnChỉnh sửa ngày 029 8 tháng 4 năm 2013; chấp nhận đăng ngày 07 tháng 5 năm 2013
Received 06 March 2013
</div>
<!--links-->
water quality zoning for the river basins
- 12
- 492
- 1


.push({});</script> </div> </div> </div> <div class="vf_link_relate px-2 my-2"> <h2 class="vf_doc_relate text-2xl font-bold my-4">Tài liệu liên quan</h2> <ul class="grid grid-cols-12 gap-2"> <li class="col-span-6 md:col-span-2"> <div class="card-doc " onclick="actionDocRelated(this)"> <a class="card-doc-img" href="https://text.123docz.net/document/325519-water-quality-zoning-for-the-river-basins.htm" title="water quality zoning for the river basins"> <i class="icon i_type_doc i_type_doc2"></i> <img class="lazy" src="data:image/gif;base64,R0lGODlhAQABAIAAAP///wAAACH5BAEAAAAALAAAAAABAAEAAAICRAEAOw==" data-src="https://media.store123doc.com/images/document/13/ri/tq/medium_z7ssf8bFWi.jpg" width="124" height="179" alt="water quality zoning for the river basins" onerror="this.src=)