Impacts of climate change on water resources in the Huong River basin and adaptation measures
Bạn đang xem bản rút gọn của tài liệu. Xem và tải ngay bản đầy đủ của tài liệu tại đây (917.77 KB, 8 trang )
<span class='text_page_counter'>(1)</span><div class='page_container' data-page=1>
VNU Journal of Science, E arth Sciences 26 (2010) 210-217
<b>Impacts o f climate change on water resources </b>
<b>in the Huong River basin and adaptation measures</b>
<b>Tran Thuc*</b>
<i><b>V ietnam In stitu te o f M e te o r o lo g }\ H y d r o lo g y a n d E n viron m en t, </b></i>
<i><b>2 3 /6 2 N g u yen C hi Thanh, H anoi, Vietnam</b></i>
<b>R eceived 01 December 2010</b>
<b>A b stract. This study investigates impacts o f climate change on water </b>resource <b>in the H uong River </b>
<b>basin in the Central Vietnam . Hydrological responses o f six clim ate change scenarios were </b>
calculated. R esults reveal ứiat clim ate change w ould cause significant in crease in rainfall in wet
<b>season resulting in an increase in river flow. B y conừast, the decreasing trend o f river flow in dry </b>
<b>season is a consequence o f the decline o f rainfall and increase o f evapoưanspiration under most </b>
<b>scenarios. Sea level rise coupled with the lowering o f river stages may exacerbate salinity </b>
<b>mtrusion. Impacts o f clim ate change on socio-econom ic sectors such as agriculture, tourism, </b>
<b>biodiversity, fishery and aquaculture are assessed, and adaptation options for Thua Thien - Hue </b>
<b>Province are proposed.</b>
<i><b>K eyw ords: clim ate change, water resources, hydrological m odel, flood, adaptation.</b></i>
<b>1. Introduction</b>
Water management planners are now facing
considerable uncertainties on future demand
and availability o f water. Climate change and
its potential hydrological effects are
increasingly contributing to this uncertainty.
With the total area o f 2.830 kIĩì^ Huong River
basin falls entirely in Thua Thien - Hue
Province and is o f great economic and tourism
importance for the province. The river basin is
expected to be one o f the most vulnerable
basins in the Central Vietnam where climate
change is likely to pose serious challenges to
water resources. It is a fact that water shortage
<b>Te!.: 84-4-38359540 </b>
<b>E-mail: </b>
<b>in dry s e a s o n is g e ttin g w o r s e </b> <b>M o r eo v er , </b>
annual frequent floods, such as the historical
flood event in 1999, have revealed the
vulnerability o f water resources as well as
environment to climate changes. Therefore, the
need for impact assessment o f climate change
has undoubtedly arisen.
<b>2. Methods</b>
<i><b>2. 1. C lim a te c h a n g e s c e n a r io s</b></i>
</div>
<span class='text_page_counter'>(2)</span><div class='page_container' data-page=2>
<i>T. Thuc / V N U Journal of Science, Earth Sciences 26 (2010) 2Ĩ0-217</i> 211
published by the Intergovernmental Panel on
Climate Change (IPCC). Changes in daily
temperature and precipitation were computed
by using Statistical Downscaling method.
The following sources o f input and
boundary data were used for developing the
climate scenarios: (1) Results from Globa]
Circulation Models (GCM) and Ocean-
Atmospheric Global Circulation Models
(OAGCM); (2) IPCC’s global emission
scenarios and regional climate change scenarios
for South-East Asia (IPCC, 2001); (3) Past
trends o f observed meteorological data from
stations o f Hue, A Luoi and Nam Dong for the
last 30 - 40 vears in Thua Thien - Hue
Province; and (4) Observed sea level data at
stations and analysis from the Marine Hydro-
Meteorological Center.
<i>2.2. Hvdrological/Hydraulic model application</i>
In order to assess the potential impacts of
climate change on water resources, a set of
hydrological/hydrodynamic model, including
NAM, MDCEll and M IK E llG IS , was
employed. Inputs for these models include daily
rainfall, and temperature data from 1961-2004,
and their projections for the period o f 2010-
2100. Potential evapotranspiration were
computed for the baseline year 1990 and for the
periods 2020 - 2049 and 2071 - 2100 at A Luoi,
Nam Dong, and Hue stations.
<b>3. Results and discussion</b>
<i>3.1. Climate change scenarios</i>
Results from the model show that annual
mean temperature is expected to increase by
2.5-2.6“C by the end o f the 2 T ' century. The
increase is more pronounced in January and
February (2.6-2.7”C). Among climate scenanos,
the temperature would increase the most in
A IFI scenario, by 3.9°c in 2100, and up to
4.7“c between March-May (Table 1).
<i>T a b le 1. P rojecteH in c re a ie in an n n n l an d <:ea<:nnal te m p e ra tu re (°C) in T h n a T h ie n - H u e in 2 0 1 0 -2 1 0 0 .</i>
<b>Scenario</b> <b>Period</b> <b>20 10</b> <b>2020</b> <b>2030</b> <b>2040</b> <b>2050</b> <b>2060</b> <b>2070</b> <b>2080</b> <b>2090</b> <b>2100</b>
<b>Year</b> <b>0.2</b> <b>0.3</b> <b>0.6</b> <b>0.9</b> <b>1.4</b> <b>2.0</b> <b>2.6</b> <b>3.1</b> <b>3.5</b> <b>3.9</b>
<b>D ec-F eb</b> <b>0.2</b> <b>0.3</b> <b>0.6</b> <b>0.9</b> <b>1.5</b> <b>2.1</b> <b>2.7</b> <b>3.2</b> <b>3.7</b> <b>4.0</b>
<b>A IFI</b> <b><sub>M ar-M ay</sub></b> <b><sub>0.2</sub></b> <b><sub>0.4</sub></b> <b><sub>0.7</sub></b> <b><sub>1.1</sub></b> <b><sub>1.7</sub></b> <b><sub>2.4</sub></b> <b><sub>3.1</sub></b> <b><sub>3.7</sub></b> <b><sub>4.3</sub></b> <b><sub>4.7</sub></b>
<b>Jun-Aug</b> <b>0.2</b> <b>0.3</b> <b>0.6</b> <b>0.9</b> <b>1.5</b> <b>2.1</b> <b>2.7</b> <b>3.2</b> <b>3.7</b> <b>4.1</b>
<b>S ep -N ov</b> <b>0.2</b> <b>0.3</b> <b>0.6</b> <b>0.9</b> <b>1.4</b> <b>2.0</b> <b>2.6</b> <b>3.2</b> <b>3.6</b> <b>4.0</b>
<b>Year</b> <b>0.2</b> <b>0.3</b> <b>0.4</b> <b>0.6</b> <b>0.8</b> <b>1.0</b> <b>1.2</b> <b>1.6</b> <b>2.1</b> <b>2.6</b>
<b>D ec-F eb</b> <b>0.2</b> <b>0.3</b> <b>0.4</b> <b>0.6</b> <b>0.8</b> <b>1.0</b> <b>1.2</b> <b>1.5</b> <b>2.0</b> <b>2.5</b>
<b>A2</b> <b><sub>M ar-M ay</sub></b> <b><sub>0.2</sub></b> <b><sub>0.4</sub></b> <b><sub>0.5</sub></b> <b><sub>0.7</sub></b> <b><sub>0.9</sub></b> <b><sub>1.2</sub></b> <b>1.4</b> <b>1.8</b> <b>2.4</b> <b>3.0</b>
<b>Jun-Aug</b> <b>0.2</b> <b>0.3</b> <b>0.4</b> <b>0.6</b> <b>0.8</b> <b>1.0</b> <b>1.2</b> <b>1.6</b> <b>2.1</b> <b>2.6</b>
<b>S ep -N ov</b> <b>0.2</b> <b>0.3</b> <b>0.4</b> <b>0.6</b> <b>0.8</b> <b>1.0</b> <b>1.2</b> <b>1.5</b> <b>2.0</b> <b>2.5</b>
Results also indicate that rainfall in the
rainy season would increase by 25%. In
contrast, rainfalls in the early months o f dry
season (December to February) show a decrease
</div>
<span class='text_page_counter'>(3)</span><div class='page_container' data-page=3>
212 <i>T. Thuc / V N U Journal o f Science, Earth Sciences 26 (2010) 210-217</i>
<b>Table 2. Projected change in annual and seasonal rainfall (%) in Thua Thien - Hue in 201 0-21 00 .</b>
<b>Scenario Period</b> <b>20 1 0 </b> <b>2 02 0 </b> <b>203 0 </b> <b>204 0 </b> <b>20 50 </b> <b>206 0 </b> <b>2 0 7 0 </b> <b>20 80 </b> <b>209 0 </b> <b>2100</b>
<b>A IFI</b>
<b>Year</b>
<b>Dec-Feb</b>
<b>Mar-May</b>
<b>Jun-Aug</b>
<b>Sep-N ov</b>
<b>0.5</b>
-1.0
<b>0.4</b>
<b>0.7</b>
1.1
<b>0.9</b>
-2.0
<b>0.8</b>
1.1
2.1
<b>1.5 </b>
<b>-3.3</b>
<b>1.3</b>
<b>2.2</b>
<b>3.5</b>
<b>2.5 </b>
<b>-5.4 </b>
<b>3.1</b>
<b>3.6</b>
<b>5.7</b>
<b>4.0</b>
<b>-8.5</b>
<b>3.4</b>
<b>5.6</b>
<b>8.9</b>
<b>5.7 </b>
-12.0
<b>4.8 </b>
<b>8.0</b>
<b>12.7</b>
<b>7.3</b>
<b>-15.4</b>
6.1
<b>10.3</b>
<b>16.3</b>
<b>8.7</b>
<b>-18,5</b>
<b>7.4</b>
<b>12.3</b>
<b>19.6</b>
10.0
-21.2
<b>8.4</b>
<b>14.2</b>
<b>22.4</b>
11.0
<b>-23.4 </b>
<b>9.3</b>
<b>15.6</b>
<b>24.7</b>
<b>Year</b> <b>0.4</b> <b>0.9</b> <b>1.2</b> <b>1.7</b> <b>2.2</b> <b>2.7</b> <b>3.3</b> <b>4.2</b> <b>5.6</b> <b>7.0</b>
<b>Dec-Feb</b> <b>-0.9</b> <b>-1.8</b> <b>-2.4</b> <b>-3.6</b> <b>-4.6</b> <b>-5.7</b> <b>-6 .9</b> <b>-8.9</b> <b>-11.8</b> <b>-14.8</b>
<b>A2</b> <b>Mar-May</b> <b>0.4</b> <b>0.7</b> <b>1.0</b> <b>1.4</b> <b>1.8</b> <b>2.3</b> <b>2.8</b> <b>3.6</b> <b>4.7</b> <b>5.9</b>
<b>Jun-Aug</b> <b>0.6</b> <b>1.2</b> <b>1.6</b> <b>2.4</b> <b>3.1</b> <b>3.8</b> <b>4 .6</b> <b>6.0</b> <b>7.9</b> <b>9.8</b>
<b>S ep -N ov</b> <b>1.0</b> <b>1.9</b> <b>2.6</b> <b>3.8</b> <b>4.9</b> <b>6.1</b> <b>7.3</b> <b>9.4</b> <b>12.5</b> <b>15.6</b>
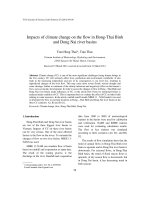
<i>3.2. Change in river flow</i>
Figure 1 shows period-averaged change o f
annual flows relative to the baseline period
(1990) at four gauging stations for the periods
1977-2006, 2020-2049 and 2071-2100 under
the B2 scenario. From the figure, an apparent
increase in die river flow is observed; however,
the magnitude is different amongst periods and
streamflow gauging locations. O f all stations,
flow at Ta Trach increases most significantly
whereas flow at Phu Cam (downsfream) has
smallest increase, 9% and almost 5%,
respectively. Results o f streamflow simulation
also reveal a reduction o f flow in dry season
due to the decline o f rainfall.
<b>I</b>
<i>Ỉ</i>
Ổ
—♦— Ta T rach
—■— H uu T rach
--- Bo
• H a luu
<b>1 9 7 7 - 2 0 0 6</b> <b>2 0 2 0 - 2 0 4 9 </b>
P e rio d
<b>2 0 7 1 - 2 1 0 0</b>
</div>
<span class='text_page_counter'>(4)</span><div class='page_container' data-page=4>
<i>T. Thuc Ị V N U journal o f Science, Earth Sciences 26 (20W ) 110-117</i> 213
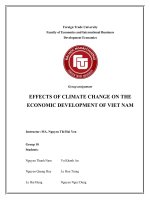
<i>3.3. Change in flooded area</i>
Based on the MIKE 11 outputs,
MIKEl IGIS was employed to interpolate water
levels at all cross-sections in order to construct
a grid-based (TIN-based) water surface. The
water surface was then automatically compared
<b>Table 3. Flooded area in Thua Thien - Hue under A l F l em ission scenario.</b>
with a Digital Elevation Model (DEM) to
develop flood depth maps [1]. Table 3 shows
the predicted change o f flood depth and flooded
areas in Thua Thien " Hue province for the
A IFI emission scenario compared to the flood
event in 1999.
<b>C h a ra c teristic s</b> <b>1999</b> <b>2030</b> <b>2050</b> <b>2070</b> <b>20 90</b> <b>21 00</b>
<b>M ax. depth (m )</b> <b>5.81</b> <b>5.96</b> <b>6.08</b> <b>6.16</b> <b>6.27</b> <b>6.44</b>
<b>Area flooded (km^)</b> <b>388.4</b> <b>404,5</b> <b>419.2</b> <b>439.5</b> <b>4 48.8</b> <b>4 53.7</b>
<b>Flooded proportion (%)</b> <b>7.69</b> <b>8.01</b> <b>8.29</b> <b>8.68</b> <b>8.88</b> <b>8.98</b>
It can be seen from the table that, the 1999
flood event caused an average flooded depth of
5.81m covering an area o f 388.4km^ and
accounting for 7.69% area o f the entire territory
o f Thua Thien - Hue Province. By the year
2030, flooded depth o f almost 6m will result in
flooding area o f 400km^. It is obvious that, the
magnitude and flooding area will be more
severe by time. Figure 2 indicates a flooded
map for the Huong River basin corresponding
with maximum water level under the B2
emission scenario.
ịM I
<b>-v i e ? </b>
<b>V </b>
<i>s</i>
<i><b>■</b></i> m V > * ■" • <i><b>• ,%J * </b></i> <i><b>- </b></i> <i><b>' Ị .</b></i>
<i>Ê Ẵ</i>
<i>ý</i>
<i> ểM' ặậẬr \ ^</i>
<b>/</b>
</div>
<span class='text_page_counter'>(5)</span><div class='page_container' data-page=5>
214 <i>T. Thuc Ị V N U journal o f Science, Earth Sciences 26 (20W ) 210-2Ĩ7</i>
<i>3.4. Change in salinity intrusion</i>
Salinity profile was simulated by the couple
o f HD and AD modules o f MIKE 11 model
taking into consideration o f climate change and
sea level rise. The year 2002 is selected as the
reference baseline because o f the availability o f
measured salinity data. Results o f salinity
intrusion computation for A IF I scenario for
some cross-sections in the mainstream are
presented in Table 4. As shown in the table,
salinity concentration increases over time and
goes accordance with magnitude o f sea level
rise. Result also indicates that the salinity
intrusion during dry season in the Huong River
basin due to a series o f effect o f sea level rise,
water reduction and increasing demand o f water
users is expected to be more serious in the
future.
<b>Table 4. Salinity concentration change at Pho N am and Phu Cam (A IF I scenario).</b>
<b>Cross-section</b> <b>Parameter</b> <b>2002</b> <b>2030</b> <b>2050</b> <b>2070</b> <b>2 0 9 0</b> <b>2100</b>
<b>Phu Cam</b> <b>Average salinity concenưation (“/«,)</b> <b>2</b> <b>2.1</b> <b>2.17</b> <b>2.33</b> <b>2.41</b> <b>2.47</b>
<b>Percentage (%)</b> <b>0</b> <b>5</b> <b>8.5</b> <b>16.5</b> <b>20.5</b> <b>23.5</b>
<b>Pho Nam</b>
<b>Average salinity concentration (°/oo) </b>
<b>Percentage (%)</b>
<b>2.45</b>
<b>0.00</b>
<b>2,65</b>
<b>8.16</b>
<b>2 .8 4</b>
<b>15.92</b>
<b>3.05</b>
<b>24.49</b>
<b>3.2 4</b>
<b>3 2 .2 4</b>
<b>3.39</b>
<b>38.37</b>
<i>3,5, Impact o f climate change on other sectors</i>
Apart from assessing the impacts o f climate
change on water resources, the study also
looked at impacts o f climate change on other
sectors in Thua Thien - Hue Province. In
addition, more detailed assessments have been
carried out in order to better understand the
potential impacts o f climate change on two
specific areas in the province: Phu Vang
District and Chan May - Lang Co Special
Economic Industrial Zones.
The impact assessments were largely based
on interviews and workshops/meetings with
stakeholders at provincial, district and
commune levels, using UNEP and IPCC
methodology as well as participatory
approaches. The assessment was canied out for
all relevant sectors, natural and water resources,
biodiversity, agriculture, aquaculture, forestry,
industry and energy, transport and consữuction,
culture and sport, tourism, trade and services,
w ith an emphasis on the highly important
coastal zone o f Thua Thien - Hue Province. A
brief summary including some representative
<i><b>examples o f the climate change impacts are </b></i>
presented here.
<i><b>Impacts on agrìruỉtnrp</b></i>
Most o f the current rice paddies would have
a high risk o f flooding during wet season.
Additionally, salinity intrusion is another threat
during the dry season, especially in low-lying
areas. This may lead to a drop in food yields
which in turn threats food security.
Rice, short-term and long-term planted trees
and long-term, newly developed industrial frees
such as rubber may suffer more as the
occiurence o f natural disasters is pronounced to
be more frequent. The crop patterns and
productivity are also expected to be severely
affected by climate change.
</div>
<span class='text_page_counter'>(6)</span><div class='page_container' data-page=6>
<i>T. Thuc / V N U journal o f Science, Earth Sciences 26 (2010) 210-217</i> 215
Increasing amount o f pesticides and chemicals
might be used to combat this, hence, resulting
in an increasing risk o f pollution and danger.
<i>Impacts on natural fisheries and aquaculture</i>
Changes in the flow regim e will affect the
itinerary o f fishing boats and other ships and
fish migration/spawning routes. Changes in the
natural environment lead to changes of
biodiversity, the behavior o f fauna and flora and
change o f their genetic diversity.
W hen temperatures exceed
40“c ,
thegrowth o f animals in aquaculture ponds is
slowed, and they may even die, affecting farm
productivity. In addition, bacteria and fungi
multiply more profusely, resulting in epidemics
and eutrophication o f fanning ponds in the
lagoon.
<i>Impacts on biodiversity</i>
Climate change and sea level rise may
increase the salinity concentration o f the
brackish lagoon water, adversely affecting the
ecosystems o f the Tam Giang - Cau Hai
<b>wetlaind. M an y ciid itngcrcU b p c c ic s w o u ld b e </b>
expo:sed to a high risk o f extinction. The
projected extension o f the lagoon and
frequiently flooded area would alter the
shoreline and estuary and destroy the large
mangỊTOve forest and habitat o f many species,
including those that are endangered.
T he solutions proposed and implemented
(weir, dam, etc.) to address the problem o f
salinazation due to sea level rise could affect
migratory animals and m icro organisms,
including the migration for reproduction o f
“native” species such as flower eel, ebony eel
and spotted sardine. This could also restrict the
ừansition and interaction between the
freshwater, brackish-water and marine
ecosystems, potentially limiting the adaptation
capacity of wildlife, domestic animals and crops.
A rise in sea temperature could also affect
coastal and marine ecosystems such as coral
reefs.
<i>Impacts on the coastal zone</i>
The coastal zone accounts for 30% o f the
area and more than 30% o f the human
population o f Thua Thien - Hue Province.
Climate change impacts on the coastal zone
in the province include: (I) The shrinking o f
land and coastal plain due to enlarged wetland
and flooded areas in Tam Giang - Cau Hai
lagoon would exacerbate the effects o f floods to
downstream o f Huong River; (2) The flooding
o f terrestrial ecosystems may result in the loss
o f mangrove forest; (3) Eroded seashore,
decreased land under cultivation and dwindling
residential areas will adversely affect local
incomes and livelihoods, including that o f
fishermen, farmers, industrial workers and
enterprises around the lagoon and downstream
o f the Huong River; (4) Threats to
infrastructure and ừansportation networks (sea
dyke and coastal highways), irrigation and
w a te r w o r k s w h ic h w e r e d e s ig n e d a n d
constructed without consideration of sea level
rise; indirectly increase public and private
sector expenditure for construction and
protection o f infrastructure in low-lying areas;
and (5) Increased pollution o f the aquatic
environment in the coastal zone and salinity
intrusion o f the Huong River lead to water
scarcity. This in turn results in conflicts in the
use o f natural and water resources.
<i>Impacts on tourism</i>
</div>
<span class='text_page_counter'>(7)</span><div class='page_container' data-page=7>
216 <i>T. Thuc Ỉ VN U Journal o f Science, Earth Sciences 26 (2010) 210-217</i>
province, some o f which could disappear, while
others will move further inland reducing
enjoyment o f the seaside. Sea level rise may
also damage the cultural and historical heritage,
protected areas and infrastructure o f the ancient
capital o f Hue.
<i>3.6. Towards an adaptation policy fo r Thua </i>
<i>Thien - Hue province</i>
The Integrated Coastal Zone Management
(ICZM) strategy for Thua Thien - Hue Province
reflects die willingness and commitment o f the
provincial authorities and people to carefully
balance interests with respect to the protection
and the use o f coastal resources and
environment for the sustainable development o f
the coastal zone [2].
The ICZM strategy document was
promulgated at the national level in 2003. The
strategy o f ICZM agrees with the sữategy o f
adaptation to climate change in the approach,
meứiods o f implementation and objectives o f
environment protection for sustainable
development. As such, tiie document could
serve as an appropnate basis ior implementing
climate change policies and measures at the
provincial level.
At this moment, however, ứie process o f ứie
preparing the ICZM strategy has not yet
considered the changes in climate as well as
their impacts on natural conditions o f the study
area. Hence ứie study, in close consultation
with relevant provincial stakeholders, took the
initiative to integrate some climate change
adaptation proposals into important sections o f
the ICZM strategy.
The following proposal has been made for
inclusion mto ứie ICZM Strategy: (1) Raising
management capacity for ICZM m ứie areas
most likely affected by climate change: Raising
awareness and knowledge among community
members, local government authorities and
policy makers on future climate-related
disasters and adaptive measures for ICZM to
respond to climate change; (2) Re-development
the coastal zone management framework
protocol and action plan in the administrative
system o f Thua Thien - Hue towards
sustainable development, shared benefits and
adaptation to climate change; (3) Re
recognition o f the areas, fields and communities
most vulnerable to climate change impacts and
identification o f effective measures to maintain
sustainable development in these specific
zones; and (4) Re-assessment o f the canying
capacity o f the coastal zone and lagoons and
potential adaptive capacity o f relevant sectors
(agriculture, aquaculture, tourism and industrial
development) in the coastal zone [3].
<b>4. Conclusions</b>
The study has provided a quantitative
understanding o f the impacts o f climate change
on water resources in the Huong River basin.
Climate change will result in an increase in
precipitation in rainy seasons but a decline in
dry season. As a consequence, river flow also
changes accordingly. This may cause an
unbalance in water use o f various sectors.
The large uncertainty in the rate and
magnitude o f the changes needs appropriate
adaptation measures. Both structural and non-
structural measures should be considered so as
to minimize the severe impacts.
</div>
<span class='text_page_counter'>(8)</span><div class='page_container' data-page=8>
<i>T. Thuc / V N U Journal o f Science, Earth Sciences 26 (2010) 210-217</i> 217
<b>Acknowledgments</b>
This study is a part o f the research
supported by the Netherlands Climate
Assistance Program (NCAP) and implemented
by the Vietnam Institute o f Meteorology,
Hydrology and Environment. The author is also
grateful to valuable contributions from relevant
agencies and colleagues.
<b>References</b>
<b>[1] Le Nguyen Tuong, Hoang Minh Tuyen et al., </b>
<i><b>Analyzing impacts o f clim ate change on Huong </b></i>
<i><b>river flo w - Foci4sing on Phu Vang district, </b></i>
<b>IMHEN Technical PaỊOT, 2007.</b>
<b>[2] Thua Thien Hue Provincial People’s Committee, </b>
<i><b>Five y e a r social-econom ic development plan, </b></i>
<i><b>from 2006 to 2010, 2005 (In Vietnamese).</b></i>
[3] Phong Tran, Rajib Shaw, Towards an integrated
<b>approach </b> <b>o f </b> <b>disaster </b> <b>and </b> <b>environment </b>
<b>management: A case study o f Thua Thien - Hue </b>
<i><b>province, Central Viet Nam. Environmental </b></i>
</div>
<!--links-->