- Trang chủ >>
- THPT Quốc Gia >>
- Sinh học
Livelihood Vulnerability Index of the Informal Food Sec-tor to Climate Extremes in Camarines Sur
Bạn đang xem bản rút gọn của tài liệu. Xem và tải ngay bản đầy đủ của tài liệu tại đây (691.4 KB, 19 trang )
<span class='text_page_counter'>(1)</span><div class='page_container' data-page=1>
<b>Livelihood Vulnerability Index of the Informal Food </b>
<b>Sec-tor to Climate Extremes in Camarines Sur </b>
Hanilyn A. Hidalgo#
<i>#</i>
<i> Department of Agribusiness and Entrepreneurship, </i>
<i>Central Bicol State University of Agriculture, Pili, Camarines Sur , Philippines </i>
<i> E-mail: </i>
<i><b>Abstract</b></i>— <b>The informal food sector is regarded as a huge contributor in local economic development. </b>
<b>However, since they directly get their supplies and raw materials from agricultural produce in the local </b>
<b>markets, they become vulnerable to the uncertainties of nature. The study aimed to: describe the level of </b>
<b>livelihood vulnerability of the informal food sector; identify the issues and opportunities of the informal </b>
<b>food sector; and draw out policy implications that could enhance the livelihood resiliency of the informal </b>
<b>food sector in Camarines Sur. The study used and modified the Livelihood Vulnerability framework of </b>
<b>Hahn (2009) where seven indicators were used in determining the vulnerability: socio-demographic </b>
<b>pro-file, livelihood strategies, social network, health security, food security, access to utilities, and disaster </b>
<b>experience. A random sampling of 200 informal food enterprises was employed to three market areas in </b>
<b>Camarines Sur. The livelihood vulnerability index was used to describe the vulnerability level. The </b>
<b>study revealed a low to moderate vulnerability level of the informal food enterprises. The result is </b>
<b>at-tributable to their ability to withstand disaster experience and high adaptive capacity to areas such as </b>
<b>livelihood diversification, years in business experience and income factor. Findings suggest the need to </b>
<b>highlight technical and social areas for intervention to further enhance their business resiliency to climate </b>
<b>extremes. </b>
<i><b>Keywords</b></i>— <i><b>livelihood vulnerability, informal food sector, livelihood vulnerability index, business resiliency </b></i>
I. INTRODUCTION
A. <b>Rationale </b>
</div>
<span class='text_page_counter'>(2)</span><div class='page_container' data-page=2>
While entrepreneurship is considered an economic tool in small and medium enterprise
de-velopment through job creation, investment, and innovation, in the informal sector, it is
gen-erally necessity-driven. The proliferation of informal entrepreneurs in many developing
countries is caused by the high unemployment rate, limited access to financial support and
the increasing poverty incidence.
With the huge contribution of the informal sector in economic development, local authorities
regard the sector as partners in local development initiatives. Informal sector comes in
vari-ous forms. Among the industries under this sector, the food sector demonstrates a huge
im-pact to food production and distribution in the urban, peri-urban and rural areas. The informal
food sector covers the activities in the entire food value chain, thus, it becomes a source of
income and food security. Since they directly get their supplies and raw materials from the
local markets, they become vulnerable to the uncertainties of nature including the global
cli-mate change that severely affects agriculture.
However, while it continues to thrive in many parts of the country and in all parts of the
world and has supported a wide diverse group of people to contribute to poverty reduction, it
is often neglected and left out of policymaking. In the Philippines, the government shows a
strong inclination of cooperation and positive attitude towards the informal sector, Realizing
its role as a contributor in the gross domestic product and food security for poor consumers,
capacitating them by reducing their vulnerabilities may be a strategic move for a
transforma-tional shift in the context of climate change.
B. <b>Review of Related Literature </b>
<i><b>Informal Sector </b></i>
</div>
<span class='text_page_counter'>(3)</span><div class='page_container' data-page=3>
Hence, most of the entrepreneurs in the informal sector are necessity-driven (Meye, 2016).
Necessity is a primary motive of the informal business sector. But not all who engaged in
off-the-books transactions are driven by necessity (Williams, 2007). In economically
de-pressed communities, informal entrepreneurship is motivated out of necessity. However, in
prosperous areas, the informal sector is motivated by opportunity (Williams, 2011).
Informal economic activities exist due to poor implementation of state policies and
regula-tions. They are not accounted for in the Gross Domestic Product but they are, nevertheless,
recognized by the government as the hidden contributor in economic development (Boels,
2014). In developing countries, the presence of the informal sector is normal. The role of
micro and small enterprises where informality is common has been recognized to foster
growth (Li and Rama, 2015).
Informal entrepreneurs comprise a large portion of the economy than the formal
entrepre-neurs. But in actual practice, entrepreneurship does not adhere to the rules all the time.
Many informal economic activities were seen as more enterprising and entrepreneurial than
the formal ones (William and Nadin, 2011). In Ukraine, the informal sector serves as the
breeding ground for enterprise development. Hence, the hidden enterprise culture in this
sec-tor should be given recognition in public policy and be treated separately with the formal
en-terprise (Williams and Round, 2007).
</div>
<span class='text_page_counter'>(4)</span><div class='page_container' data-page=4>
The prevalence of informal sector has brought some policy implications to facilitate
formali-zation of the hidden enterprise sector. Policy measures such as simplification of regulatory
compliance, the introduction of incentives and amnesties and campaigns for tax morality
were suggested measures in response to the growing population of informal entrepreneurship
(Williams and Nadin, 2012).
<i><b>Livelihood Vulnerability </b></i>
Looking through the lens of a sustainable livelihood approach, a Livelihood Vulnerability
Index (LVI) was developed by Hahn et al. (2009) to determine a detailed analysis of forces
affecting household livelihood vulnerability in a particular community. The LVI is a
combi-nation of Sustainable Livelihood Analysis (Chambers) and IPCC‘s three major contributing
factors to vulnerability – exposure, sensitivity and adaptive capacity. The LVI with seven
ma-jor indicators aggregated into IPCC‘s vulnerability factors was piloted in Mozambique. The
utility of LVI has been tested and applied in different socio-ecological settings such as the
case of two wetland communities in Trinidad and Tobago. Results of the application
provid-ed new variables in minimizing vulnerability to environmental change. (K.U. Shah et al.,
2013).
</div>
<span class='text_page_counter'>(5)</span><div class='page_container' data-page=5>
com-munity vulnerability index used by Orencio and Fuji (2012) was tested in Baler, Aurora.
However, some variables were not accounted for which could further substantiate the
vulner-ability factors of the households. Climate change vulnervulner-ability was also assessed in
disaster-prone provinces like Infanta, Quezon but Acosta et al. (2014) used only three factors of
vul-nerability – sources of livelihood, loss, and damage, and knowledge and perceptions of
peo-ple.
In order to fully understand the socioeconomic conditions that contribute to the vulnerability
of the poor communities, a detailed vulnerability and adaptive studies at the local level must
be conducted. (Cuesta and Rañola, 2008). While studies in the Philippines which are related
to climate change focused on vulnerability and adaptive measures, no study has concentrated
on livelihood vulnerability that would quantify the strength of livelihood systems that would
include socio-economic conditions and adaptive capacities.
Assessing the livelihood vulnerability is a primary step in building sustainable and resilient
enterprises. Currently, Naga City does not have a baseline data on the status of livelihood
vulnerabilities in the informal food sector where assessment for developmental programs
could start.
The informal food sector lacks the safety nets that will protect their livelihood from climate
change extreme events. Working under a shadow economy, they are more susceptible to
business risks associated with the primary source of their enterprise – agriculture. These are
some potential threats to developmental programs that seek to increase the business
formali-zation program of the government.
</div>
<span class='text_page_counter'>(6)</span><div class='page_container' data-page=6>
entry points. The LVI may also serve as a monitoring tool in determining the status of
vul-nerability in the area.
II. <b>OBJECTIVES OF THE STUDY</b>
<i><b>General </b></i>
The general objective of the study is to assess the livelihood system of the informal food
<i><b>sec-tor in key areas in Camarines Sur. Specifically, it aims to: </b></i>
Describe the level of livelihood vulnerability of the informal food sector
Identify the issues and opportunities of the informal food sector
Draw out policy implications that could enhance the livelihood resiliency of the
in-formal food sector
III.<b>METHODOLOGY</b>
<i>A. Research Design </i>
The study is a descriptive type of research. The methodology was anchored from the LVI
components (Socio-Demographic Profile, Livelihood Strategies, Social Networks, Health,
Food, Water, and Natural Disasters and Climate Variability) used by Hahn (2009).
Howev-er, modifications was made in the indicators using entrepreneurial indicators suited to a food
microenterprise. The applicability of the LVI indicators was further tested and refined after
field surveys and consultations.
<i>B. Sampling </i>
</div>
<span class='text_page_counter'>(7)</span><div class='page_container' data-page=7>
the east and Ragay Gulf on the west. It is mostly agriculture-based type of economy with
rice, corn, coconut and fish as main agricultural commodities.
Using the standard set by the World Health Organization, a total sample size of 200
households was randomly selected from these communities at the 95% confidence interval,
10% precision, 50% prevalence.
The public market areas of two municipalities (Calabanga and Pili) and one city (Naga
City) in Camarines Sur were purposely selected to represent rural, peri-urban and urban types
of communities. Sixty respondents were randomly chosen from the two municipalities while
eighty respondents were taken from Naga City having the biggest population among the three
areas.
<i>C. Data Collection and Analysis </i>
The study was anchored on the framework approach of Hahn, M.B., et al (2009) which
uses the Livelihood Vulnerability Index (LVI) incorporating seven livelihood components –
socio-demographic profile, livelihood strategies, social networks, health, food, water, and
natural disasters and climate variability. The study uses the mathematical expression below
to quantitatively describe the livelihood vulnerability index of the informal food sector:
LVI = Σi=1 wMiMi
Σi=1 wMi
where LVI, the Livelihood Vulnerability Index for a certain area or district d, equals the
weighted average of the seven major components. The weights of each major component,
wmi, are determined by the number of sub-components that make up each major component
and are included to ensure that all subcomponents contribute equally to the overall LVI
(Sul-livan et.al., 2002).
</div>
<span class='text_page_counter'>(8)</span><div class='page_container' data-page=8>
com-putation placing the context of climate change in the livelihood assessment. The IPCC
con-tributing factors to vulnerability are exposure, adaptive capacity, and sensitivity. The seven
livelihood major components were categorized following the vulnerability factors. Exposure
is measured by the natural disasters and climate variability. Adaptive capacity is measured by
socio-demographic profile, social networks, and livelihood strategies while sensitivity is
measured by health, food, and water.
With three factors combined, the study will use the formula LVI-IPCC= (ed –ad) *sd
where LVI-IPCC is the LVI for district expressed using the IPCC vulnerability framework, e
is the calculated exposure score, a is the calculated adaptive capacity score and s is the
calcu-lated sensitivity score.
The data for LVI computation will use the three models used by Shah, et.al (2013):
calcula-tion of a balanced weighted average LVI, calculacalcula-tion of LVI based on the IPCC framework
utilizing the first two models. An equal weighting scheme was used for all indicators. The
table below shows the level of vulnerability for the LVI value.
<b>Table 1. Values and Level of Livelihood Vulnerability </b>
<b>LVI Value</b> <b>Level of Vulnerability</b>
<b>-1 to -0.6</b> Very low
<b>-0.59 to -0.2</b> Low
<b>-0.19 to 0.2</b> Moderate
<b>0.21 to 0.6</b> High
<b>0.61 to 1</b> Very high
IV.<b>RESULTSANDDISCUSSION </b>
</div>
<span class='text_page_counter'>(9)</span><div class='page_container' data-page=9>
The dependency rate is highest in Calabanga and lowest in Pili. But, generally, they all reflect
a large ratio of the economically dependent people to working population. The informal
businesses in Calabanga, Naga, and Pili are headed by women at 87%, 88%, and 77%,
re-spectively. While the women work in the informal business sector, the husbands work mostly
in the agriculture and construction sectors. This is a typical gender assignment in a
house-hold. In Calabanga, almost half of the respondents were earning below the food threshold of
PhP1,288 per capita per month. The lowest percentage was observed from Pili where only
about two out of ten respondents were reported to earn below the subsistence level. The
av-erage monthly income of the business owners in Calabanga is PhP10,375 while PhP16,675
and PhP19,381 in Naga and Pili, respectively. Majority of the respondents have not even
at-tended college. The high vulnerability result of the socio-demographic profile is explained
by the sector‘s high dependency ratio, female-headed enterprise and poor educational
back-ground.
Table 2. Values of sub-component vulnerability indicators in the three sites
<b>Vulnerability </b>
<b>factor </b> <b>Component </b> <b>Indicators </b>
<b>Calabanga </b> <b>Naga </b> <b>Pili </b>
<b>Adaptive </b>
<b>Ca-pacity </b>
Socio-demographic
profile
Percentage of dependent people (15-65 years
and without disability)
0.7167 0.7 0.6833
Percent of female-headed food businesses 0.883 0.875 0.783
Percentage of owners earning below the
sub-sistence level
0.4167 0.3 0.167
Percent of owners who have not attended
college
0.933333 0.9375 0.833333
Livelihood
strategies
Average commodity diversification index 0.93055556 0.8823529 0.882353
Average livelihood diversification index 0.555 0.5753382 0.211765
Average skills diversification index 0.588 0.6410256 0.59
Percent of owners with less than 3 years in
same business
0.267 0.3125 0.3167
Percent of owners with insufficient savings 0.266667 0.0875 0.45
Percentage of owners with single input
sup-pliers
</div>
<span class='text_page_counter'>(10)</span><div class='page_container' data-page=10>
Social Network Percentage of owners with no access to credit 0.466667 0.4 0.566667
Percentage of owners who are not confident
they can borrow after a calamity
0.083333 0.175 0.083333
Percent of owners who have availed of any
livelihood assistance (past 12 months)
0.1 0.075 0.116667
Percent of owners who are not members of
industry-related organization
0.983333 0 0.033333
Average percentage of sales comes from non
regular market or non ‗suki‘
0.255 0.70625 0.4025
<b>Sensitivity </b> Health Security Percent of owners with chronic illness 0 0.0125 0.083333
Percent of food businesses where the owner
had to stop food business operation due to
illness
0.066667 0.075 0.083333
Percentage of business owners without health
insurance
0.433333 0.575 0.416667
Food Security Percentage of owners who are food insecure 0.133333 0.4125 0.333333
Access to
Utili-ties
Percent of business owners without access to
pipe line water supply
0.333333 0.8625 0.766667
Percentage of owners without own electricity 0.083333 0.1 0.066667
Percentage of owners without modern fuels or
stove
0.766667 0.75 0.5
Percentage of owners without mobile phones
(active numbers)
0.566667 0.525 0.416667
<b>Exposure </b> Disaster
Expe-rience
Average number of days of electricity
disrup-tion during typhoon
0.24022346 0.180791 0.213873
Percentage of owners that did not receive
early warning
0 0 0
Average number of casualty (sickness/injury)
due to typhoon Nina
0 0.0125 0.016667
Average number of days of irregular supply
inputs due to typhoon Nina
0.17777778 0.0684932 0.071233
Average percentage of loss on productive
assets
0.05405405 0.0719424 0.115108
Average percentage of loss on household
assets
0.05769231 0.045977 0.046512
Average percentage of loss on income 0.08403361 0.0449704 0.12
</div>
<span class='text_page_counter'>(11)</span><div class='page_container' data-page=11>
respondents from Pili reported a relatively higher number of livelihoods. Pili is the capital
town of Camarines Sur where agriculture, manufacturing and service industries are observed
to be growing. It is where the Camarines Sur airport is located along with the provincial
of-fices, schools and car dealers. Other livelihoods mentioned by the respondents would include
mostly farming, carpentry, and laundry services.
A skill in farming was common among the sites.
Meanwhile, the informal food sector in Pili has the highest accessibility to credit while Naga
gets the lowest. They rely their financial needs mostly on microlending institutions, loan
sharks and from a few of their relatives. There is also a very high percentage at 92% of
in-formal food owners who are not confident that they can borrow money in times of calamity.
Only very few, in fact, a handful, have received livelihood assistance in the past twelve
months in Calabanga, Naga, and Pili. Joining any industry-related organization is not
com-mon to the informal food sellers in all areas. Meanwhile, about three-fourths of the sales in
Calabanga comes from the regular buyers or locally called as ‗suki‘. But in Naga, the sales
from ‗suki‘ comprise just a little more than one-fourth of their total sales. Overall, the
adap-tive capacity is highest in Pili and lowest in Calabanga.
<b>Sensitivity </b>
The informal food owners revealed that they do not have chronic illnesses. The common
sickness they experienced is flu. Some would even continue selling even if they are sick.
This can be shown by the low percentage result of the three areas at 7 percent to 8 percent.
They either go to a clinic or to a faith healer/herbalist for medication. Barely half of the
re-spondents from Calabanga, Naga, and Pili have medical insurance such as PhilHealth.
How-ever, only some find it very helpful.
</div>
<span class='text_page_counter'>(12)</span><div class='page_container' data-page=12>
are food insecure while only 13.33 percent of the sellers in Calabanga are food insecure.
Re-spondents believed that the presence of backyard farms in the rural area eases the issue on
food affordability and availability.
More than three-fourths of the informal food sellers in Naga and Pili own no water pipeline
in their homes. Only one-third from Calabanga does not own water pipelines. Meanwhile,
informal food sellers in Naga have the highest percentage without own electricity lines at 10
percent. Pili got the lowest percentage at 6.67 percent. In general, the sensitivity index is
highest in Naga and lowest in Calabanga.
<b>Exposure </b>
During typhoon Nina which occurred last December 25, 2016, electricity was restored
imme-diately in Naga than in Calabanga and Pili. It took an average of 35 days before it was
re-stored in Naga while barely 1.5 months in Calabanga and Pili. But all respondents were able
to receive the warning before the typhoon occurred.
Very few casualties were recorded among the respondents. In fact, only one from Naga and
one from Pili were reported as injured as a result of Typhoon Nina. It took them an average
of more or less a month before the agricultural supply gets back to normal. However, the
most affected supply was coconut. Respondents revealed that it would take a year before the
supply gets back to its regular flow of volume and price.
A higher percentage of loss of productive assets was accounted for by the informal food
sellers in Calabanga at 36 percent than in Naga and Pili. Meanwhile, more or less 3 percent
of the monthly income from Pili was reported as a loss while more than 6 percent in Naga
and Calabanga. Exposure index is highest in Calabanga and lowest in Naga.
</div>
<span class='text_page_counter'>(13)</span><div class='page_container' data-page=13>
indicators such as socio-demographic characteristics, livelihood strategies, and social
net-work.
Table 3. Vulnerability level of the informal food sector (LVI-IPCC)
<b>Sites</b> <b>Adaptive </b>
<b>ca-pacity</b>
<b>Sensitivity</b> <b>Exposure</b> <b>LVI-IPCC</b> <b>Vulnerability </b>
<b>Level</b>
<b>Calabanga</b> 0.69587 0.297916 0.087683 -0.18119 Moderate
<b>Naga </b> 0.749669 0.414063 0.060668 -0.28529 Low
<b>Pili</b> 0.719781 0.333333 0.083342 -0.21215 Low
<b>DISCUSSION </b>
</div>
<span class='text_page_counter'>(14)</span><div class='page_container' data-page=14>
The socio-demographic profile and livelihood strategy have the highest vulnerability level of
the three sites. The high dependency level of their household and the poor educational
back-ground of the food enterprise owners may serve as hindrance to becoming a resilient
enter-prise. Higher number of dependent may affect the food security level in the same way that
lack of education could lead to poor recovery. (Frankenberg, et.al, 2013)
The social network of the informal food sector is generally weak. Most of the indicators
un-der this factor revealed to have higher indices. Among which is their ability to improve their
financial status through credit and savings behavior. Barely half of the respondents could not
easily access avail loans. In fact, access to formal credit was found to be an impending factor
in expanding their businesses. A few sellers still opt to borrow from loan sharks who do not
demand numerous documents to avail an immediate cash loan.
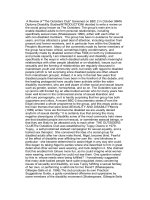
Figure 1. Spider web of vulnerability component factors
</div>
<span class='text_page_counter'>(15)</span><div class='page_container' data-page=15>
liveli-improving their business. They are already contented earning an average of PhP15,477 per
month. This validated the not so alarming food security status of the respondents.
Figure 2. Vulnerability factors of the three sites
</div>
<span class='text_page_counter'>(16)</span><div class='page_container' data-page=16>
Generally, the LVI analysis shows that the informal food sectors in Calabanga, Naga, and Pili
have small differences in the level of vulnerability. Using the seven indicators adopted from
Hahn et al (2009), the level of vulnerability of the three areas is characterized as low to
mod-erately vulnerable. This could probably be attributed to the relative economic security of their
food businesses. Many respondents were earning above the subsistence level. This indicator
alone can explain the reason for staying in the informality status for years. Another observed
factor that may contribute to reducing the level of vulnerability would be the status of
munic-ipality. All municipalities and city mentioned belong to the first class category. In the
busi-ness context, there is a huge market flow since they also attract other buyers from nearby
towns. This explains why most of the sellers' income comes from their ‗suki". There is a
pulling effect of economic growth to resiliency. The study may be further tested to the
in-formal food sector of depressed communities to determine if the economic level of a
munici-pality would really affect the vulnerability components of a street livelihood.
In order to address the limited marketing skills manifested by the informal food sector
</div>
<span class='text_page_counter'>(17)</span><div class='page_container' data-page=17>
of their respective commodities or ―one town one product‖ program. This may already pave
the way to encouraging them to slowly shift to a formal business system.
The unutilized skills of the informal food sector are a rich source of opportunity for various
industries. Due to economic hardships, they have found ways to learn hard skills in farming,
carpentry, and health and wellness. These skills are ideal alternatives during typhoons and
other disasters when agricultural commodities are not available. Professionalizing such
abil-ity may help improve their resiliency and address the scarcabil-ity of demand after typhoons.
REFERENCES
Acosta et al. (2014).Livelihood adaptation to impacts of extreme events in the Philippines: A
decade after the typhoon-induced disasters in Infanta, QuezonPaper presented in the
Na-tional Conference on Integrated Natural Resources and Environment Management
(NC-INREM 2014), Learning Lessons, Sharing Knowledge: Strengthening the Role of
INREM in Sustainable Development, held in SEARCA, Los Banos, Laguna on October
16 to 17, 2014.
Batangan, Dennis and Batangan, Ma. Theresa. Social security needs assessment survey for
the informal economy in the Philippines. Final Report on the ILO-SRO Manila Survey
Results. 2007
Ballano, V. O. (2016). The Government‘s Attitude Toward the Informal Sector and Piracy.
<i>In Sociological Perspectives on Media Piracy in the Philippines and Vietnam (pp. </i>
75-115). Springer, Singapore.
Boels, Dominique. (2014). It‘s better than stealing: informal street selling in Brussels.
Inter-national Journal of Sociology and Social Policy, Vol. 34 (Issue 9/10), 670-693
Can, N. D., Tu, V. H., & Hoanh, C. T. (2013). Application of livelihood vulnerability index
to assess risks from flood vulnerability and climate variability: A case study in the
<i>Me-kong Delta of Vietnam. Journal of Environmental Science and Engineering, 2, 476-486. </i>
Chambers, R. and Conway, R. (1992). Sustainable rural livelihoods: Practical concepts for
the 21st century. IDS discussion paper, No. 296. pp.127-130.
Colin C. Williams (2007): Entrepreneurs Operating in the Informal Economy: Necessity or
Opportunity Driven? Journal of Small Business & Entrepreneurship, 20:3, 309-319
Cuesta M, RanolaJr RF. 2008. Current vulnerability of the rice production sector to rainfall
</div>
<span class='text_page_counter'>(18)</span><div class='page_container' data-page=18>
Frankenberg, E., Sikoki, B., Sumantri, C., Suriastini, W., & Thomas, D. (2013). Education,
vulnerability, and resilience after a natural disaster. Ecology and society: a journal of
in-tegrative science for resilience and sustainability, 18(2), 16.
Hahn, M.B., Riederer, A.M. Foster, S.O. (2009). The livelihood vulnerability index: a
prag-matic approach to assessing risks from climate variability and change- a case study in
Mozambique. Global Environmental Change 19(1), 74-88
Garcia-Bolivar, Omar E. Informal economy: is it a problem, a solution or both? The
perspec-tive of the informal business. Available at
www.bg-consulting.com/docs/informalpaper.pdf
Jamil, S. (2013) Connecting the Dots: The Urban Informal Sector and Climate
Vulnerabilities in Southeast Asian Megacities. NTS Alert no. AL13-01, January
2013. Available at
Li, Yue and Rama, Martı´n. (2015) Firm Dynamics, Productivity Growth, and Job Creation
in Developing Countries: The Role of Micro- and Small Enterprises. TheWorld Bank
Research Observer, vol. 30, no. 1
Macapanpan, Ma. Lourdes. Informal economy. International Labor Organization. Available
at
Meyer, Natanya. (2016)Barriers to small informal business development and
entrepreneur-ship: The case of the emfuleni region. Polish Journal of Management Studies. Volume
13. Number 1.
Orencio, P. and Fujii, M. (2012) An index to determine the vulnerability of communities in a
<i>coastal zone: A case study in Baler, Aurora, Philippines. Royal Swedish Academy of </i>
<i>Sci-ences. DOI 10.1007/s13280-012-0331-0 </i>
Promises and challenges of the informal food sector in developing countries. FAO 2007.
The informal food sector: Municipal support policies for operators. Food in Cities Collection,
No. 4. FAO. 2003.
Simane, B., Zaitchik, B. F., & Foltz, J. D. (2016). Agroecosystem specific climate
vulnerabil-ity analysis: application of the livelihood vulnerabilvulnerabil-ity index to a tropical highland
<i>re-gion. Mitigation and Adaptation Strategies for Global Change, 21(1), 39–65. </i>
Talubo, J. P. P., Jacildo, A. J., Espaldon, M. V. O., Acosta, L. A., Macandog, D. M., Nelson,
G. L. M., ... & Dorado, M. A. (2015). Vulnerability to Rainfall-Induced Landslide of
<i>Three Communities in Infanta, Quezon, Philippines. International Journal of Sciences: </i>
<i>Basic and Applied Research (IJSBAR), 23, 138-166. </i>
Vo, Duc Hong and Ly, Thinh Hung. (2014) Measuring the Shadow Economy in the ASEAN
Nations: The IMIC Approach. International Journal of Economics and Finance; Vol. 6,
No. 10;
</div>
<span class='text_page_counter'>(19)</span><div class='page_container' data-page=19>
Williams, Colin C. (2011) Entrepreneurship, the informal economy and rural communities.
Journal of Enterprising Communities: People and Places in the Global Economy. Vol. 5
No. 2, pp. 145-157
</div>
<!--links-->
<a href='http:// consulting.com/docs/informalpaper.pdf'> </a>