làm giàu protein củ sắn bằng cách lên men với nấm men làm thức ăn cho lợn địa phương ở lào
Bạn đang xem bản rút gọn của tài liệu. Xem và tải ngay bản đầy đủ của tài liệu tại đây (1.34 MB, 54 trang )
<span class='text_page_counter'>(1)</span><div class='page_container' data-page=1>
1
<b>ĐẠI HỌC HUẾ </b>
<b>TRƯỜNG ĐẠI HỌC NÔNG LÂM </b>
<b>NOUPHONE MANIVANH </b>
LÀM GIÀU PROTEIN CỦ SẮN BẰNG CÁCH LÊN MEN VỚI
NẤM MEN LÀM THỨC ĂN CHO LỢN ĐỊA PHƯƠNG Ở
LÀO
<b>LUẬN ÁN TIẾN SĨ KHOA HỌC NÔNG NGHIỆP </b>
</div>
<span class='text_page_counter'>(2)</span><div class='page_container' data-page=2>
2
<b>ĐẠI HỌC HUẾ </b>
<b>TRƯỜNG ĐẠI HỌC NÔNG LÂM </b>
<b>NOUPHONE MANIVANH </b>
LÀM GIÀU PROTEIN CỦ SẮN BẰNG CÁCH LÊN MEN VỚI
NẤM MEN LÀM THỨC ĂN CHO LỢN ĐỊA PHƯƠNG Ở
LÀO
<b>CHUYÊN NGÀNH: CHĂN NUÔI </b>
<b>MÃ SỐ: 9620105 </b>
<b>LUẬN ÁN TIẾN SĨ KHOA HỌC NÔNG NGHIỆP </b>
<b> NGƯỜI HƯỚNG DẪN </b>
<b> 1: PHÓ GIÁO SƯ, TIẾN SĨ LÊ VĂN AN </b>
<b> 2: PHÓ GIÁO SƯ, TIẾN SĨ TRẦN THỊ THU HỒNG </b>
</div>
<span class='text_page_counter'>(3)</span><div class='page_container' data-page=3>
1
<b>GIỚI THIỆU </b>
<b>1. ĐẶT VẤN ĐỀ </b>
Lợn là một trong những động vật quan trọng nhất đối với các hộ chăn nuôi quy
mơ nhỏ ở vùng cao của Cộng Hịa Dân Chủ Nhân Dân Lào vì nó có thể được bán khi
cần tiền mặt để mua gạo và các thực phẩm khác, để trả học phí hoặc chi phí bệnh viện
cho người trong gia đình bị ốm và thịt lợn được sử dụng trong các nghi lễ truyền thống
của gia đình. Lợn có thể được nhốt trong một khu vực nhỏ, có thể thích ứng với nhiều
phụ phẩm nông nghiệp, nhà bếp và mang lại lợi nhuận đầu tư nhanh chóng (Steinfeld,
1998). Khoảng 75% hộ gia đình ở vùng cao trong nước đang ni lợn (FAO, 2017).
Nhìn chung, lợn bản địa chiếm khoảng 85,1% trong hệ thống chăn nuôi quy mô nhỏ
(DLF, 2017), chúng rất khỏe mạnh và có thể kiếm thức ăn cho chúng trong điều kiện tự
do, lợn bản địa được nuôi chủ yếu trong các hệ thống đầu tư thấp chủ yếu từ thức ăn tự
nhiên (Kennard, 1996; FLSP, 2002). Ở hầu hết các vùng của Lào, phụ phẩm nông
nghiệp, như cám gạo và cỏ tự nhiên là thức ăn chính cho lợn (ILRI 2002). Ở các vùng
nơng thơn Lào, nơi hầu hết nông dân đang trồng lúa để bán, thức ăn cho lợn là cám gạo
cho ăn cùng với một lượng nhỏ thức ăn xanh. Do đó, cám gạo có sẵn ở hầu hết các hộ
nông dân nhưng giá trị dinh dưỡng cám gạo không cao. (ILRI, 2002; FLSP, 2002). Do
thức ăn chiếm khoảng 50-60% chi phí sản xuất, nên chất lượng thức ăn rất quan trọng
đối với sự thành công của hoạt động chăn ni lợn. Các vấn đề chính có thể xảy ra do
thức ăn chất lượng thấp dẫn đến kém ăn, tăng trưởng chậm, tỷ lệ chuyển đổi thức ăn
cao và tỷ lệ sống thấp do các vấn đề về chất lượng nguyên liệu, công thức thức ăn, công
nghệ chế biến, lưu trữ và quản lý thức ăn. Vấn đề chính là việc cung cấp protein như
đậu nành và bột cá nhưng lại khơng có sẵn ở các vùng nông thôn và đắt đỏ
(Phengsavanh và Stür., 2006).
</div>
<span class='text_page_counter'>(4)</span><div class='page_container' data-page=4>
2
(2016a) protein thực của củ sắn tăng từ 2 đến 7% trong chất khô (DM). Những phát
hiện tương tự đã được báo cáo bởi Balagopalan và cộng sự, (1988), họ đã phát triển
một quá trình lên men ở trạng thái rắn để làm giàu protein của bột sắn và chất thải của
<i>nhà máy tinh bột sắn bằng nấm Trichoderma pseudokonigii rifai. Lên men bằng nấm </i>
men, vi khuẩn đã được nghiên cứu để làm giảm các thành phần phi dinh dưỡng, làm
tăng giá trị dinh dưỡng của các sản phẩm phụ nông nghiệp (Okpako et al 2008;
Aderemi et al 2007; Trần Thị Thu Hồng và Nguyễn Văn Ca, 2013). Phosphate bổ sung
dẫn đến tăng sinh khối của nấm men và vi khuẩn (Papagianni et al 1999). Hữu và
Khammeng, (2014) đã báo cáo rằng khi thay thế ngô bằng bột sắn lên men có chứa
13% protein thơ ( theo VCK), tỷ lệ tiêu hóa và tồn dư Nito tương tự như khẩu phần đối
chứng. Protein làm giàu từ củ sắn có thể cung cấp trong khẩu phần ăn của lợn tới 25
đến 28% protein trong khẩu phần ăn dựa trên bột sắn (hoặc củ sắn ủ), thay thế lá khoai
môn ủ (Vanhnsin và Preston, 2016b) hoặc bột đậu nành (Sengxayalth và Preston,
2017b). Cũng tương tự như tăng trưởng ở lợn được báo cáo bởi Phương và cộng sự,
(2013) đối với bột sắn được làm giàu từ 3 đến 5,5% protein thực khi sử dụng nấm
<i>Aspergillus niger để ủ. </i>
Thức ăn địa phương được sử dụng trong các hệ thống chăn nuôi nhỏ cho lợn
bao gồm phụ phẩm gạo, thức ăn từ cây trồng và các nguyên liệu từ thực vật xanh khác
nhau (ILRI 2002). Tuy nhiên, thức ăn địa phương có giá trị dinh dưỡng thấp. Phụ nữ
thường là những người chủ chốt trong việc này, theo thông lệ truyền thống, họ dành 2
đến 3 giờ mỗi ngày để thu thập và chuẩn bị thức ăn cho lợn (Trung tâm Nghiên cứu
Nông nghiệp Quốc tế Úc 2010). Nơng dân có ít kiến thức về tối ưu hóa việc sử dụng
các nguồn thức ăn hiện có, tốc độ tăng trưởng của lợn chỉ 100 đến 120 g / ngày nếu phụ
thuộc vào thức ăn địa phương. Trong thức ăn hoàn chỉnh thương mại, các nguồn
protein phổ biến nhất là bột cá và bột đậu nành. Những thức ăn này cung cấp protein
chất lượng cao cho lợn, nhưng chúng được nhập khẩu và đắt tiền. Do giá cao, các
nguồn protein như vậy không thể được sử dụng bởi các hộ nông dân nghèo
(Phengsavanh và cs, 2010). Vì vậy, cải thiện giá trị dinh dưỡng dồi dào của thức ăn địa
phương trong vùng của họ, đặc biệt là ứng dụng lên men vi sinh vật, có thể cải thiện giá
trị dinh dưỡng của thức ăn địa phương và sử dụng làm thức ăn cho lợn địa phương ở
Lào, giúp giảm chi phí thức ăn và mang lại lợi ích kinh tế cho nơng dân ở vùng nông
thôn.
<b>2. MỤC TIÊU </b>
Mục đích tổng thể của luận án này là cải thiện giá trị dinh dưỡng của củ sắn
<i>bằng cách lên men với nấm (Saccharomyces cerevisiae), phụ gia Urea và di-ammonium </i>
phosphate như là nguồn protein sử dụng trong khẩu phần của lợn Moo Lath. Mục tiêu
cụ thể là:
• Nghiên cứu giá trị dinh dưỡng của củ sắn bằng cách lên men với nấm
<i>(Saccharomyces cerevisiae), phụ gia Urê và Di-ammonium phosphate </i>
</div>
<span class='text_page_counter'>(5)</span><div class='page_container' data-page=5>
3
• Đánh giá việc sử dụng củ sắn đã làm giàu protein như là một phần thay thế
thân lá khoai môn ủ chua trong chế độ ăn có thân cây chuối – là khẩu phần cơ sở cho
lợn Moo Lath.
<b>CHƯƠNG 1 </b>
<b>TỔNG QUAN NGHIÊN CỨU </b>
Có những điểm chính sau: (i) Chăn ni lợn ở Lào; (ii) nhu cầu về protein và axit amin
đối với lợn đang phát triển; (iii) thức ăn cho lợn ở Lào; (iv) phương pháp cải thiện giá
</div>
<span class='text_page_counter'>(6)</span><div class='page_container' data-page=6>
4
<b>CHƯƠNG 2 </b>
<b>CẢI THIỆN GIÁ TRỊ DINH DƯỠNG CỦA CỦ SẮN </b>
<i><b>(Manihot esculenta Crantz) </b></i>
<b>ĐẶT VẤN ĐỀ </b>
Những vấn đề chính của chăn ni lợn quy mơ nhỏ ở vùng cao của CHDCND
Lào là tỷ lệ chết của lợn con cao và tốc độ sinh trưởng thấp. Hầu hết tất cả các giống
lợn thuộc giống địa phương (Mou Lath), được quản lý trong các hệ thống bẩn và chịu
sự bất cập về thức ăn cả chất lượng và số lượng. Theo khảo sát của Phonepaseuth và
cs, (2010), hầu hết lợn con ở vùng cao có tốc độ sinh trưởng thấp (20-50 g / ngày) và tỷ
lệ chết cao (30-50%). Lợn cai sữa cần từ 5 đến 8 tháng để đạt trọng lượng sống từ 20
đến 30 kg.
Củ sắn bao gồm carbohydrate và do đó là nguồn năng lượng chủ yếu. Hàm
lượng tinh bột thay đổi từ 32 đến 35% khối lượng của củ tươi và 80 đến 90% khối
lượng củ khô (Montagnac et al., 2009). Hàm lượng protein là không đáng kể, từ 1 đến
3% chất khô (Buitrago, 1990).
Một cách để cải thiện hàm lượng protein trong thức ăn giàu carbohydrate là lên
men ở trạng thái rắn với nấm men (Araujo và cs, 2008; Hong và Ca, 2013). Quá trình
<i>lên men của bột sắn với S. cerevisiae đã tăng mức protein từ 4,4% lên 10,9% theo VCK </i>
và làm giảm hàm lượng xyanua (Oboh và Kindahunsi, 2005).
Lên men trạng thái rắn của củ sắn bằng urê và di-ammonium phosphate (DAP)
là một cơng nghệ đầy hứa hẹn vì nó có khả năng nâng hàm lượng protein lên mức cần
thiết để cân bằng carbohydrate, do đó tạo ra khẩu phần thức ăn gần như hoàn chỉnh cho
động vật như lợn và gia cầm (Boonnop và cs, 2009).
Thực tế, trong các nghiên cứu được báo cáo cho đến nay là không phải tất cả
các hợp chất nitơ được thêm vào (urê và DAP) đã được chuyển đổi thành protein thực,
mức độ không bao giờ vượt quá 50 đến 70% protein thơ trong các thí nghiệm với củ
sắn lên men (Vanhnasin và Preston, 2016a) và bột củ sắn (Sengxayalth và cs, 2017a).
Nấm men không thể trực tiếp sử dụng urê mà trước tiên phải được thủy phân thành
amoniac bằng urease. Tuy nhiên, hoạt động của urease bị ức chế ở pH thấp (Kay và
Reid, 1934), giảm nhanh khi củ sắn được lên men.
<b>THÍ NGHIỆM 1. </b>
<b>VẬT LIỆU VÀ PHƯƠNG PHÁP NGHIÊN CỨU </b>
<b>Địa diểm </b>
</div>
<span class='text_page_counter'>(7)</span><div class='page_container' data-page=7>
5
nằm cách thành phố Luông Pha Băng, CHDCND Lào 7 km. Nhiệt độ trung bình hàng
ngày ở khu vực này tại thời điểm thí nghiệm là 27° C (khoảng 22-32 ° C).
<b>Thiết kế thí nghiệm </b>
Thí nghiệm được bố trí như một 2 * 3 * 4 yếu tố trong một thiết kế hoàn toàn
ngẫu nhiên (CRD) với 4 lần lặp trong từng giai đoạn.
Các nghiệm thức là:
<b>Xử lý củ sắn </b>
<i>Hấp (ST) và không hấp (NST) </i>
<b>Di-ammonium phosphate DAP: </b>
0, 1 đến 2% củ sắn dạng tươi
Quy trình
<b>Thời gian (ngày) </b>
Ngày 0, 3, 7 và 14
<i><b>Hấp </b></i>
Củ sắn được gọt vỏ và băm nhỏ bằng tay thành những miếng nhỏ (1-2 cm). Một
phần được hấp trong 30 phút trong một cái rổ tre đặt trên chảo chứa nước sôi. Thành
phần của các khối ủ đã tăng tỷ lệ DAP từ 0 đến 2% và cân bằng Nito trong mỗi nghiệm
thức bằng urê với lượng nấm men cố định là 3% để kiểm tra giá trị dinh dưỡng của củ
sắn sau khi lên men. Củ sắn hấp được lấy ra khỏi rổ tre để nguội trong 15 phút. Củ sắn
<i>hấp và khơng hấp sau đó được trộn với urê, men (Saccharomyces cerevisiae) và DAP </i>
(bảng 1). Tỷ lệ urê được thay đổi tùy theo mức độ DAP sao cho các khối ủ là cân bằng
nitơ. Các khối ủ sau đó được chuyển vào các rổ tre được phủ bằng lưới nhựa để cho
phép không khí vào tự do (ảnh 2) và lên men trong 14 ngày.
<b>Bảng 1. Thành phần của khối ủ (theo VCK) </b>
<b>Nghiệm </b>
<b>thức </b> <b>Củ sắn, % </b>
<b>Nấm men, </b>
<b>% </b> <b>DAP#, % </b> <b>Urea, % </b>
DAP-0 95 3 0 2
DAP-1 94.3 3 1 1.7
DAP-2 93.6 3 2 1.4
<i> #Phosphorus 20% </i>
</div>
<span class='text_page_counter'>(8)</span><div class='page_container' data-page=8>
6
<b>Các chỉ tiêu theo dõi </b>
Vào các ngày 0, 3, 7 và 14 mẫu được lấy từ các nghiệm thức. Có bốn lần lặp lại
trong mỗi giai đoạn của nghiệm thức (mẫu không lặp lại các phép đo trong từng giai
đoạn) và mẫu được phân tích các chỉ tiêu: VCK, Nito, chất hữu cơ và protein thực.
Trọng lượng tươi của khối ủ của mỗi nghiệm thức được cân tại mỗi khoảng thời gian để
xác định VCK trong q trình lên men.
<b>Phân tích hóa học </b>
VCK, Nito và khống được phân tích theo phương pháp AOAC, (1990). Để ước
tính protein thực, 2 g mẫu tươi được cho vào bình Erlenmeyer 125ml với 50 ml nước
cất, để yên trong 30 phút, sau đó 10ml TCA (axit trichloracetic) được thêm vào và để
yên trong 20-30 phút nữa. Sau đó mẫu được lọc qua giấy Whatman # 4 bằng trọng lực.
Dịch lọc được loại bỏ và giấy lọc còn lại và chất nền lơ lửng được chuyển sang bình
kjeldahl để ước tính tổng lượng Nito. Chỉ tiêu protein thô và protein thực được thực
hiện trên mẫu tươi.
<b>Phân tích thống kê </b>
Số liệu được phân tích bằng tùy chọn Mơ hình tuyến tính chung (GLM) trong
chương trình ANOVA của phần mềm Minitab, (2010) (phiên bản 16.0). Trong mơ
hình, các nguồn của biến thể là các nghiệm thức, tương quan nghiệm thức và sai số
ngẫu nhiên. So sánh cặp Turkey được sử dụng để xác định sự khác biệt. Các mơ hình
thống kê được sử dụng là:
Yijk = µ +ci +dj + tk + (c*d*t)ijk + eijk
Yijk là các biến phụ thuộc; µ: trung bình quần thể; ci là ảnh hưởng của củ sắn, dj là ảnh
hưởng của DAP; tk là ảnh hưởng của thời gian; (c*d*t)ijk là sự tương tác giữa ba yếu tố;
eijk là sai số ngẫu nhiên.
<b>KẾT QUẢ VÀ THẢO LUẬN </b>
Hấp củ sắn trước khi lên men dường như có tác dụng (p = 0,67) đối với việc
chuyển đổi protein thô thành protein thực (bảng 2). Việc tăng tỷ lệ DAP từ 0 đến 2%
theo VCK đã làm tăng mức trung bình của protein thực của khối ủ từ 4,16 đến 5,85%
theo VCK (bảng 2). Tỷ lệ protein thực trong khối ủ tăng theo xu hướng đường cong
tuyến tính (R2<sub> = 0,98) từ 2,3 đến 6,9% theo VCK khi thời gian lên men tăng từ 0 đến 14 </sub>
ngày; protein thô là 10,5 theo VCK sau khi ủ và không thay đổi vào cuối thời gian lên
men. Tỷ lệ protein thực so với protein thô tăng từ 24,6 lên 63,7 so với cùng thời gian
(bảng 2; hình 1 và 2). Tuy nhiên, theo (Vanhnasin và Preston, 2016b) cho thấy VCK,
protein thô (CP) và protein thực (TP) của củ sắn được lên men (14 ngày) mà khơng có
cơ chất là VCK 29,5%, CP 3%, TP 1,5% nhưng hàm lượng của khoáng là cao (97%).
<b> Bảng 2. Giá trị trung bình của VCK, chất hữu cơ (OM), protein thô; protein thực và </b>
tỷ lệ TP / CP ở các giai đoạn khác nhau của quá trình lên men (% theo VCK)
<b>VCK </b> <b>OM </b> <b>CP </b> <b>TP </b> <b>TP/CP </b>
</div>
<span class='text_page_counter'>(9)</span><div class='page_container' data-page=9>
7
ST 28.45 87.25 10.40 5.15 47.10
NST 30.34 87.58 10.37 4.90 48.09
SEM 0.344 0.929 0.068 0.039 1.540
<i>p </i> 0.008 0.812 0.806 0.004 0.665
<b>DAP, % VCK </b>
0 29.89 87.14 10.13b <sub>4.16</sub>c <sub>36.77</sub>b
1 29.52 87.78 10.53a <sub>5.08</sub>b <sub>50.05</sub>a
2 28.78 87.32 10.50a <sub>5.85</sub>a <sub>55.70</sub>a
SEM 0.422 1.138 0.084 0.047 1.887
<i>p </i> 0.247 0.921 0.025 <0.001 0.001
<b>Thời gian (ngày) </b>
0 29.6b <sub>87.41 </sub> <sub>10.47 </sub> <sub>2.30</sub>d <sub>24.59</sub>c
3 24.69c <sub>85.71 </sub> <sub>10.46 </sub> <sub>4.43</sub>c <sub>42.31</sub>b
7 29.34b <sub>86.44 </sub> <sub>10.47 </sub> <sub>6.52</sub>b <sub>59.76</sub>a
14 33.97a <sub>90.09 </sub> <sub>10.14 </sub> <sub>6.87</sub>a <sub>63.72</sub>a
SEM 0.487 1.314 0.097 0.055 2.179
<i>p </i> <0.001 0.199 0.121 <0.001 <0.001
<i><b> </b></i><b>abc </b><i>Các giá trị trung bình trong cùng một hàng có chữ cái khác nhau thì có sự </i>
<i>khác nhau có ý nghĩa thống kê p<0,05. </i>
<i> DAP: di-ammonium phosphate; VCK: vật chất khô, OM: chất hữu cơ, CP: protein </i>
<i>thô, TP: protein thực, </i>
Các giá trị cuối cùng sau 14 ngày lên men được tăng từ 5,63 lên 8,33%. Tỷ lệ
protein thực so với protein thô tăng từ 46,56 lên 81,35 sau 14 ngày lên men (bảng 3).
<b> Bảng 3. Ảnh hưởng của DAP đến hàm lượng protein thô, protein thực và tỷ lệ TP </b>
/ CP sau 14 ngày lên men (% theo VCK)
DAP, % theo VCK
0 1 2 SEM <i>p </i>
CP 9.65 10.51 10.25 0.168 0.279
TP 5.63c <sub>6.65</sub>b <sub>8.33</sub>a <sub>0.095 </sub> <sub><0.001 </sub>
TP/CP 46.56b <sub>63.25</sub>ab <sub>81.35</sub>a <sub>3.773 </sub> <sub>0.049 </sub>
<i><b> </b></i><b>abc </b><i>Các giá trị trung bình trong cùng một hàng có chữ cái khác nhau thì có sự </i>
<i>khác nhau có ý nghĩa thống kê p<0,05. </i>
<i> DAP: di-ammonium phosphate; VCK: vật chất khô, CP: protein thô, TP: protein </i>
<i>thực, </i>
<b>Thay đổi khối lượng khối ủ trong quá trình lên men </b>
</div>
<span class='text_page_counter'>(10)</span><div class='page_container' data-page=10>
8
<b> Bảng 4. Thay đổi khối lượng khối ủ tươi (FM) và vật chất khô (VCK) trong quá </b>
trình lên men
<b>Ngày </b> <b>FM, kg </b> <b>%VCK </b> <b>VCK, kg </b>
0 1.00a <sub>29.6</sub>b <sub>0.29</sub>a
3 0.94a <sub>24.7</sub>c <sub>0.23</sub>b
7 0.79b <sub>29.3</sub>b <sub>0.23</sub>bc
14 0.62c <sub>33.9</sub>a <sub>0.21</sub>c
SEM 0.013 0.708 0.006
<i>p </i> <0.001 <0.001 <0.001
<i><b> </b></i><b>abc </b><i>Các giá trị trung bình trong cùng một hàng có chữ cái khác nhau thì có sự </i>
<i>khác nhau có ý nghĩa thống kê p<0,05. </i>
Protein thơ và chất hữu cơ g/kg VCK sau khi trộn khối ủ không thay đổi vào
cuối thời gian lên men (ngày 0 đến ngày 14). Tỷ lệ protein thực đã tăng từ 22,98 lên
69,51 từ 0 đến 14 ngày và có sự khác biệt giữa thời gian lên men (bảng 5).
<b>Bảng 5. Thành phần hóa học (g/kg theo VCK) </b>
Ngày OM CP TP
0 874.09 104.71 22.98a
3 857.10 104.60 44.32b
7 864.43 104.74 65.15c
14 900.86 101.36 69.51d
SEM 13.137 0.967 0.568
<i>P </i> 0.199 0.121 <0.001
<i><b> </b></i><b>abc </b><i>Các giá trị trung bình trong cùng một hàng có chữ cái khác nhau thì có sự </i>
<i>khác nhau có ý nghĩa thống kê p<0,05. </i>
<b>THÍ NGHIỆM 2. </b>
<b>VẬT LIỆU VÀ PHƯƠNG PHÁP NGHIÊN CỨU </b>
<i><b>Đại điểm: </b></i>
Thí nghiệm được thực hiện trong Phịng thí nghiệm của bộ môn Khoa học Động
vật, Khoa Nông nghiệp và Tài nguyên Rừng, Đại học Souphanouvong. Địa điểm này
nằm cách thành phố Luông Pha Băng, CHDCND Lào 7 km.
<b>Thiết kể thí nghiệm </b>
</div>
<span class='text_page_counter'>(11)</span><div class='page_container' data-page=11>
9
Thiết kế thí nghiệm là sự sắp xếp 2 * 9 yếu tố trong một thiết kế hoàn toàn ngẫu
nhiên (CRD) với 2 nghiệm thức kết hợp và với 4 lần lặp lại mỗi giai đoạn. Khối ủ (theo
VCK) bao gồm 93,6% củ sắn, 3% men, 1,4% urê và 2% di-ammonium phosphate
(DAP) trong điều kiện hiếu khí và kỵ khí, được lên men trong 9 ngày (giai đoạn) (0, 3h,
1, 2, 3, 4, 5, 6 và 7 ngày).
<i><b>Quy trình </b></i>
Củ sắn được gọt vỏ và cắt thành miếng nhỏ (1-2 cm) và hấp trong 30 phút trong
một cái rổ tre đặt trên chảo chứa nước sơi. Sau đó, nó được làm nguội trong 15 phút
<i>trước khi trộn với men (S. cerevisiae), urê và DAP (tất cả các thành phần này được sử </i>
dụng cùng loại như thí nghiệm 1). Một nửa khối ủ chuyển vào rổ tre được phủ lưới
nhựa để cho khơng khí vào tự do và lên men trong 7 ngày (điều kiện hiếu khí). Phần
cịn lại của khối ủ được đóng gói chặt vào túi nhựa 0,5 lít, đóng kín (điều kiện yếm khí)
và được bảo quản trong 7 ngày.
<b>Các chỉ tiêu theo dõi </b>
Mẫu được lấy từ mỗi nghiệm thức / lặp lại vào ngày 0 (3 giờ sau khi ủ), và sau
đó cứ sau 24 giờ cho đến khi kết thúc quá trình lên men để xác định pH, protein thơ,
protein thực và amoniac.
<b>Phân tích hóa học </b>
pH của từng mẫu được đo bằng máy đo pH kỹ thuật số, phân tích amoniac bằng
phương pháp chưng cất hơi nước sau khi bổ sung natri hydroxit (AOAC, 1990). Protein
thơ được phân tích bằng cách công phá kjeldahl bằng axit sulfuric sau đó chưng cất
theo phương pháp AOAC, (1990). Để ước tính protein thực , 2 g mẫu tươi được cho
vào bình Erlenmeyer 125ml với 50 ml nước cất, để yên trong 30 phút, sau đó 10ml
TCA (axit trichloroacetic) được thêm vào và cho để yên trong 20-30 phút nữa. Mẫu
được lọc qua giấy Whatman # 4 bằng trọng lực. Dịch lọc loại bỏ, giấy lọc còn lại và
mẫu lọc được chuyển sang bình kjeldahl để ước tính tổng lượng Nito.N- Urea được ước
tính bằng cách lấy protein-Nito thô trừ Nito-protein thực và Nito-ammonia. Các chỉ tiêu
protein thô, protein thật và amoniac được thực hiện trên các mẫu tươi.
<b>Phân tích thống kê </b>
Số liệu được phân tích bằng tùy chọn Mơ hình tuyến tính chung (GLM) trong
chương trình ANOVA của phần mềm Minitab, (2010) (phiên bản 16.0). Trong mơ
hình, các nguồn của biến thể là các nghiệm thức, tương quan nghiệm thức và sai số
ngẫu nhiên. So sánh cặp Turkey được sử dụng để xác định sự khác biệt; thời gian khi
<b>giá trị P của F kiểm tra P <0,05. Các mô hình thống kê được sử dụng là: </b>
Yij = µ +ai +tj + (a*t)ij + e<i>ij </i>
<b>Yij là các biến phụ thuộc; µ trung bình quần thể; ai</b> là ảnh hưởng của điều kiện
<b>(hiếu khí và kỵ khí); tj là ảnh hưởng của thời gian; (a*t)ij là sự tương tác giữa hai yếu </b>
</div>
<span class='text_page_counter'>(12)</span><div class='page_container' data-page=12>
10
<b>KẾT QUẢ VÀ THẢO LUẬN </b>
<b>Thành phần hóa học của khối ủ </b>
pH giảm theo thời gian lên men, theo xu hướng gần như tuyến tính, từ 5,8 ngay
sau khi ủ, xuống 5,47 trong 3h và xuống 3,43 sau 7 ngày (bảng 1). Tỷ lệ protein thô sau
khi trộn khối ủ với chất phụ gia là 10,35% theo VCK và không thay đổi trong 7 ngày
lên men. Tỷ lệ protein thực trong khối tăng từ 2,37 đến 6,97% theo VCK khi thời gian
lên men tăng từ 0 lên 7 ngày, do đó tỷ lệ giữa protein thực với protein thơ tăng từ 22,95
lên 66,11 so với cùng thời gian (bảng 1). Khơng có sự khác biệt trong tất cả các chỉ tiêu
này giữa điều kiện hiếu khí và kỵ khí, ngồi xu hướng pH giảm nhanh hơn một chút
trong 4 ngày đầu tiên trong điều kiện yếm khí sau đó là tốc độ giảm chậm để đạt đến
mức gần như giá trị cuối cùng sau 7 ngày với điều kiện hiếu khí.
<b>Bảng 1. Thay đổi độ pH, protein thô (CP), protein thực (TP) và amoniac trong củ sắn </b>
lên men với nấm men, urê và DAP trong điều kiện hiếu khí hoặc kỵ khí
<b> </b> <b>pH </b> <b>Ammonia </b> <b>CP </b> <b>TP </b> <b>TP/CP </b>
<i><b>Điều kiện </b></i>
Kỵ khí 4.27 0.40 10.40 4.86 46.66
Hiếu khí 4.66 0.42 10.41 4.87 46.72
SEM 0.013 0.001 0.045 0.022 0.070
<i>p </i> <0.001 <0.001 0.792 0.773 0.537
<i><b>Thời gian </b></i>
<i><b>(ngày) </b></i>
0 5.83a <sub>0.49</sub>a <sub>10.35 </sub> <sub>2.37</sub>i <sub>22.95</sub>i
3h 5.47b <sub>0.48</sub>ab <sub>10.26 </sub> <sub>3.21</sub>h <sub>31.30</sub>h
1 4.87c <sub>0.46</sub>b <sub>10.55 </sub> <sub>3.74</sub>g <sub>35.46</sub>g
2 4.64d <sub>0.45</sub>c <sub>10.47 </sub> <sub>4.23</sub>f <sub>40.40</sub>f
3 4.32e <sub>0.41</sub>d <sub>10.29 </sub> <sub>5.08</sub>e <sub>49.39</sub>e
4 4.11f <sub>0.39</sub>e <sub>10.55 </sub> <sub>5.54</sub>d <sub>52.49</sub>d
5 3.90g <sub>0.36</sub>f <sub>10.35 </sub> <sub>6.14</sub>c <sub>59.36</sub>c
6 3.63h <sub>0.34</sub>g <sub>10.29 </sub> <sub>6.46</sub>b <sub>62.75</sub>b
7 3.43i <sub>0.30</sub>h <sub>10.55 </sub> <sub>6.97</sub>a <sub>66.11</sub>a
SEM 0.027 0.003 0.096 0.046 0.148
<i>p </i> <0.001 <0.001 0.144 <0.001 <0.001
<i><b> </b></i><b>abc </b><i>Các giá trị trung bình trong cùng một hàng có chữ cái khác nhau thì có sự </i>
<i>khác nhau có ý nghĩa thống kê p<0,05. </i>
<i>pH: Power of/potential Hydrogen; CP: protein thô, TP: protein thực; p: probability; </i>
<i>SEM: sai số chuẩn của số trung bình; CP and TP (% theo VCK) </i>
</div>
<span class='text_page_counter'>(13)</span><div class='page_container' data-page=13>
11
men?; và ii) tại sao urê khơng bị thủy phân hồn tồn thành amoniac? Câu hỏi thứ hai
có lẽ có thể được giải thích là kết quả của sự giảm nhanh chóng pH, cơ chất ức chế hoạt
động của urease, hoạt động của nó bị giảm ở pH thấp (Kay và Reid, 1934).
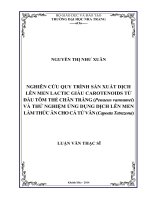
<b>Biểu đồ 3. Phân phối nitơ dưới dạng urê, amoniac và protein thực khi </b>
<b>bắt đầu và sau 7 ngày lên men </b>
<b>THẢO LUẬN </b>
Sự gia tăng hàm lượng protein thực của củ sắn bằng cách lên men với nấm men,
urê và DAP đã được báo cáo từ một số nhà nghiên cứu. Lên men vỏ sắn bằng nuôi cấy
<i>S. cerevisiae đã tăng hàm lượng protein từ 2,4% lên 14,1% ( Antai và Mbongo, (1994)). </i>
<i>Oboh và Kindahunsi, (2005) báo cáo rằng quá trình lên men bột sắn với S. cerevisiae </i>
đã làm tăng mức protein từ 4,4% lên 10,9% theo VCK. Krisada và cs, (2009) đã thực
hiện một quá trình lên men tương tự với củ sắn tươi sử dụng urê và men. Protein thô
tăng từ 3,2 đến 21,1% theo VCK với 90% protein thô ở dạng protein thực. Phiny và cs,
(2012) lên men gạo tấm trong một hệ thống yếm khí chính là mơ hình sản xuất rượu
gạo của nơng dân. Sự khác biệt trong quy trình là bổ sung urê (1% của gạo) cũng như
men và không cần chưng cất. Hàm lượng protein thô được tăng từ 7% theo VCK trong
gạo lên 23% theo VCK sau khi lên men trong 3 ngày. Tỷ lệ protein thô và protein thực
không được xác định nhưng tốc độ tăng trưởng của lợn tăng 37% khi gạo làm giàu
protein được đưa vào khẩu phần ăn, cải thiện 16,5% về tốc độ sinh trưởng so với khẩu
phần được bổ sung bằng bột cá, chỉ ra rằng phần lớn sự gia tăng của protein thô là
protein thực sự. Manivanh và Preston, (2016) đã sử dụng củ sắn làm nguồn
carbohydrate, với sự kết hợp của DAP như một nguồn phốt pho với men và urê. Hàm
lượng protein thực của củ sắn đã tăng lên 14% trong theo VCK (từ 2,5% ở củ chưa lên
men) và tốc độ tăng trưởng của lợn Moo Lath đã tăng 46% so với khẩu phần ăn đối
chứng có protein từ lá, cuống lá môn được ủ).
</div>
<span class='text_page_counter'>(14)</span><div class='page_container' data-page=14>
12
so sánh về tác động của hàm lượng phốt pho trong việc làm giàu protein của tinh bột
với nấm men và urê.
Khơng có các hợp chất nitơ bổ sung như (urê và DAP) được chuyển đổi thành
protein thực, mức bổ sung không bao giờ vượt q 50 đến 70% protein thơ trong các thí
nghiệm với củ sắn lên men (Vanhnasin và Preston , 2016a) và bột củ sắn (Sengxayalth
và cs, 2017a). Khi giải quyết vấn đề này, từ thí nghiệm 1 đã tăng mức độ DAP lên 2%
khối ủ, giảm lượng urê xuống còn 1,2%. Điều này có tác dụng làm tăng hàm lượng
phốt pho trong khối ủ với sự tăng lên liên quan về tỷ lệ Nito được thêm vào dưới dạng
amoniac, thay thế Nito-urê. Sự gia tăng tuyến tính trong tỷ lệ giữa protein thực với
protein thô được cho là do hàm lượng phốt pho tăng lên, nhưng một giải thích khác có
thể là sự thay đổi một phần trong nguồn gốc của NPN được thêm vào - từ urê thành
amoniac. Nấm men không thể trực tiếp sử dụng urê mà trước tiên phải được thủy phân
thành amoniac bằng urease. Tuy nhiên, hoạt động của urease bị ức chế ở pH thấp (Kay
và Reid, 1934), giảm nhanh khi củ sắn được lên men.
<b>KẾT LUẬN </b>
Protein thực trong củ sắn tăng theo xu hướng tuyến tính (R2<sub> = 0,98) từ 2,3 đến </sub>
6,87% theo VCK khi thời gian lên men tăng từ 0 ngày lên 14 ngày, tỷ lệ protein thực từ
protein thô tăng từ 24,6 lên 63,7 so với cùng thời điểm.
Tăng tỷ lệ DAP từ 0 đến 2% theo VCK, khối ủ đã tăng protein thực từ 5,6 lên
7,3 % sau 14 ngày lên men.
30% VCK ban đầu đã được lên men trong quá trình chuyển đổi một phần
carbohydrate ban đầu thành protein thực sau 14 ngày lên men
Hấp củ sắn trước khi lên men có tác dụng tích cực trong việc chuyển đổi protein
thô thành protein thật.
Độ pH giảm theo thời gian lên men, theo xu hướng gần như tuyến tính, từ 5,8
ngay sau khi ủ, xuống 5,4 trong 3 giờ và xuống còn 3,43 sau 7 ngày
Hàm lượng protein thô sau khi ủ với chất phụ gia là 10,35% theo VCK và
không thay đổi trong 7 ngày lên men.
Khơng có sự khác biệt giữa điều kiện hiếu khí và kỵ khí, ngoại trừ xu hướng pH
giảm nhanh hơn một chút trong 4 ngày đầu tiên trong điều kiện yếm khí sau đó là tốc
độ giảm chậm để đạt gần như cùng giá trị cuối cùng sau 7 ngày với điều kiện hiếu khí.
Có một đề nghị rằng sự chuyển đổi khơng hồn tồn của N-ure và N-amoniac
thành protein nấm men là do sự thủy phân khơng hồn toàn của urê thành amoniac do
tác dụng của urease bị ức chế vì giảm pH trong quá trình lên men.
<b>CHƯƠNG 3 </b>
</div>
<span class='text_page_counter'>(15)</span><div class='page_container' data-page=15>
13
<i><b>BẢN CÓ CHỨA THÂN CÂY CHUỐI (Musa sapientum Linn) CHO LỢN Ở </b></i>
<b>NƠNG HỘ NHỎ TẠI LÀO </b>
<b>TĨM TẮT </b>
Một thí nghiệm sinh trưởng đã được thực hiện với 12 con lợn Moo Lath với
trọng lượng ban đầu trung bình 14,8 ± 1,89 kg bố trí hồn tồn ngẫu nhiên vào 4
nghiệm thức với ba lần lặp lại. Mục đích của nghiên cứu là xác định hiệu quả của việc
thay thế thân cây môn ủ chua (TS) bằng củ sắn đã được làm giàu protein (PECR) trong
khẩu phần ăn cơ bản có chứa thân cây chuối (BS). Lên men củ sắn tươi với men, urê và
di-ammonium phosphate (DAP) làm tăng hàm lượng protein thực trong củ sắn từ 2,5
đến 14,2% theo VCK. Có những kết quả tích cực về lượng ăn vào (theo VCK), tăng
khối lượng, giảm hệ số chuyển hóa thức ăn, khi tỷ lệ PECR trong khẩu phần ăn đã tăng
(từ 0 đến 15% theo VCK). Tóm lại việc thay thế ủ chua cây môn bằng PECR đã cải
thiện chất lượng khẩu phần ăn nói chung, dẫn đến lượng ăn vào, tốc độ sinh trưởng cao
hơn; hiệu quả sử dụng thức ăn, hiệu quả kinh tế tốt hơn.
<i><b>Từ khóa: DAP, nấm men, urê, chuyển hóa thức ăn, tăng khối lượng </b></i>
<b>ĐẶT VẤN ĐỀ </b>
Hầu hết lợn ở khu vực nông thôn của CHDCND Lào được nuôi theo truyền
thống, đầu vào thấp, theo phương thức tự do và bán tự do, lợn nhặt ăn tự do quanh năm
hoặc sau khi các vụ mùa chính được thu hoạch (Phengsavanh và cs, 2010). Nguồn thức
ăn chính là phụ phẩm nơng nghiệp, rau và cỏ dại mọc trong rừng, dọc theo bờ suối và
trong các khu vực trồng trọt. Những nguồn thức ăn này dễ bị hỏng do thay đổi thời tiết
theo mùa và trong mùa khơ thì thức ăn ln thiếu. Do đó, một trong những hạn chế
chính đối với chăn ni lợn trong các hệ thống sản xuất nhỏ này là thiếu thức ăn. Ngoài
sự thiếu hụt thức ăn này, các bệnh truyền nhiễm cũng là một vấn đề làm hạn chế sức
sản suất (Conlan và cs, 2008; Phengsavanh và Stur, 2006; Thorne, 2005).
Ở Lào cũng như ở hầu hết các nước nhiệt đới, cây trồng được trồng rộng rãi
nhất là nguồn carbohydrate chủ yếu (ví dụ: gạo, mía, sắn). Một số ít cây trồng là đặc
biệt như là nguồn protein. Do đó, thức ăn giàu protein như bột đậu nành được nhập
khẩu để tạo ra chế độ ăn cân bằng cho vật nuôi, đặc biệt là lợn và gia cầm. Một cách
tiếp cận khác đã được một số tác giả nghiên cứu là lên men trạng thái rắn của các sản
phẩm phụ giàu carbohydrate từ các loại cây trồng này bằng cách sử dụng kết hợp nấm
và nấm men (Phiny và cs, 2012; Phong và cs, 2013; Khempaka và cs, 2011; Hong và
Ca, 2015) để làm giàu hàm lượng protein.
Mục đích của nghiên cứu được báo cáo trong bài báo này là áp dụng kỹ thuật
làm giàu protein để nâng cao hàm lượng protein của củ sắn và đánh giá việc sử dụng
sản phẩm này như là một phần thay thế của khoai môn ủ chua trong khẩu phần ăn cơ
bản có thân cây chuối cho lợn Moo Lath
</div>
<span class='text_page_counter'>(16)</span><div class='page_container' data-page=16>
14
Thí nghiệm được thực hiện trong Phịng thí nghiệm của bộ môn Khoa học Động
vật, Khoa Nông nghiệp và Tài nguyên Rừng, Đại học Souphanouvong. Địa điểm này
nằm cách thành phố Luông Pha Băng, CHDCND Lào 7 km.
<b>Thiết kế thí nghiệm, nghiệm thức và quản lý </b>
<b>Làm giàu protein củ sắn </b>
Củ sắn (60 kg) được gọt vỏ và băm nhỏ bằng tay thành những miếng nhỏ (1-2
cm), và hấp trong 30 phút. Dùng một thùng thép 20 lít để hấp. Cái này có một sàn giả
bằng các dải tre được đỡ bằng những tấm gỗ 30cm cao hơn đế thùng. Không gian bên
dưới dải tre chứa nước được duy trì ở điểm sơi bởi lửa cháy từ gỗ bên dưới thùng.
Củ sắn hấp được lấy ra khỏi thùng và làm nguội trong 15 phút (94,2%) sau đó
<i>trộn với 0,8% urê, 3% di-ammonium phosphate (DAP) và men 2% (S. cerevisiae) theo </i>
VCK (tất cả các thành phần đã được sử dụng cùng loại như thí nghiệm 1 và 2). Khối ủ
sau đó được chuyển vào các rổ tre được phủ bằng lưới nhựa để cho phép khơng khí vào
tự do (ảnh 5). Trong mỗi 3 ngày liên tiếp, khối ủ trong rổ được xới để tất cả các chỗ của
khối ủ được tiếp xúc với khơng khí. Sau bảy ngày, củ sắn giàu protein đã được cho lợn
ăn.
<b>Ủ môn và thân cây chuối </b>
<i>Lá và cuống lá môn (Colocasia esculenta) được thu thập từ các khu vực xung </i>
quanh trường Đại học và được cắt thành từng miếng nhỏ (dài 2-3 cm). Chúng được làm
héo trong 24 giờ để giảm nước và sau đó được ủ trong túi nilon 50 lít khơng có phụ gia
trong 14 ngày. Thân cây chuối được mua từ một ngôi làng gần đó. Chúng được cắt
bằng tay thành từng miếng nhỏ và ủ trong các thùng nhựa PVC 200 lít trong 14 ngày.
<b>Thiết kế thí nghiệm </b>
Thí nghiệm được thiết kế hồn tồn ngẫu nhiên (CRD) với 4 nghiệm thức và 3
lần lặp lại.
Các nghiệm thức riêng lẻ là các tỷ lệ củ sắn giàu protein (PECR) khác nhau
(theo VCK) thay thế cho môn ủ chua (TS) với tỷ lệ khơng đổi của thân chuối (BS):
<b>• PECR0: 60% Môn ủ chua (TS) + 40% thân cây chuối (BS) </b>
<b>• PECR5: 55% Mơn ủ chua (TS) + 40% thân cây chuối (BS) + 5% củ sắn làm giàu </b>
protein (PECR)
<b>• PECR10: 50% TS + 40% BS + 10% PECR </b>
<b>• PECR15: 45% TS +40% BS + 15% PECR </b>
12 con lợn Moo Lath có trọng lượng cơ thể trung bình là 14,8 ± 1,89 kg (8 con
đực; 4 con cái) được mua từ một trang trại lợn ở tỉnh Luông prabang. Lợn đã được tiêm
vắc-xin phòng bệnh dịch tả và điều trị giun tròn bằng ivermectin (1ml / 20kg LW),
trước khi bắt đầu thí nghiệm. Lợn được nhốt trong các ô chuồng riêng lẻ (chiều rộng
1m và chiều dài 1,2m) được làm từ vật liệu địa phương. Lợn được cung cấp nước và
thích nghi với ơ chuồng và thức ăn trong một tuần trước khi bắt đầu thí nghiệm. Thí
nghiệm kéo dài 90 ngày.
</div>
<span class='text_page_counter'>(17)</span><div class='page_container' data-page=17>
15
ngày vào lúc 6:30 sáng và 5:00 chiều, số lượng được cung cấp 40g VCK / kg trọng
lượng sống.
<b>Thu thập số liệu </b>
Lợn được cân vào buổi sáng trước khi cho ăn, cứ sau 15 ngày cân 1 lần kể từ
khi bắt đầu thử nghiệm. Tăng khối lượng được xác định hồi quy tuyến tính vào những
ngày thí nghiệm. Thức ăn cung cấp và từ dư thừa được ghi chép hàng ngày, mẫu thức
ăn được lưu trữ trong tủ lạnh ở 4 ° C trước khi phân tích DM, N và khống.
<b>Phân tích hóa học </b>
Các chỉ tiêu VCK, Nito và chất hữu cơ (OM) của mẫu thức ăn dư được xác định
theo phương pháp AOAC (1990). Protein thực chỉ được phân tích cho mẫu PECR, nó
được xác định bằng cách xử lý trước các mẫu bằng axit Trichlor-acetic (TCA) trước khi
ước tính N.
<b>Phân tích thống kê </b>
Số liệu về thức ăn ăn vào, trọng lượng sống được phân tích bằng Mơ hình tuyến
tính chung (GLM) trong chương trình ANOVA của phần mềm Minitab (2010) (phiên
bản 16.0). Nguồn của các biến thể là các nghiệm thức và sai số.
Mơ hình thống kê đã được sử dụng: Yij = + i + eij
Yij là biến phụ thuộc; µ là giá trị trung bình; i = ảnh hưởng của nghiệm thức
(i=1-4); eij là sai số ngẫu nhiên
<b>KẾT QUẢ VÀ THẢO LUẬN </b>
<b>Thành phần hóa học </b>
Sau khi lên men 7 ngày, giá trị protein thô và protein thực là 16,7 và 14,2%
(tính theo VCK). Mức độ protein thô trong thân chuối rất thấp (bảng1).
<b>Bảng 1. Thành phần hóa học của các thành phần thức ăn (% theo VCK, ngoại trừ </b>
<b>VCK là theo dạng tươi) </b>
<b>VCK </b> <b>N*6.25 </b> <b>OM </b> <b> Protein thực </b>
Môn ủ 26 15.8 81.9 -
Thân cây chuối 7.5 4.6 92.8 -
Củ sắn đã làm giàu protein 26.5 16.70 98.4 14.2
<b>Lượng ăn vào, tốc độ sinh trưởng và hệ chuyển hóa thức ăn </b>
</div>
<span class='text_page_counter'>(18)</span><div class='page_container' data-page=18>
16
<b>Bảng 2. Giá trị trung bình của lượng ăn vào theoVCK (g / ngày) của lợn được cho ăn </b>
môn ủ chua (TS) và thân chuối (BT) bổ sung với củ sắn làm giàu protein (PECR)
<b>PECR0 PECR5 </b> <b>PECR10 </b> <b>PECR15 </b> <b><sub>SEM </sub></b> <i><b><sub>p </sub></b></i>
<b>DM intake, g/day </b>
PECR 0 43 90 127 - -
TS 431 435 388 383 - -
BS 301 332 335 345 - -
Total 732c <sub>810</sub>b <sub>813</sub>b <sub>854</sub>a <sub>4.599 </sub> <sub><0.001 </sub>
g VCK/kg TL sống 39.9b <sub>40.5</sub>b <sub>41.1</sub>ab <sub>42.4</sub>a <sub>0.492 </sub> <sub>0.002 </sub>
<i><b> </b></i><b>abc </b><i>Các giá trị trung bình trong cùng một hàng có chữ cái khác nhau thì có sự </i>
<i>khác nhau có ý nghĩa thống kê p<0,05. </i>
Tăng khối lượng của lợn (Bảng 3) đã tăng 46% theo xu hướng tuyến tính (Hình
2) do củ sắn giàu protein được tăng từ 0 đến 15% khẩu phần. Hệ số chuyển hóa thức ăn
cũng theo xu hướng tương tự khi tỷ lệ củ sắn giàu protein trong khẩu ăn được tăng lên
(Hình 3).
<b>Bảng 3. Sinh trưởng của lợn trong thí nghiệm </b>
<b>Khối lượng sống, </b>
<b>kg </b> <b>PECR0 PECR5 PECR10 PECR15 </b>
<b>SEM </b> <i><b>p </b></i>
KL bắt đầu 14.5 15.3 14.8 14.5 1.35 0.966
KL kết thúc 25.0 27.4 28.1 28.9 1.41 0.302
Tăng trọng hàng
ngày (g/ngày) 125d <sub>150</sub>c <sub>167</sub>b <sub>183</sub>a <sub>2.68 </sub> <sub><0.001 </sub>
Lượng ăn vào,
g/ngày( VCK) 732c <sub>810</sub>b <sub>813</sub>b <sub>854</sub>a <sub>4.60 </sub> <sub><0.001 </sub>
FCR (VCK) 5.9a <sub>5.4</sub>ab <sub>4.9</sub>b <sub>4.7</sub>b <sub>0.218 </sub> <sub>0.017 </sub>
<i><b> </b></i><b>abc </b><i>Các giá trị trung bình trong cùng một hàng có chữ cái khác nhau thì có sự khác </i>
<i>nhau có ý nghĩa thống kê p<0,05. </i>
<b>Hiệu quả kinh tế </b>
</div>
<span class='text_page_counter'>(19)</span><div class='page_container' data-page=19>
17
PECR0, mặc dù sự khác biệt giữa các khẩu phần ăn là nhỏ. Tuy nhiên, do hệ số chuyển
hóa thức ăn của 2 nghiệm thức PECR15 và PECR10 là thấp nhất trong (tương ứng 4,7
và 4,9 kg VCK/ kg thức ăn), chi phí thức ăn/kg tăng trọng của các nghiệm thức
PECR15 và PECR10 là thấp nhất (15,505 và 15,618 kip/kg khối lượng tăng) và cao
nhất ở nghiệm thức PECR0 (tăng 16.426 kip/kg).
<b> Bảng 4. Chi phí cho thức ăn (LAK) </b>
Thức ăn Kip/kg thức ăn Kip/kg VCK
Môn ủ 550 2,115
Thân cây chuối 250 3,333
Củ sắn 1,000 3,774
DAP 15,000 15,000
Urea 15,000 15,000
Nấm men 35,000 35,000
PECR# <sub> - </sub> <sub>4,111 </sub>
<i> LAK = Lao Kip,: 8,569 = 1 USD; </i>
<i> </i>#<i><sub>PECR: Củ sắn làm giàu protein được tính giá bao gồm DAP, urê và nấm </sub></i>
<i>men </i>
<b> </b>
<b> Bảng 5. Hiệu quả kinh tế của nghiệm thức thí nghiệm (LAK) </b>
<b>Chỉ tiêu </b> <b>PECR0 </b> <b>PECR5 </b> <b>PECR10 PECR15 SEM </b> <b>p </b>
Số ngày thí nghiệm 90 90 90 90 - -
Tăng KL, kg 10.5c <sub>12.1</sub>b <sub>13.3</sub>a <sub>14.4</sub>a<sub> 0.255 <0.001 </sub>
Thức ăn ăn
vào/ngày 0.733c <sub>0.81</sub>b <sub>0.813</sub>b <sub>0.854</sub>a<sub> 0.005 <0.001 </sub>
FCR kg VCK/kg 5.9a <sub>5.4</sub>ab <sub>4.9</sub>b <sub>4.7</sub>b<sub> 0.219 </sub> <sub>0.017 </sub>
Chi phí thức ăn/kg 2,614 2,721 2,838 2,904 - -
Chi phí TĂ/kg tăng
KL 16,426 16,391 15,618 15,505 - -
<i> LAK = Lao Kip,: 8,569 = 1 USD; </i>
<b>THẢO LUẬN </b>
</div>
<span class='text_page_counter'>(20)</span><div class='page_container' data-page=20>
18
<i>rằng quá trình lên men bột sắn với S. cerevisiae đã làm tăng mức protein từ 4,4% lên </i>
10,9% theo VCK.
Tăng tốc độ sinh trưởng (46%) bằng cách thay thế môn ủ chua bằng củ sắn giàu
protein là tương đương với (32%) được báo cáo trong một thí nghiệm trước đó
(Manivanh và Preston, 2015). Hệ số chuyển hóa thức ăn theo VCK trong thí nghiệm
hiện tại (4.7) cũng tốt hơn so với hệ số chuyển hóa thức ăn theo VCK của Manivanh và
Preston, (2016) là (5.7). Hang và cs, 2015 đã chỉ ra rằng cải thiện sinh trưởng cho lợn
bằng cách thay thế môn ủ bằng củ sắn được làm giàu protein có thể là một phản ánh về
giá trị năng lượng cao hơn (xơ thô theo VCK trong củ sắn là 3,7% so với 11% xơ thô
trong môn ủ).
Chi phí thức ăn ở khẩu phần ăn PECR15 là thấp nhất chứng tỏ rằng việc thay
<i>thế môn ủ chua (Colocasia esculenta) bằng củ sắn giàu protein là mang lại hiệu quả </i>
kinh tế nhất cho nông dân sản xuất quy mô nhỏ.
<b>KẾT LUẬN </b>
Có tuyến tính tích cực về lượng ăn vào, tăng khối lượng, hệ số chuyển hóa thức
ăn khi dùng củ sắn giàu protein thay thế một phần thức ăn môn ủ chua trong
khẩu ăn cơ bản có thân cây chuối được dùng nuôi lợn Moo Lath.
Việc sử dụng các nguồn thức ăn rẻ tiền, sẵn có tại địa phương, chẳng hạn như
củ sắn có thể cải thiện giá trị dinh dưỡng bằng cách lên men với nấm men, urê
và di-ammonium phosphate (DAP) từ 2,5% đến 14,2%, có khả năng cải thiện
hiệu quả kinh tế chăn ni lợn ở Lào.
<b>CHƯƠNG 4 </b>
<b>TỶ LỆ TIÊU HĨA BIỂU KIẾN VÀ NITO DUY TRÌ Ở LỢN THỊT MOO LATH </b>
<i><b>ĐƯỢC ĂN KHẨU PHẦN ĂN THAY THẾ MÔN Ủ (Colocasia esculenta) BẰNG </b></i>
<i><b>CỦ SẮN (Manihot esculenta Crantz) LÀM GIÀU PROTEIN </b></i>
<b>TÓM TẮT </b>
4 con lợn đực đã thiến (lợn Moo Lath), nặng trung bình 15 kg được bố trí ngẫu
nhiên với 4 khẩu phần trong thiết kế vuông 4 * 4 Latin, để nghiên cứu ảnh hưởng đến
lượng ăn vào, khả năng tiêu hóa và nito duy trì, tỷ lệ của củ sắn giàu protein (PECR) là
0, 25, 50 và 75% kết hợp với môn ủ 80, 55, 30 và 5% với tỷ lện không đổi của thân
chuối là 20% (Tất cả trên theo VCK)
</div>
<span class='text_page_counter'>(21)</span><div class='page_container' data-page=21>
19
củ sắn; và (ii) các kết quả cung cấp bằng chứng xác thực rằng lợn có thể sử dụng một
lượng nhỏ NPN được tái chế vào khối ủ để tổng hợp vi sinh vật thành axit amin.
<i>Từ khóa: thân cây chuối, diammonium phosphate, men vi sinh, lên men trạng thái rắn, </i>
<i>urê,nấm men </i>
<b>ĐẶT VẤN ĐỀ </b>
Rất nhiều thí nghiệm đã được thực hiện gần đây tại Lào (Manivanh và Preston,
2015; Manivanh và Preston, 2016; Manivanh và cs, 2018; Sengxayalth và Preston,
2017a; Vanhnasin và Preston, 2016) với mục đích xác định tiềm năng của quá trình lên
men ở trạng thái rắn như một phương pháp nâng cao giá trị dinh dưỡng của củ sắn và
bột sắn là khẩu ăn cho lợn (lợn Moo Lath ở Lào và lợn Mông Cái ở Việt Nam).
Kết quả của các thí nghiệm này cho thấy việc lên men củ sắn tươi hoặc bột sắn
với sự kết hợp của urê (1-2%), DAP (1-2%) và men (3%) trong khoảng thời gian từ 5
đến 10 ngày thì protein thực tăng 7-8% (theo VCK) chiếm khoảng 60% tổng lượng
protein thơ có nguồn gốc từ urê, DAP và men. Vẫn chưa thể vượt quá tỷ lệ protein thực
này bằng các quy trình như: hấp trước nguồn tinh bột hoặc lên men trong điều kiện yếm
khí, hiếu khí. Bản chất của khoảng 30% nitơ phi protein còn lại chưa được xác định. Số
liệu được trình bày bởi Manivanh và cs, (2018) cho thấy hàm lượng amoniac là tối
thiểu. Các tác giả này đã đưa ra giả thuyết rằng NPN còn lại nó vẫn có thể ở dạng urê,
q trình thủy phân bởi urease có thể bị giảm do sự giảm pH nhanh chóng khi bắt đầu
lên men.
Mặc dù hạn chế rõ ràng là có khoảng 30 - 40% nitơ ở dạng phi protein, đã có
kết quả tích cực khi bột sắn hoặc củ sắn đã làm giàu protein được cho lợn ăn ở mức độ
để cung cấp khoảng 25% protein thay thế protein từ lá môn (Manivanh và Preston,
2015; Vanhnasin và cs, 2016; Sengxayalth và Preston, (2017b). Ở mức vượt quá 25%
protein khẩu phần ăn, tốc độ sinh trưởng bị giảm nhẹ khi PECR thay thế một nguồn
protein cân bằng (ví dụ : lá mơn ủ) nhưng giảm xuống rất ít khi duy trì khẩu ăn bao
gồm 75% PECR và 25% củ sắn ủ- một khẩu phần ăn trong đó protein là từ PECR
(Sengxayalth và Preston, 2017b).
Thí nghiệm sau đây được thiết kế để tạo ra nhiều thông tin hơn về tác động của
việc tăng mức độ PECR trong khẩu ăn thay thế sự kết hợp giữa lá môn và thân cây
chuối trong khẩu phần ăn của lợn Moo Lath.
<b>VẬT LIỆU VÀ PHƯƠNG PHÁP NGHIÊN CỨU </b>
<i><b>Đại điểm: Thí nghiệm được thực hiện tại khu vực thí nghiệm của Đại học </b></i>
Souphanouvong (SU), thuộc tỉnh Lng Pha Băng, CHDCND Lào.
<b>Thiết kế thí nghiệm </b>
Bốn nghiệm thức được so sánh theo cách bố trí ô vuông Latin 4 * 4 với 4 con
lợn và 4 giai đoạn. Các nghiệm thức (theo VCK) là:
</div>
<span class='text_page_counter'>(22)</span><div class='page_container' data-page=22>
20
<b>PECR25: TS 55% + BS 20% + củ sắn làm giàu protein 25% </b>
<b>PECR50: TS 30% + BS 20% + củ sắn làm giàu protein 50% </b>
<b>PECR75: TS 5% + BS 20% + củ sắn làm giàu protein 75% </b>
Thời gian của thí nghiệm là 48 ngày với 4 giai đoạn trong 12 ngày, 7 ngày đầu
tiên để thích nghi sau đó 5 ngày để thu thập số liệu (thức ăn dư, phân và nước tiểu).
<b>Động vật và chuồng ni </b>
Thí nghiệm được sử dụng bốn con lợn địa phương đã thiến (lợn Moo Lath), với
trọng lượng sống trung bình 15 kg được nhốt trong các lồng làm bằng tre, được thiết kế
để tách phân và nước tiểu.
<b>Khẩu phần thí nghiệm </b>
Lá môn (lá và cuống lá) được thu hoạch từ các ao trong khuôn viên trường đại
học. Môn được cắt nhỏ, làm héo trong 8 giờ để giảm nước và sau đó được ủ trong 14
ngày trước khi bắt đầu thí nghiệm.
Làm giàu protein từ củ sắn được xử lý theo phương pháp tương tự như thí
nghiệm 3 (chương 3) và thành phần được phối trộn từ nghiệm thức tốt nhất của thí
nghiệm 1 (chương 2), thành phần là: men (3%), urê (1.4 %) và di-amoni photphat
(DAP) 2%. Đối với urê, nấm men và DAP được sử dụng giống như thí nghiệm 1, 2 và
3. Hỗn hợp này sau đó được cho lên men trong túi nhựa kín trong 7 ngày trước khi cho
lợn ăn.
Thân cây chuối xử lý theo phương pháp tương tự như thí nghiệm 3 (chương 3)
trước khi cho động vật ăn.
Lợn được cho ăn hai lần mỗi ngày (8:00 sáng và 4:00 chiều). Ba thành phần
được trộn với. Thức ăn được cung cấp tối đa dưới sự giám sát cẩn thận lượng ăn vào để
giảm thiểu lượng dư thừa. Nước uống được cung cấp thường xuyên qua núm uống cố
định.
<b>Các chỉ tiêu theo dõi và thu thập số liệu </b>
Lợn được cân vào buổi sáng trước khi bắt đầu mỗi giai đoạn và ngày kết thúc
thí nghiệm của giai đoạn cuối cùng. Thức ăn được cung cấp và dư thừa được ghi chép
hàng ngày. Các mẫu thức ăn được cung cấp và dư thừa được lấy hàng ngày và được
phân loại cho đến cuối mỗi giai đoạn sau chúng được trộn lẫn theo mẫu để phân tích
VCK, khống và Nito. Phân và nước tiểu được thu thập hàng ngày. Mỗi ngày 20 ml
H2SO4 15% được thêm vào hộp đựng nước tiểu để duy trì độ pH của nước tiểu dưới
4.0. Phân được lưu trữ ở 4°C cho đến cuối mỗi giai đoạn sau đó chúng được trộn lẫn để
phân tích VCK, khống và Nito. Mẫu nước tiểu được lấy hàng ngày và được lưu trữ ở 4
° C cho đến khi kết thúc mỗi giai đoạn sau đó các mẫu được trộn để phân tích Nito.
</div>
<span class='text_page_counter'>(23)</span><div class='page_container' data-page=23>
21
<b>Phân tích thống kê </b>
Dữ liệu được phân tích với quy trình mơ hình tuyến tính chung (GLM) cho các
nghiệm thức lặp đi lặp lại trong phần mềm SAS (SAS, 2010), dưới dạng thiết kế ô
vuông Latin. Các chỉ tiêu lặp đi lặp lại là dữ liệu cho 5 ngày liên tiếp thu thập số liệu
trong mỗi giai đoạn.
Mơ hình thống kê là: Yijk = μ + Ti + Cj+ R (k) + time + time (pen) + eijk
Yijk = Biến phụ thuộc; μ = giá trị trung bình; Ti = ảnh hưởng của nghiệm thức
(i=1-4), Cj = ảnh hưởng của giai đoạn (j=1-4); R (k) = ảnh hưởng của ô chuồng; ảnh
hưởng của thời gian (l=1-5); ảnh hưởng của ô chuồng và thời gian, eijk = sai số ngẫu
nhiên(b).
<b>KẾT QUẢ VÀ THẢO LUẬN </b>
<b>Thành phần hóa học </b>
Protein thực trong PECR chiếm 53% protein thô (bảng 1), tương tự như báo cáo của
Manivanh và cs, (2016), Sengxayalth và Preston, (2017a); Vanhnasin và Preston,
<b>(2016). </b>
<b> Bảng 1. Thành phần hóa học của các thành phần thức ăn (% theo VCK, ngoại </b>
trừ VCK là trên cơ sở dạng tươi)
<b>VCK </b> <b>N*6.25 </b> <b>Chất hữu <sub>cơ </sub></b> <b> Protein thực </b>
Môn ủ <b>25.6 </b> <b>15.3 </b> <b>83.4 </b> <b>- </b>
Thân cây chuối 8.2 4.3 93.1 -
PECR 28.4 13.7 98.4 7.3
<b>Thức ăn ăn vào </b>
Lượng VCK hàng ngày theo xu hướng đường cong tuyến tính (y = -56,4x2 +
276x + 366; R² = 0,70) tăng lên tối đa khi tỷ lệ PECR tăng từ 0 đến 25% sau đó giảm
dần với tỷ lệ PECR cao hơn (bảng 2). Là một chức năng của trọng lượng sống, thức ăn
ăn vào cao (33 đến 44 g VCK / kg trọng lượng sống).
<b>Bảng 2. Giá trị trung bình của lượng ăn vào của lợn được cho ăn củ sắn làm giàu </b>
protein (PECR) thay thế thức ăn ủ chua môn với tỷ lệ không đổi của thân cây chuối
<b>PECR0 </b> <b>PECR25 </b> <b>PECR50 </b> <b>PECR75 </b> <b>SEM </b> <i><b>p </b></i>
<i>TĂ ăn vào, g/ngày </i>
PECR 0 180 307 422 6.13
Môn ủ 429 381 177 25 5.29
Thân cây
chuối 140 180 154 137 3.25
Tổng 569c <sub>741</sub>a <sub>639</sub>b <sub>585</sub>c <sub>13.5 </sub> <sub><0.001 </sub>
g/kg KL
</div>
<span class='text_page_counter'>(24)</span><div class='page_container' data-page=24>
22
<i><b> </b></i><b>abc </b><i>Các giá trị trung bình trong cùng một hàng có chữ cái khác nhau thì có sự </i>
<i>khác nhau có ý nghĩa thống kê p<0,05. </i>
<b>Tiêu hóa biểu kiến </b>
Xu hướng của đường cong khả năng tiêu hóa VCK tương tự như đối với lượng
ăn vào (bảng 3; hình 2) và tăng hệ số chuyển hóa thức ăn khi PECR thay thế lá mơn ủ ở
mức 25% sau đó giảm dần với mức độ thay thế bằng PECR. Tuy nhiên, giảm protein là
một xu hướng tiêu cực khi thay thế toàn lá khoai môn ủ bằng PECR. Trong khi chất
hữu cơ cao nhất trong khẩu phần PECR 25% và khác nhau giữa các nghiệm thức (p =
0,003).
<b>Bảng 3. Tỷ lệ tiêu hóa biểu kiến (%) của khẩu phần ăn với PECR thay thế lá môn ủ </b>
với tỷ lệ không đổi của thân cây chuối
<b>PECR0 </b> <b>PECR25 </b> <b>PECR50 </b> <b>PECR75 </b> <b>SEM </b> <i><b>p </b></i>
VCK 64.7a <sub>70.9</sub>a <sub>64.0</sub>ab <sub>56.9</sub>b <sub>2.04 </sub> <sub><0.001 </sub>
Chất hữu cơ 59.7b <sub>68.4</sub>a <sub>62.4</sub>ab <sub>57.0</sub>b <sub>2.157 </sub> <sub>0.003 </sub>
Protein thô 75.0a <sub>74.2</sub>a <sub>71.8</sub>ab <sub>68.0</sub>b <sub>1.63 </sub> <sub>0.002 </sub>
<i><b> </b></i><b>abc </b><i>Các giá trị trung bình trong cùng một hàng có chữ cái khác nhau thì có sự </i>
<i>khác nhau có ý nghĩa thống kê p<0,05. </i>
<b>Cân bằng Nito </b>
Lượng Nito ăn vào và Nito duy trì tăng lên theo xu hướng tuyến tính đạt mức
tối đa ở mức 25% PECR trong khẩu phần ăn và sau đó giảm (bảng 4). Một phần của sự
gia tăng Nito duy trì rõ ràng là do lượng Nito tăng lên; tuy nhiên, việc hiệu chỉnh số
liệu bằng hiệp phương sai cho sự khác biệt về lượng N khơng làm thay đổi mơ hình
tương quan với mức PECR trong khẩu phần ăn. Sự cải thiện khả năng duy trì Nito với
mức độ PECR ngày càng tăng khi thay thế các hỗn hợp môn ủ và thân cây chuối tương
phản với sự giảm tuyến tính về tỷ lệ tiêu hóa Nito (bảng 4).
<b>Bảng 4. Giá trị trung bình của cân bằng Nito ở lợn được cho ăn củ sắn giàu protein </b>
<b>thay thế cho môn ủ chua với tỷ lệ không đổi của thân cây chuối </b>
<b>PECR0 </b> <b>PECR25 </b> <b>PECR50 </b> <b>PECR75 </b> <b>SEM </b> <i><b>p </b></i>
<i><b>Cân bằng nito, g/ngày </b></i>
TĂ ăn vào 8.77c <sub>10.6</sub>a <sub>9.55</sub>b <sub>9.09</sub>bc <sub>0.188 <0.001 </sub>
phân 2.16b <sub>2.74</sub>ab <sub>2.65</sub>ab <sub>2.93</sub>a <sub>0.180 <0.001 </sub>
Nước tiểu 1.77b <sub>1.78</sub>b <sub>2.56</sub>a <sub>2.40</sub>a <sub>0.122 <0.001 </sub>
<i><b>Nito duy trì </b></i>
</div>
<span class='text_page_counter'>(25)</span><div class='page_container' data-page=25>
23
% Nito tiêu hóa 73.6a <sub>77.3</sub>a <sub>63.7</sub>b <sub>60.8</sub>b <sub>1.70 </sub> <sub><0.001 </sub>
% Nito ăn vào 55.1a <sub>57.5</sub>ab <sub>45.6</sub>b <sub>41.3</sub>b <sub>1.45 </sub> <sub><0.001 </sub>
<i>Nito duy trì được điều chỉnh bằng hiệp phương sai cho sự khác biệt về lượng Nito </i>
g/day 4.95b <sub>5.93</sub>a <sub>4.33</sub>bc <sub>3.83</sub>c <sub>0.168 <0.001 </sub>
<i><b> </b></i><b>abc </b><i>Các giá trị trung bình trong cùng một hàng có chữ cái khác nhau thì có sự </i>
<i>khác nhau có ý nghĩa thống kê p<0,05. </i>
<b>THẢO LUẬN </b>
Các tác giả (Vanhnasin và cs, 2016a; Manivanh và cs, 2016; Sengxayalth và
Preston, 2017a) đã chỉ ra rằng khi bột sắn (hoặc củ sắn) được lên men bằng urê, DAP
và nấm men thì khơng phải tất cả NPN được chuyển đổi thành protein thực mà có
khoảng 30% urê và DAP ban đầu vẫn còn là một dạng NPN có thể từ muối amoni đến
peptide và axit amin (AA). Có bằng chứng ở người rằng NPN dưới dạng amoni clorua
đã được chuyển đổi một phần thành axit amin do tác động của vi khuẩn trong ruột non
(Patterson và cs, 1995) và Stein và cs, 1996). Colombiaus và cs, (2014) đã cho urê vào
manh tràng của lợn được cho ăn khẩu phần ăn thiếu axit amin, và cho thấy nó được tái
chế đến ruột non nơi vi khuẩn chuyển thành axit amin với kết quả là Nito duy trì tăng.
Những phát hiện này đã được chứng minh bởi Mansilla và cs, (2015).
Sự tổng hợp axit amin từ NPN trong khẩu phần có thể là lời giải thích cho
những tác động tích cực đến tốc độ sinh trưởng ở mức độ thấp hơn thay thế protein đậu
nành bằng bột sắn làm giàu protein, vì protein được giới hạn 10% theo VCK trong khẩu
phần ăn. Ở mức protein này, các axit amin được bổ sung do sự tổng hợp axit amin từ
NPN từ vi khuẩn có thể đóng một vai trị quan trọng trong việc tăng tốc độ sinh trưởng.
Tuy nhiên, với tỷ lệ thay thế cao hơn 50 và 75% môn ủ bằng củ sắn làm giàu protein,
hàm lượng NPN còn lại (amoniac và urê) có thể đã vượt quá khả năng của các vi khuẩn
đường ruột để tổng hợp nó thành axit amin. Tác dụng độc hại của amoniac là dẫn đến
giảm lượng thức ăn ăn vào do đó làm giảm tốc độ sinh trưởng.
</div>
<span class='text_page_counter'>(26)</span><div class='page_container' data-page=26>
24
Các vấn đề được nêu ra là: (i) lợi ích từ 25% PECR trong khẩu ănlà do sự hiện
diện của nấm men sống (ước tính là khoảng 1% VCK của khẩu phần ăn PECR25) hoạt
động như một chế phẩm sinh học : (ii ) lợn có thể sử dụng một lượng nhỏ nitơ phi
protein thông qua việc hấp thụ NPN từ ruột già và tái chế sau đó trong máu đến ruột
non nơi vi khuẩn sử dụng NPN để tổng hợp axit amin (Colombia và cs, 2014) .
Một kết quả từ thí nghiệm này là việc duy trì Nito chỉ bị giảm nhẹ thậm chí với
75% khẩu phần dưới dạng PECR, trái ngược với báo cáo của Sengxayalth và Preston,
(2017b) khi 75 % khẩu phần ở dạng củ sắn giàu protein, tốc độ sinh trưởng đã giảm gần
như bằng không. Sự khác biệt giữa hai thí nghiệm là bản chất của 25% VCK còn lại.
Trong nghiên cứu của Sengxayalth và Preston, (2017b), đây là ở dạng bột củ sắn được
ủ trong khi trong thí nghiệm hiện tại, nó là sự kết hợp thêm giữa lá khoai môn ủ (5%)
và thân cây chuối (30%). Những thức ăn kết hợp này sẽ giàu vitamin, khoáng chất và
nguyên tố vi lượng hơn nhiều so với chỉ PECR. Điều này không thể được chứng minh
trong trường hợp không có số liệu phân tích sinh hóa có liên quan trong cả hai thí
nghiệm, nhưng đó là một lập luận cho lợi ích của việc có ít nhất một phần protein trong
<b>khẩu ăn được cung cấp bởi các loại lá dinh dưỡng như lá môn. </b>
<b>KẾT LUẬN </b>
Làm giàu hàm lượng protein của củ sắn (củ sắn giàu protein) bằng cách lên men
với urê, diammonium phosphate và nấm men và bao gồm PECR ở mức 25%
trong khẩu phần ăn có củ sắn ủ, lá mơn ủ và thân cây chuối đã tăng lượng ăn
vào, tỷ lệ tiêu hóa,và Nito duy trì cho lợn Moo Lath bản địa.
Các chỉ tiêu này giảm tuyến tính khi tỷ lệ củ sắn giàu protein được tăng lên 50
và 75% trong khẩu phần theo VCK.
Có thể kết luận rằng: (i) lợi ích từ khẩu phần ăn từ củ sắn giàu protein 25% có
thể từ lượng men sống có trong đó và khả năng khác có thể là việc cung cấp
vitamin của khối ủ từ men trong củ sắn đã được lên men và (ii) kết quả hỗ trợ
nghiên cứu trước đó cho thấy lợn có thể sử dụng một lượng nhỏ NPN được tái
chế vào ruột để làm vi sinh vật
<b>KẾT LUẬN CHUNG </b>
Protein thực trong củ sắn tăng theo xu hướng đường cong (R2<sub> = 0,98) từ 2,3 </sub>
đến 6,87% theo VCK khi thời gian lên men tăng từ 0 lên 14 ngày, tỷ lệ protein thực
trong protein thô tăng từ 24,6 lên 63,7 cùng thời gian. Việc tăng tỷ lệ DAP từ 0 đến 2%
theo VCK thì khối ủ đã tăng protein thực từ 5,6 lên 7,3 % sau 14 ngày lên men. 30%
VCK khối ủ đã được lên men trong quá trình chuyển đổi một phần tinh bột thành
protein thực sau 14 ngày lên men. Hấp củ sắn trước khi lên men dường như có tác động
tích cực trong việc chuyển đổi protein thô thành protein thực.
</div>
<span class='text_page_counter'>(27)</span><div class='page_container' data-page=27>
25
yếm khí sau đó là tốc độ giảm chậm để đạt gần như cùng giá trị sau 7 ngày đối với điều
kiện hiếu khí. Việc chuyển đổi khơng hồn tồn Nito urê và Nito amoniac thành protein
nấm men là do q trình thủy phân khơng hồn tồn urê thành amoniac do tác dụng của
urease bị ức chế vì giảm pH trong q trình lên men.
Có tuyến tính tích cực về lượng ăn vào, tăng khối lượng, hệ số chuyển hóa thức
ăn khi dùng củ sắn giàu protein thay thế một phần thức ăn môn ủ chua trong khẩu ăn cơ
bản của thân cây chuối được dùng nuôi lợn Moo Lath. Sử dụng các nguồn thức ăn rẻ
tiền, sẵn có tại địa phương, như lá môn, thân cây chuối và củ sắn, củ sắn có thể cải
thiện giá trị dinh dưỡng bằng cách lên men với nấm men, urê và di-ammonium
phosphate (DAP), có khả năng cải thiện hiệu quả kinh tế chăn nuôi lợn quy mô nhỏ ở
Lào.
</div>
<span class='text_page_counter'>(28)</span><div class='page_container' data-page=28>
26
<b>HUE UNIVERSITY </b>
<b>UNIVERSITY OF AGRICULTURE AND FORESTRY </b>
<b>NOUPHONE MANIVANH </b>
<b>NUTRITIVE IMPROVEMENT OF CASSAVA ROOT AND </b>
<b>ITS UTILISATION IN TARO FOLIAGE AND BANANA </b>
<b>STEMS BASAL DIETS FOR LOCAL PIG PRODUCTION </b>
<b>IN SMALLHOLDERS IN LAO PDR</b>
<b>DOCTOR OF PHILOSOPHY IN ANIMAL SCIENCES </b>
</div>
<span class='text_page_counter'>(29)</span><div class='page_container' data-page=29>
27
<b>HUE UNIVERSITY </b>
<b>UNIVERSITY OF AGRICULTURE AND FORESTRY </b>
<b>NOUPHONE MANIVANH </b>
<b>NUTRITIVE IMPROVEMENT OF CASSAVA ROOT AND </b>
<b>ITS UTILISATION IN TARO FOLIAGE AND BANANA </b>
<b>STEMS BASAL DIETS FOR LOCAL PIG PRODUCTION </b>
<b>IN SMALLHOLDERS IN LAO PDR</b>
<b>SPECIALIZATION: ANIMAL SCIENCES </b>
<b>CODE: 9620105 </b>
<b>DOCTOR OF PHILOSOPHY IN ANIMAL SCIENCES </b>
<b> SUPERVISORS </b>
<b> 1: ASSOCIATE PROFESSOR DR. LE VAN AN </b>
<b> 2: ASSOCIATE PROFESSOR DR. TRAN THI THU HONG </b>
</div>
<span class='text_page_counter'>(30)</span><div class='page_container' data-page=30>
1
1
<b>INTRODUCTION </b>
<b>1. PROBLEM STATEMENT </b>
Pig is one of the most important animals for smallholders in the uplands of Lao
PDR because it can be sold when cash is needed for buying rice and other food, for
paying school fees or if a household member is sick and needs medical attention and
Pork used in traditional ceremonies in households. Pigs can be confined in a small area,
and can covert to meet a variety of crop and kitchen wastes and give a rapid return on
investment (Steinfeld, 1998). About 75% of households in upland areas are raising pig
in the country (FAO, 2017). Overall, native pig around 85.1% under small holder
system (DLF, 2017), they are hardy and able to scavenge at least part of their feed
requirements in free-range condition, Native pigs are mainly raised in extensive
low-input systems that take advantage of naturally occurring feed (Kennard, 1996; FLSP,
2002). In most parts of Laos, agricultural by-products, such as rice bran, and natural
grasses are the main feeds for live stock (ILRI 2002). In Lao villages, where most
farmers are growing paddy rice for sale, the feed for pigs is based on rice bran, which is
fed together with a small amount of green feed. Thus rice bran is available in most farm
households but they cannot support full performance because of their poor nutritive
value. (ILRI, 2002; FLSP, 2002). Since feed accounts for about 50-60% of the variable
costs of production, feed quality is crucial to the success of pig farming operations.
Major problems that may result from low quality feeds are poor appetite, slow growth,
high feed conversion ratio, and low survival. These usually develop as a result of
problems on quality of raw materials, feed formulation, processing technology, storage,
and feed manage. The main problem is the supply of protein as soybean and fish meals
are not available in rural areas and expensive (Phengsavanh and Stür., 2006).
</div>
<span class='text_page_counter'>(31)</span><div class='page_container' data-page=31>
2
2
complete feed for pigs (Boonnop et al., 2009). Sengxayalth and Preston, (2017a)
reported an increase in true protein from 2 to 12% in dry matter (DM) of the cassava
pulp. Agreement with Vanhnasin et al., (2016a) true protein increased from 2 to 7% in
dry matter (DM) of the cassava root. Similar findings were reported by Balagopalan et
al., (1988) who developed a solid state fermentation process for the protein enrichment
of cassava flour and cassava starch factory wastes using the
<i>fungus Trichoderma pseudokonigii rifai. Fermentation with yeast, bacteria has been </i>
studied for reducing non-nutritional components, increasing the nutritive value of
agro-industrial by-products (Okpako et al 2008; Aderemi et al 2007; Tran Thi Thu Hong and
Nguyen Van Ca 2013). Additional phosphate results in increased biomass growth of
yeast and bacteria (Papagianni et al 1999). Huu and Khammeng, (2014) reported that
when replacing maize with fermented cassava pulp containing 13% crude protein (DM
basis), digestibility and N retention were similar to the control diet. Protein enriched of
cassava root (PECR) could provide in pig diets up to 25 to 28% of the dietary protein in
a diet based on cassava pulp (or ensiled root), replacing ensiled taro foliage (Vanhnsin
and Preston, 2016b) or soybean meal (Sengxayalth and Preston, 2017b). It similar to
the growth response in pigs reported by Phuong et al., (2013) for cassava pulp enriched
<i>from 3 to 5.5% true protein using the fungus Aspergillus niger. </i>
The local feed used in smallholder systems for pigs include rice by-products,
planted feeds and various green plant materials (ILRI 2002). However, the local feed
contain low nutritive value. Women typically are the key persons in this effort, and,
with traditional practices, they spend 2 to 3 hours each day collecting and preparing
feed for pigs (Australian Center for International Agricultural Research 2010). Farmers
have little knowledge on optimizing use existing feed resources, the growth rate of the
pig only 100 to 120 g/day if depend on local feed staffs. In commercial complete feeds,
the most common protein sources are fish meal and soybean meal. These feedstuffs
provide high quality protein for pigs, but they are imported and are expensive. Due to
their high price, such protein sources cannot be used by smallholder farmers
(Phengsavanh et al., 2010). So, improving nutritive value of local feed that is
abundance in their area especially the application of microorganism fermentation it is
possible to improve the nutritive value of local feed and its utilization as diets for local
pigs in Laos, which helps in reducing feed cost and bringing economic benefits to the
farmers in rural area.
<b>2. OBJECTIVES </b>
The overall aim of this thesis was to improve nutritive value of cassava roots by
<i>fermentation yeast (Saccharomyces cerevisiae), Urea and di-ammonium phosphate </i>
additive and its utilization as protein source in the diets of Moo Lath pigs. Specific
objectives were to:
<i> To study nutritive value of casssava root by fermentation yeast (Saccharomyces </i>
</div>
<span class='text_page_counter'>(32)</span><div class='page_container' data-page=32>
3
3
To study the limiting factor to the synthesis of true protein from crude protein
in the fermentation of cassava root
To evaluate the use of protein-enriched cassava root as partial replacement of
taro silage in a ensiled banana stem - based diet fed to Moo Lath pigs
<b>CHAPTER 1: </b>
<b>LITERATURE REVIEW </b>
There are main points following (i) Pig production in Laos; (ii) requirement of
protein and amino acid for growing pigs (iii) feed stuffs for pig in Laos; (iv) method to
improve value for feed stuff with low protein content; and (v) utilization of forage
based diet for pigs.
<b>CHAPTER 2 </b>
<b>IMPROVING NUTRITIVE VALUE OF CASSAVA ROOTS </b>
<i><b>(Manihot esculenta Crantz) </b></i>
<b>INTRODUCTION </b>
The major problems of small-holder pig production in upland areas of Lao PDR
are high piglet mortality and low growth rates. Almost all pigs are of local breed (Mou
Lath), managed in scavenging systems and suffer feed inadequacy in both quality and
quantity. According to the survey by Phonepaseuth et al., (2010) most piglets in upland
areas had a low growth rate (20-50 g/day) and high mortality (30-50%). Weaned pigs
required from 5 to 8 months to reach live weights of 20 to 30 kg.
The cassava root is composed of carbohydrates and is therefore mainly a source
of energy. The starch content varies between 32 to 35% of the mass of fresh root and 80
and 90% of the mass of dried roots (Montagnac et al., 2009). The protein content is
trivial, between 1 and 3% of dry matter (Buitrago, 1990).
One way to improve the protein content of carbohydrate-rich feeds is by
solid-state fermentation with fungi and yeasts (Araujo et al., 2008; Hong and Ca, 2013). The
<i>fermentation of cassava meal with S. cerevisiae enhanced the protein level from 4.4% </i>
to 10.9% in DM and decreased the cyanide content (Oboh and Kindahunsi, 2005).
Solid state fermentation of the root with urea and di-ammonium phosphate (DAP) is a
promising technology as this has the potential to raise the protein content to levels
required to balance the carbohydrate, thus presenting the opportunity to make an almost
complete feed for monogastric animals such as pigs and poultry (Boonnop et al., 2009).
</div>
<span class='text_page_counter'>(33)</span><div class='page_container' data-page=33>
4
4
urease. However, the activity of urease is inhibited at low pH (Kay and Reid, 1934),
which falls rapidly when the cassava root is fermented.
<b>EXPERIMENT 1: </b>
<b>MATERIALS AND METHODS </b>
<i><b>Location </b></i>
The experiment was carried out in the Laboratory of the Animal Science
Department in the Faculty of Agriculture and Forest Resource in Souphanouvong
University. The site is located 7 km from Luang Prabang City, Lao PDR. The mean
daily temperature in this area at the time of the experiment was 27o<sub>C (range 22-32°C). </sub>
<b>Experimental design </b>
The experiment was arranged as a 2*3*4 factorial in a completely randomized
design (CRD) with 4 replications in each period.
The treatments were:
<b>Root processing </b>
<i>Steamed (ST) and not steamed (NST) </i>
<b>Di-ammonium phosphate DAP: </b>
0, 1 or 2% of root DM
Procedure:
<b>Time (days) </b>
Day 0, 3, 7 and 14
<i><b>Steaming </b></i>
Cassava roots were peeled and chopped by hand into small pieces (1-2 cm). One
portion was steamed for 30 minutes in a bamboo basket placed above a pan containing
boiling water. The composition of the substrates were increased the level of of DAP zero to
2% and balance N in each treatment by urea with constant of Yeast as 3% for testing the
nutritive value of cassava root after fermentation. The steamed cassava root was removed from
the bamboo basket allowed to cool for 15 minutes. The steamed and un-steamed cassava root
<i>were then mixed with urea, yeast (Saccharomyces cerevisiae) and DAP (table 1). The </i>
proportions of urea were varied according to the level of DAP so that the substrates were
iso-nitrogenous. The mixed substrates were then transferred to bamboo baskets covered with
plastic netting to allow free entrance of air (photo 2) and allowed to ferment for 14 days.
<b>Table 1. Composition of the substrates (DM basis) </b>
<b>Treatment</b> <b>Cassava root, </b>
<b>%</b> <b>Yeast, %</b> <b>DAP#, %</b> <b>Urea, %</b>
</div>
<span class='text_page_counter'>(34)</span><div class='page_container' data-page=34>
5
5
DAP-1 94.3 3 1 1.7
DAP-2 93.6 3 2 1.4
<i> #Phosphorus 20%</i>
<i>The species of yeast is saccharomyces cerevisiae was used in the experiment. S. </i>
<i>cerevisiae cells are round to ovoid, 5-10 μm in diameter. It reproduces by a division </i>
process known as budding (Feldmann and Horst, 2010). Di-ammonium phosphate
<i>(DAP) contains 16% N and 20% phosphorus (P); Urea has 46% N (DM basis); yeast (S. </i>
<i>cerevisiae) contains 48.6% CP in DM. </i>
<b>Measurements </b>
On days 0, 3, 7 and 14 samples were taken from the treatment. There are four
replicates in each period of the treatments (the sample did not repeated measurements
in each period) and the sample were analyzed for DM, N, OM and true protein. The
fresh weight of the substrates in each treatment were weighed at each time interval to
determine the relative amounts of substrate DM utilized in the fermentation process.
<b>Chemical analysis </b>
DM, N and ash were analyzed according to AOAC, (1990) methods. For
estimation of true protein, 2 g of the fresh sample were put in a 125ml Erlenmeyer flask
with 50 ml of distilled water, allowed to stand for 30 minute, after which 10ml of 10%
TCA (trichloracetic acid ) were added and allowed to stand for a further 20-30 minutes.
The suspension was then filtered through Whatman #4 paper by gravity. The filtrate
was discarded and the remaining filter paper and suspended substrate transferred to a
kjeldahl flask for standard estimation of total N. The measurements of crude and true
protein were done on the fresh sample.
<b>Statistical analysis </b>
The data were analyzed by the General Linear Model (GLM) option in the
ANOVA program of the Minitab, (2010) software (version 16.0). In the model the
sources of variation were treatments, treatment interaction and random error. Turkey’s
pair-wise comparison was used to determine the differences. The statistical models
used were:
Yijk = µ +ci +dj + tk + (c*d*t)ijk + eijk
Yijk are dependent variables; µ is overall mean; ci is effect of cassava root processing
dj is effect level of DAP; tk is effect of time; (c*d*t)ijk is the interaction between the
three factors; eijk is random error.
<b>RESULT AND DISCUSSION </b>
</div>
<span class='text_page_counter'>(35)</span><div class='page_container' data-page=35>
6
6
the proportion of DAP from zero to 2% of the substrate DM increased the average level
of true protein from 4.16 to 5.85% in DM (table 2). The level of true protein in the
substrate increased with a curvilinear trend (R2<sub> = 0.98) from 2.3 to 6.9% in DM as the </sub>
fermentation time increased from zero to 14 days; the crude protein was 10.5 in DM
after mixing the substrate and did not change at the end of the fermentation time. The
ratio of true protein to crude protein increased from 24.6 to 63.7 over the same period
(table 2; figures 1 and 2). However, according to (Vanhnasin and Preston, 2016b)
showed the DM, CP and TP of cassava root fermented (14 days) without ingreedients
were lower such as: (DM 29.5%, CP 3%, TP 1.5% but the value of Ash was hight
(97%).
<b> Table 2. Mean values for DM, OM, crude protein; true protein and ratio of TP/CP at </b>
different stages of the fermentations (% in DM)
<b>DM </b> <b>OM </b> <b>CP </b> <b>TP </b> <b>TP/CP </b>
<b>Steaming (ST) </b>
ST 28.45 87.25 10.40 5.15 47.10
NST 30.34 87.58 10.37 4.90 48.09
SEM 0.344 0.929 0.068 0.039 1.540
<i>p </i> 0.008 0.812 0.806 0.004 0.665
<b>DAP, % in DM </b>
0 29.89 87.14 10.13b <sub>4.16</sub>c <sub>36.77</sub>b
1 29.52 87.78 10.53a <sub>5.08</sub>b <sub>50.05</sub>a
2 28.78 87.32 10.50a <sub>5.85</sub>a <sub>55.70</sub>a
SEM 0.422 1.138 0.084 0.047 1.887
<i>p </i> 0.247 0.921 0.025 <0.001 0.001
<b>Times (Days) </b>
0 29.6b <sub>87.41 </sub> <sub>10.47 </sub> <sub>2.30</sub>d <sub>24.59</sub>c
3 24.69c <sub>85.71 </sub> <sub>10.46 </sub> <sub>4.43</sub>c <sub>42.31</sub>b
7 29.34b <sub>86.44 </sub> <sub>10.47 </sub> <sub>6.52</sub>b <sub>59.76</sub>a
14 33.97a <sub>90.09 </sub> <sub>10.14 </sub> <sub>6.87</sub>a <sub>63.72</sub>a
SEM 0.487 1.314 0.097 0.055 2.179
<i>p </i> <0.001 0.199 0.121 <0.001 <0.001
<i> </i>abc <i>Mean values in rows without common superscript differ at p<0.05 </i>
<i> DAP: di-ammonium phosphate; DM: dry matter, OM: Organic matter, CP: crude protein, </i>
<i>TP: true protein, ST: steam and NST: not steam </i>
The final values after 14 days of fermentation being increased from 5.63 to 8.33%.
The ratio of true protein to crude protein increased from 46.56 to 81.35 after 14 days of
fermentation (table 3).
<b> Table 3. Effect of level of DAP on concentration of crude protein, true protein and ratio of </b>
TP/CP after 14 days of fermentation (% in DM)
</div>
<span class='text_page_counter'>(36)</span><div class='page_container' data-page=36>
7
7
0 1 2 SEM <i>P </i>
CP 9.65 10.51 10.25 0.168 0.279
TP 5.63c <sub>6.65</sub>b <sub>8.33</sub>a <sub>0.095 </sub> <sub><0.001 </sub>
TP/CP 46.56b <sub>63.25</sub>ab <sub>81.35</sub>a <sub>3.773 </sub> <sub>0.049 </sub>
<i> </i>abc <i>Mean values in rows without common superscript differ at p<0.05 </i>
<i>DAP: di-ammonium phosphate; DM: dry matter, CP: crude protein, TP: true protein </i>
<b>Changes in the mass of substrate during fermentation </b>
About 30% of the original DM in the substrate had been fermented by the end
of 14 days, the rate of loss showing a curvilinear trend with time, with the major change
taking place in the first 3 days (table 4).
<b> Table 4. Changes in the mass of fresh (FM) and dry (DM) substrate during the </b>
fermentation
<b>Days </b> <b>FM, kg </b> <b>%DM </b> <b>DM, kg </b>
0 1.00a <sub>29.6</sub>b <sub>0.29</sub>a
3 0.94a <sub>24.7</sub>c <sub>0.23</sub>b
7 0.79b <sub>29.3</sub>b <sub>0.23</sub>bc
14 0.62c <sub>33.9</sub>a <sub>0.21</sub>c
SEM 0.013 0.708 0.006
<i>p </i> <0.001 <0.001 <0.001
<i> </i>abc <i>Mean values in rows without common superscript differ at p<0.05 </i>
The crude protein and Organic matter g/kg of DM after mixing the substrate did
not change at the end of the fermentation time (Days 0 to 14). The ratio of true protein
was increased from 22.98 to 69.51 from zero to 14 days and there were diference
among time of fermentation (table 5).
<b>Table 5. Chemical composition (g/kg of DM) </b>
Days OM CP TP
0 874.09 104.71 22.98a
3 857.10 104.60 44.32b
7 864.43 104.74 65.15c
14 900.86 101.36 69.51d
SEM 13.137 0.967 0.568
<i>P </i> 0.199 0.121 <0.001
</div>
<span class='text_page_counter'>(37)</span><div class='page_container' data-page=37>
8
8
<b>EXPERIMENT 2. </b>
<b>MATERIALS AND METHODS </b>
<i><b>Location: The experiment was carried out in the Laboratory of the Animal Science </b></i>
Department in the Faculty of Agriculture and Forest Resource in Souphanouvong
<i><b>University. The site is located 7 km from Luang Prabang City, Lao PDR. </b></i>
<b>Experimental design </b>
The treatment was repeated steaming of cassava root with 2% of di-ammonium
phosphate (DAP) the same as for experiment 1
The experimental design was a 2*9 factorial arrangement in a completely
randomized design (CRD) with 2 treatments combination and with 4 replications of
each period. The treatment mixtures (DM basis) of 93.6% cassava root, 3% yeast, 1.4%
urea and 2% di-ammonium phosphate (DAP) were under aerobic and anaerobic
conditions, fermented for 9 periods (0, 3h, 1, 2, 3, 4, 5, 6 and 7 days).
<i><b>Procedure </b></i>
Cassava roots were peeled and chopped into small pieces (1-2 cm) and steamed
for 30 minutes in a bamboo basket placed above a pan containing boiling water. It was
<i>then cooled for 15 minutes prior to being mixed with the yeast (S. cerevisiae), urea and </i>
DAP (all these ingredients were use the same kind as experiment 1. One half of the
mixed substrate was transferred to bamboo baskets covered with plastic netting to allow
free entrance of air and allowed to ferment for 7 days (aerobic condition). The other
portion of the substrate was packed tightly into 0.5 liter plastic bags, which were closed
(anaerobic condition), and in which it was stored for 7 days.
<b>Measurements </b>
Samples were taken from each treatment/replicate on day 0 (3 h after mixing the
components of the substrate), and then every 24h until end of day 7 of the fermentation
for measurement of pH, crude protein, true protein and ammonia.
<b>Chemical analysis </b>
</div>
<span class='text_page_counter'>(38)</span><div class='page_container' data-page=38>
9
9
of true protein-N and ammonia-N from the crude protein-N. The measurements of
crude and true protein and ammonia were done on the fresh samples.
<b>Statistical analysis </b>
The data were analyzed by the General Linear Model (GLM) option in the
ANOVA program of the Minitab, (2010) software (version 16.0). In the model the
sources of variation were treatments, treatment interaction and random error. Turkey’s
pair-wise comparisons was used to determine the differences system condition; time
when the P value of F test P<0.05. The statistical models used were:
Yij = µ +ai +tj + (a*t)ij + e<i>ij </i>
Yij are dependent variables; µ is overall mean; ai is effect of system condition
(aerobic and anaerobic); tj is effect of time; (a*t)ij is the interaction between the two
factors; eij is random error.
<b>RESULT AND DISCUSSION </b>
<b>Chemical composition of substrates </b>
The pH decreased with fermentation time, according to an almost linear trend,
from 5.8 immediately after mixing the substrate, to 5.47in 3h and to 3.43 after 7 days
(table 1). The level of crude protein after mixing the substrate and additives was
10.35% in DM and, as expected, did not change over the 7 days of fermentation. The
level of true protein in the substrate increased from 2.37 to 6.97% in DM as the
fermentation time increased from zero to 7 days, such that the ratio of true to crude
protein increased from 22.95 to 66.11 over the same period (table 1). There were no
differences in all these criteria as between the aerobic and anaerobic condition, other
than a tendency for the pH to fall slightly more quickly in the first 4 days in the
anaerobic condition followed by a slower rate of fall to reach almost the same final
value after 7 days, as for the aerobic condition.
<b>Table 1. Changes in pH, crude protein (CP), true protein (TP) and ammonia in cassava root </b>
fermented with yeast, urea and DAP under aerobic or anaerobic conditions
<b> </b> <b>pH </b> <b>Ammonia </b> <b>CP </b> <b>TP </b> <b>TP/CP </b>
<i><b>Condition </b></i>
<i><b>system </b></i>
Anaerobic 4.27 0.40 10.40 4.86 46.66
Aerobic 4.66 0.42 10.41 4.87 46.72
SEM 0.013 0.001 0.045 0.022 0.070
<i>p </i> <0.001 <0.001 0.792 0.773 0.537
<i><b>Time (days) </b></i>
0 5.83a <sub>0.49</sub>a <sub>10.35 </sub> <sub>2.37</sub>i <sub>22.95</sub>i
3h 5.47b <sub>0.48</sub>ab <sub>10.26 </sub> <sub>3.21</sub>h <sub>31.30</sub>h
1 4.87c <sub>0.46</sub>b <sub>10.55 </sub> <sub>3.74</sub>g <sub>35.46</sub>g
2 4.64d <sub>0.45</sub>c <sub>10.47 </sub> <sub>4.23</sub>f <sub>40.40</sub>f
</div>
<span class='text_page_counter'>(39)</span><div class='page_container' data-page=39>
10
10
4 4.11f <sub>0.39</sub>e <sub>10.55 </sub> <sub>5.54</sub>d <sub>52.49</sub>d
5 3.90g <sub>0.36</sub>f <sub>10.35 </sub> <sub>6.14</sub>c <sub>59.36</sub>c
6 3.63h <sub>0.34</sub>g <sub>10.29 </sub> <sub>6.46</sub>b <sub>62.75</sub>b
7 3.43i <sub>0.30</sub>h <sub>10.55 </sub> <sub>6.97</sub>a <sub>66.11</sub>a
SEM 0.027 0.003 0.096 0.046 0.148
<i>p </i> <0.001 <0.001 0.144 <0.001 <0.001
abc
<i>Mean values in rows without common superscript differ at p<0.05 </i>
<i>pH: Power of/potential Hydrogen; CP: crude protein, TP: true protein; p: probability; SEM: </i>
<i>standard error of the mean; CP and TP (% in DM) </i>
The proportion of true protein in the substrate after the 7-day fermentation was
doubled from 34 to 62% of the total nitrogen, and appeared to be derived almost
equally from the nitrogen present originally as ammonia (from DAP) and from urea
(figure 3). However, urea was not determined directly but was assumed to be the source
of the N remaining after accounting for the protein-N and ammonia-N at the end of the
fermentation. Two questions to be answered are: i) Why all the ammonia was not used
for yeast growth?; and ii) why was the urea not completely hydrolyzed to ammonia?
The latter question could perhaps be explained as being the consequence of the rapid
fall in the substrate pH inhibiting the action of urease, the action of which is decreased
at low pH (Kay and Reid, 1934).
<b>Figure 3. Distribution of the nitrogen as urea, ammonia and true protein at the </b>
beginning and after 7 days of fermentation
<b>DISCUSSION </b>
The increase in the true protein content of the cassava root by fermentation with
yeast, urea and DAP is supported by reports from several researchers. Fermentation of
<i>cassava peels by a pure culture of S. cerevisiae increased the protein content from 2.4% </i>
to 14.1%, according to Antai and Mbongo, (1994). Oboh and Kindahunsi, (2005)
y = 2.273x0.4969
R² = 0.99
0,00
2,00
4,00
6,00
8,00
10,00
12,00
0 3h 1 2 3 4 5 6 7
N*6.2
5,
% i
n
DM
Fermentation, days
</div>
<span class='text_page_counter'>(40)</span><div class='page_container' data-page=40>
11
11
<i>reported that the fermentation of cassava flour with S. cerevisiae increased the protein </i>
level from 4.4% to 10.9% in DM. Krisada et al., (2009) carried out a similar
fermentation with fresh cassava root using urea and yeast. The crude protein was
increased from 3.2 to 21.1% in DM with 90% of the crude protein in the form of true
protein. Phiny et al., (2012) fermented broken rice in an anaerobic system simulating
the “farmer” production of rice wine. The difference in procedure was the addition of
urea (1% of the rice) as well as yeast and no distillation. The crude protein content was
raised from 7% in DM in the broken rice to 23% in DM after fermentation for 3 days.
The proportion of “crude” to “true” protein was not measured but the 37% increase in
pig growth rate when the protein-enriched rice was included in the diet, compared with
16.5% improvement in growth rate, for supplementation with fish meal, indicated that
much of the increase in “crude” protein was as “true” protein. Manivanh and Preston,
(2016) used cassava root as the carbohydrate source, with incorporation of DAP as a
source of phosphorus to supplement the yeast and urea. True protein content of the
cassava root was raised to 14% in DM (from 2.5% in unfermented root) and growth
rate of Moo Lath pigs was increased by 46% compared with the control diet in which
the protein was from ensiled Taro foliage (leaves and petioles).
Phosphorus is required for the growth of all biological entities, including
yeast, thus the 30% increase in true protein in the fermented cassava pulp by raising
the level of DAP (20% phosphorus) from zero to 2% (in DM) was to be expected.
There appear to be no comparable studies on effects of phosphorus levels in
protein-enrichment of carbohydrate with yeast and urea.
There is not all the added nitrogenous compounds (urea and DAP) were
converted to “true” protein, the levels of which never exceeded some 50 to 70% of the
“crude “ protein in experiments with yeast-fermented cassava root (Vanhnasin and
Preston, 2016a) and cassava root pulp (Sengxayalth et al., 2017a). In an attempt to
solve this problem, from experiment 1 increased the level of DAP to 2% of the
substrate, reducing the level of urea to 1.2%. This had the effect of increasing the
phosphorus level in the substrate with a related increase in the proportion of the added
N as ammonia, replacing urea-N. The linear increase in the proportion of true to crude
protein that resulted was attributed to the increased level of phosphorus, but another
explanation could have been the partial change in the origin of the added NPN - from
urea to ammonia. Yeast cannot directly use urea which must first be hydrolysed to
ammonia by urease. However, the activity of urease is inhibited at low pH (Kay and
Reid, 1934), which falls rapidly when the cassava root is fermented.
<b>CONCLUSIONS </b>
The true protein in cassava root increased with a curvilinear trend (R2<sub> = 0.98) from </sub>
2.3 to 6.87% in DM as the fermentation time increased from zero to 14 days, the proportion
of true protein in crude protein increasing from 24.6 to 63.7 over the same period.
</div>
<span class='text_page_counter'>(41)</span><div class='page_container' data-page=41>
12
12
30% of the original root DM was fermented in the partial conversion of root
carbohydrate to true protein after 14 days of fermentation.
Steaming the cassava root prior to fermentation appeared to have a slightly
positive effect on conversion of crude to true protein.
The pH decreased with fermentation time, according to an almost linear trend,
from 5.8 immediately after mixing the substrate, to 5.4 in 3h and to 3.43 after 7 days.
The level of crude protein after mixing the substrate and additives was 10.35%
in DM and did not change over the 7 days of fermentation.
There were no differences between the aerobic and anaerobic condition, other
than a tendency for the pH to fall slightly more quickly in the first 4 days in the
anaerobic condition followed by a slower rate of fall to reach almost the same final
value after 7 days, as for the aerobic condition.
It is suggested that the incomplete conversion of urea-N and ammonia-N to
yeast protein is because of incomplete hydrolysis of urea to ammonia due to action of
urease being inhibited by the fall in pH during the fermentation.
<b>CHAPTER 3 </b>
<i><b>REPLACING TARO (Colocasia esculenta) SILAGE BY PROTEIN-ENRICHED </b></i>
<b>CASSAVA ROOT IMPROVED THE NUTRITIVE VALUE OF A BANANA </b>
<i><b>STEM (Musa sapientum Linn) BASED DIET AND SUPPORTED BETTER </b></i>
<b>GROWTH IN MOO LATH PIG </b>
<b>ABSTRACT </b>
A growth trial was conducted with 12 Moo Lath pigs with average 14.8 ±1.89
kg initial live weight in a CRD, with three replications of four treatments. The aim of
the study was to determine the effect of replacing TS with PECR in a basal diet of
ensiled banana stem (BS). Fermentation of fresh cassava root with yeast, urea and
di-ammonium phosphate (DAP) increased the content of true protein in the root from 2.5
to 14.2% in DM. There were positive responses in dry matter (DM) intake, live weight
gain, feed conversion ratio, as the percentage of PECR in the diet was increased (zero
to 15% in DM ). It was concluded that the replacing of taro foliage silage with PECR
improved the quality of the overall diet, which resulted in higher intake, growth rate,
better feed conversion ratio and economical efficiency.
<i><b>Key words: DAP, yeast, urea, feed conversion, live weight gain </b></i>
<b>INTRODUCTION </b>
</div>
<span class='text_page_counter'>(42)</span><div class='page_container' data-page=42>
13
13
smallholder production systems is a shortage of feed. Apart from this feed shortage,
infectious diseases are also a problem that limit productivity (Conlan et al., 2008;
Phengsavanh and Stur, 2006; Thorne, 2005).
In Lao PDR as in most tropical countries the most widely grown crops are
primarily sources of carbohydrate (eg: rice, sugar cane, cassava). Few crops are grown
specifically as sources of protein. As a result, protein rich feeds such as soybean meal
are imported in order to produce balanced diets for livestock especially pigs and
poultry. An alternative approach that has been studied by several researchers is the
solid state fermentation of carbohydrate-rich byproducts from these crops using
combinations of fungi and yeast (Phiny et al., 2012; Phong et al., 2013; Khempaka et
al., 2011; Hong and Ca, 2015) in order to enrich the content of protein.
The aim of the research reported in this paper was to apply the
protein-enrichment technique to raise the protein content of cassava roots and to evaluate the
use of this product as partial replacement of taro silage in a banana stem- based diet fed
to Moo Lath pigs
<b>MATERIALS AND METHODS </b>
<i><b>Location </b></i>
The experiment was carried out at the Faculty of Agriculture and Forest
Resource in Souphanouvong University. The site is located 7 km from Luang Prabang
City, Lao PDR.
<b>Experimental design, treatments and management </b>
<b>Protein-enrichment of cassava root </b>
Cassava roots (60 kg) were peeled and chopped by hand into small pieces (1-2
cm), and steamed for 30 minutes. For the steaming a 200 liter steel barrel was used.
This had a false floor of bamboo strips supported by wooden boards 30cm above the
base of the barrel. The space beneath the bamboo strips contained water which was
maintained at boiling point by a wood fire underneath the barrel.
The steamed cassava root was removed from the barrel and cooled for 15
minutes (94.2%) then mixed with urea 0.8%, di-ammonium phosphate (DAP) 3% and
<i>yeast (S. cerevisiae) 2% respectively, of the cassava DM (all ingredients were used the </i>
same kind as experiment 1 and 2). The mixed substrate was then transferred to bamboo
baskets covered with plastic netting to allow free entrance of air (photo 5). On each of 3
consecutive days the contents of the basket were turned so that all the contents were
exposed to the air entering through the top and the sides of the basket. After seven days,
the protein-enriched cassava root was fed to the pigs.
<b>Ensiling taro foliage and banana stems </b>
</div>
<span class='text_page_counter'>(43)</span><div class='page_container' data-page=43>
14
14
<b>Experimental design </b>
The experiment was arranged in a completely randomized design (CRD) with 4
treatments and 3 replications.
Individual treatments were different proportions (DM basis) of protein-enriched
cassava root (PECR) replacing taro silage (TS) with constant proportions of ensiled
banana stem (BS):
<b>• PECR0: Taro silage (TS) 60% + ensiled banana stem (BS) 40% </b>
<b>• PECR5: TS 55% + BS 40% + Protein-enriched cassava root (PECR) 5% </b>
<b>• PECR10: TS 50% + BS 40% + PECR 10% </b>
<b>• PECR15: TS 45% + BS 40% + PECR 15% </b>
Twelve Moo Lath pigs with a mean body weight of 14.8 ±1.89 kg (8 males; 4
females) were bought from a pig farm in Luang prabang Province. They were
vaccinated against swine fever and treated against round worms with ivermectin
(1ml/20kg LW), before starting the experiment. The pigs were housed in individual
pens (width 1m and length 1.2m) made from local materials. The pigs had free access
to water and were adapted to the pens and the feeds for one week before starting the
experiment which lasted 90 days.
The diet ingredients were mixed together and given two times per day at 6:30
am and 5:00 pm, the amount being based on an offer level of 40g DM/kg live weight.
<b>Data collection </b>
The pigs were weighed in the morning before feeding, at the beginning of the
trial and every 15 days. Live weight gain was determined from the linear regression of
live weight on days in the experiment. Samples of feed offered and refused were
collected daily, weighed and sub-samples stored in the refrigerator at 4°C before being
bulked for analysis of DM, N and ash.
<b>Chemical analysis </b>
AOAC (1990) methods were used to analyses the sub-samples of feeds offered
and refused for DM, N and OM. True protein was analyses only PECR, it was
determined by prior treatment of the samples with Trichlor-acetic acid (TCA) before
estimation of N.
<b>Statistical analysis </b>
Data for feed intake, live weight were analysed by the General Linear Model
(GLM) option in the ANOVA program of the Minitab (2010) software (version 16.0).
Sources of variation were treatments and error.
</div>
<span class='text_page_counter'>(44)</span><div class='page_container' data-page=44>
15
15
Yij are dependent variables; µ is overall mean; i = treatment effect (i=1-4); eij
is random error
<b>RESULTS AND DISCUSSION </b>
<b>Chemical composition </b>
After fermentation seven days, the crude and true protein values were 16.7 and
14.2% (in DM). The level of crude protein in the ensiled banana stems was very low
(table1).
<b>Table 1. The chemical composition of feed ingredients (% in DM, except </b>
<b>DM which is on fresh basis) </b>
<b>DM </b> <b>N*6.25 </b> <b>OM </b> <b>True protein </b>
Taro silage 26 15.8 81.9 -
Ensiled banana stem 7.5 4.6 92.8 -
PECR 26.5 16.70 98.4 14.2
<b>Feed intake, growth rate and feed conversion </b>
DM intake was increased linearly with the increase in the level of
protein-enriched cassava root (Table 2).
<b>Table 2. Mean values for DM intake (g/day) by pigs fed taro silage (TS) and ensiled </b>
banana stem (BT) supplemented with protein enriched cassava root (PECR)
<b>PECR0 </b> <b>PECR5 PECR10 PECR15 </b>
<b>SEM </b> <i><b>p </b></i>
<b>DM intake, g/day </b>
PECR 0 43 90 127 - -
TS 431 435 388 383 - -
BS 301 332 335 345 - -
Total 732c <sub>810</sub>b <sub>813</sub>b <sub>854</sub>a <sub>4.599 </sub> <sub><0.001 </sub>
g DM/kg LW 39.9b <sub>40.5</sub>b <sub>41.1</sub>ab <sub>42.4</sub>a <sub>0.492 </sub> <sub>0.002 </sub>
<i>abc<sub> Means with different letters within the same row differ at p<0.05</sub></i>
</div>
<span class='text_page_counter'>(45)</span><div class='page_container' data-page=45>
16
16
<b>Table 3. Mean values for live weight changes of growing pigs during the experiment </b>
<b>Live weight, kg </b> <b>PECR0 PECR5 PECR10 PECR15 </b>
<b>SEM </b> <i><b>p </b></i>
Initial 14.5 15.3 14.8 14.5 1.35 0.966
Final 25.0 27.4 28.1 28.9 1.41 0.302
Daily gain, g/day 125d <sub>150</sub>c <sub>167</sub>b <sub>183</sub>a <sub>2.68 </sub> <sub><0.001 </sub>
DMI, g/day 732c <sub>810</sub>b <sub>813</sub>b <sub>854</sub>a <sub>4.60 </sub> <sub><0.001 </sub>
DM conversion 5.9a <sub>5.4</sub>ab <sub>4.9</sub>b <sub>4.7</sub>b <sub>0.218 </sub> <sub>0.017 </sub>
<i>abc<sub> Mean values in rows without common superscript differ at p<0.05 </sub></i>
<b>Economic analysis </b>
Feed ingredient costs and an economic analysis of the experimental treatments
are shown in table 4 and 5, respectively. Feed cost/kg DM was lower for PECR0,
although differences between diets were small. However, because feed conversion
ratios were lowest for the PECR15 and PECR10 treatments (4.7 and 4.9 kg feed DM/kg
gain, respectively), feed costs/kg weight gain of the PECR15 and PECR10 treatments
were lowest (15,505 and 15,618 kip/kg live weight gain, respectively) and were highest
for the control diet or PECR0 (16,426 kip/kg gain).
<b> Table 4. Feed ingredient costs (LAK)</b>
Feed stuffs Kip/kg as feed Kip/kg DM
Taro 550 2,115
Banana stem 250 3,333
Cassava root 1,000 3,774
DAP 15,000 15,000
Urea 15,000 15,000
Yeast 35,000 35,000
PECR# <sub> - </sub> <sub>4,111 </sub>
<i> LAK = Lao Kip (Lao currency) exchange rate: 8,569 = 1 USD; </i>
<i> </i>#<i><sub>PECR: protein-enriched cassava root was calculate included price of DAP, </sub></i>
<i>urea and yeast from root processing </i>
<b> </b>
<b> Table 5. Economic analysis of experimental treatments (LAK)</b>
<b>Parameter </b> <b>PECR0 </b> <b>PECR5 </b> <b>PECR10 </b> <b>PECR15 </b> <b>SEM p-value </b>
Days of experiment 90 90 90 90 - -
LW gain, kg 10.5c <sub>12.1</sub>b <sub>13.3</sub>a <sub>14.4</sub>a <sub>0.255 </sub> <sub><0.001 </sub>
</div>
<span class='text_page_counter'>(46)</span><div class='page_container' data-page=46>
17
17
FCR kg DM/kg 5.9a <sub>5.4</sub>ab <sub>4.9</sub>b <sub>4.7</sub>b <sub>0.219 </sub> <sub>0.017 </sub>
Feed cost/kg 2,614 2,721 2,838 2,904 - -
Feed cost/kg LWG 16,426 16,391 15,618 15,505 - -
<i> LAK = Lao Kip (Lao currency) exchange rate: 8,569 = 1 USD; LW = live weight; DMI = </i>
<i>Dry matter intake </i>
<i> #<sub>No labour cost included </sub></i>
<b>DISCUSSION </b>
The increase in the true protein content of the cassava root by fermentation with
yeast, urea and DAP agrees with the findings of many researchers. Krisada et al.,
(2009) carried out a similar fermentation with fresh cassava root using urea and yeast.
The crude protein was increased from 3.2 to 21.1% in DM with 90% of the crude
<i>protein in the form of true protein. Fermentation of cassava peels by a pure culture of S. </i>
<i>cerevisiae increased the protein content from 2.4% to 14.1% (Antai and Mbongo, </i>
1994). Oboh and Kindahunsi, (2005) reported that the fermentation of cassava flour
<i>(pulp??) with S. cerevisiae increased the protein level from 4.4% to 10.9% in DM. </i>
The increase in growth rate (46%) by replacing Taro silage with
protein-enriched cassava root was comparable with that (32%) reported in an earlier experiment
(Manivanh and Preston, 2015). DM feed conversion in the present experiment (4.7)
was also better than Manivanh and Preston, (2016) DM feed conversion (5.7). Hang et
al., (2015) was showed the improvement in pig performance by replacing ensiled Taro
foliage with protein-enriched cassava root could be a reflection of the higher energy
value in the latter (% crude fiber in DM of 3.7 in cassava root compared with 11% in
Taro foliage).
Feed costs were lowest for the PECR15 diet, indicating that replacing taro
<i>(Colocasia esculenta) silage by protein-enriched cassava root can be the most </i>
economical for small-holder farmers.
<b>CONCLUSIONS </b>
There were positive linear responses in DM intake, live weight gain, feed
conversion, when protein-enriched cassava root partially replaced taro silage in
a basal diet of ensiled banana stem fed to Moo Lath pigs.
</div>
<span class='text_page_counter'>(47)</span><div class='page_container' data-page=47>
18
18
<b>CHAPTER 4 </b>
<b>APPARENT DIGESTIBILITY AND N RETENTION IN GROWING MOO </b>
<i><b>LATH PIGS FED ENSILED TARO FOLIAGE (Colocasia esculenta) REPLACED </b></i>
<i><b>BY PROTEIN-ENRICHED CASSAVA ROOT (Manihot esculenta Crantz) </b></i>
<b>ABSTRACT </b>
Four castrated male pigs (Moo Lath pig), weighing on average 15 kg were
allotted at random to 4 diets within a 4*4 Latin square design, to study effects on DM
intake, digestibility and N retention of levels of protein-enriched cassava root (PECR)
of 0, 25, 50 and 75% in combination with taro silage 80, 55, 30 and 5% with constant
levels of ensiled banana stem 20% (All on DM basis)
Enriching the protein content of cassava root (PECR) by fermenting it with
urea, diammonium phosphate and yeast and including the PECR at 25% in a diet of
ensiled cassava root, ensiled taro foliage and ensiled banana pseudostem, led to
increases in feed intake, diet digestibility and N retention in native Moo Lath pigs.
These criteria declined linearly when the proportions of PECR were 50% and 75% of
the diet DM. It is suggested that: (i) the benefits from the 25% PECR diet may have
been partially a response to its content of live yeast, the other possibility could be the
increased provision of vitamins of the β-complex from the yeast in the fermented
cassava root; and (ii) the results provide confirmatory evidence that pigs are able to
utilize small quantities of non protein nitrogen NPN recycled to the small intestone for
microbial synthesis to amino acids.
<i><b>Key words: banana pseudo-stem, diammonium phosphate, probiotic, solid-state </b></i>
<i>fermentation, urea, yeast </i>
<b>INTRODUCTION </b>
A series of experiments has been carried out recently in Lao PDR (Manivanh
and Preston, 2015; Manivanh and Preston, 2016; Manivanh et al., 2018; Sengxayalth
and Preston, 2017a; Vanhnasin and Preston, 2016; Vanhnasin et al., 2016) with the aim
of defining the potential of the solid-state fermentation process as a means of raising
the nutritive value content of cassava roots and cassava root pulp as the pig diet (Moo
Lath pig in Lao PDR and and Mong Cai pig in Vietnam).
</div>
<span class='text_page_counter'>(48)</span><div class='page_container' data-page=48>
19
19
residual NPN it could still be in the form of urea, the hydrolysis of which by urease
might be reduced due to the rapid fall in pH with the onset of fermentation.
Despite the apparent limitation of having some 30-40% of the nitrogen in
non-protein form there have been positive results when the non-protein-enriched pulp or root
was fed to pigs at levels to provide some 25% of the diet protein replacing protein from
ensiled taro foliage (Manivanh and Preston, 2015; Vanhnasin et al., 2016; Sengxayalth
and Preston, (2017b). At levels exceeding 25% of the diet protein, growth rates were
depressed slightly when the PECR replaced a balanced protein source (eg: ensiled taro
foliage) but fell to little over maintenance when the diet was composed of 75% PECR
and 25% of ensiled cassava root, a diet in which all the protein was from PECR
(Sengxayalth and Preston, 2017b).
The following experiment was designed to generate more information on the
effects of increasing dietary levels of PECR replacing a combination of ensiled taro
foliage and ensiled banana pseudo-stem in the diet of growing Moo Lath pigs.
<b>MATERIAL AND METHODS </b>
<i><b>Location and duration </b></i>
The experiment was conducted in the experimental area of Souphanouvong
University (SU), in Luang Prabang province, Lao PDR.
<b>Experimental design </b>
Four treatments were compared in a 4*4 Latin Square arrangement with 4 pigs
and 4 periods. The treatments (DM basis) were:
<b>PECR0: Taro silage (TS) 80% + ensiled banana stem (BS) 20% </b>
<b>PECR25: TS 55% + BS 20% + Protein-enriched cassava root 25% </b>
<b>PECR50: TS 30% + BS 20% + Protein-enriched cassava root 50% </b>
<b>PECR75: TS 5% + BS 20% + Protein-enriched cassava root 75 </b>
The duration of the experiment was 48 days with 4 periods each of 12 days, the
first 7 days for adaptation then 5 days for data collection (feed residues, feces and urine).
<b>Animals and housing </b>
The experiment was used four male castrated local pigs (Moo Lath pigs), with
average live weight of 15 kg were housed in cages made of bamboo, designed to
separate feces and urine.
<b>Experimental feeds </b>
</div>
<span class='text_page_counter'>(49)</span><div class='page_container' data-page=49>
20
20
Protein-enrichment of cassava root was processed by following method the
same as experiment 3 (chapter 3) and the ingredient was formulate repeaed from the
best treatment of experiment 1 (chapter 2) the ingreedients were: yeast (3%), urea
(1.4%) and di-ammonium phosphate (DAP) 2%. For urea, yeast and DAP were use the
same as experiment 1, 2 and 3. The mixtures were then allowed to ferment in closed
polyethylene bags for 7 days before feed animal.
Banana stems was processed the same method as experiment 3 (chapter 3)
before feed to animal.
The pigs were fed twice daily (8:00 am and 4:00 pm). The three ingredients
were mixed together before each feed. Feed was offered at ad libitum but with careful
observation of the intake so as to minimize residues. Drinking water was permanently
supplied through drinking nipples.
<b>Measurements and data collection </b>
The pigs were weighed in the morning before the start of each period and one
day after the end of the last period. Feed offered and refused was recorded collected
daily. Samples of feeds offered and refused were taken daily and sored at until the end
of each collection period when they were mixed and sub-samples take for analysis of
DM, ash and N. Feces and urine were collected daily. Each day 20 ml of 15 %
H2SO4 were added to the urine container to maintain the pH of the urine below 4.0. The
feces were stored at 4°C until the end of each collection period when they were mixed
and a sub-sample taken for analysis of DM, ash and N. A sub-sample of urine was
taken daily and stored at 4°C until the end of each collection period when the samples
was mixed and a sub-sample taken for analyses on N.
AOAC, (1990) methods of analysis were followed for analysis of: DM, ash and N in
feeds offered and refused and in feces; N in urine; and true protein after reacting the
samples with trichloro-acetic acid.
<b>Statistical analysis </b>
The data were analysed with the general linear model (GLM) procedure for
repeated measures in the SAS software (SAS, 2010), as a latinsquare split design. The
repeated measures were the data for each of the 5 consecutive days of data collection
<b>within each period. </b>
</div>
<span class='text_page_counter'>(50)</span><div class='page_container' data-page=50>
21
21
<b>RESULTS AND DISCUSSION </b>
<b>Chemical composition </b>
<b> The true protein in the PECR accounted for 53% of the crude protein (table 1), a value </b>
similar to that reported by Manivanh et al., (2016), Sengxayalth and Preston, (2017a);
Vanhnasin and Preston, (2016).
<b> Table 1. The chemical composition of feed ingredients (% in DM, except DM which is </b>
on fresh basis)
<b>DM </b> <b>N*6.25 </b> <b>OM </b> <b>True protein </b>
Taro silage <b>25.6 </b> <b>15.3 </b> <b>83.4 </b> <b>- </b>
Ensiled banana stem 8.2 4.3 93.1 -
PECR 28.4 13.7 98.4 7.3
<b>Feed intake </b>
The daily DM intake followed a curvilinear trend (y = -56.4x2<sub> + 276x + 366; R² </sub>
= 0.70) increasing to a maximum as the proportion of PECR was raised from 0 to 25%
then declining with higher proportions of PECR (table 2). As a function of liveweight
the intakes were high (33 to 44 g DM/kg live weight).
<b>Table 2. Mean values of DM intake by pigs fed protein-enriched cassava root (PECR) </b>
replacing taro silage with constant levels of ensiled banana stem
<b>PECR0</b> <b>PECR25</b> <b>PECR50</b> <b>PECR75</b> <b>SEM</b> <i><b>p</b></i>
<i>DM intake, g/day</i>
PECR 0 180 307 422 6.13
Taro silage 429 381 177 25 5.29
Banana stem 140 180 154 137 3.25
Total 569c <sub>741</sub>a <sub>639</sub>b <sub>585</sub>c <sub>13.5</sub> <sub><0.001</sub>
g/kg LW 33c <sub>44</sub>a <sub>38</sub>b <sub>35</sub>c <sub>0.531</sub> <sub><0.001</sub>
<i>abc<sub> Means with different letters within the same row differ at p<0.05</sub></i>
<b>Apparent digestibility </b>
</div>
<span class='text_page_counter'>(51)</span><div class='page_container' data-page=51>
22
22
<b>Table 3. Apparent digestibility (%) of diets with PECR replacing ensiled taro foliage with </b>
<b>constant levels of ensiled banana stem </b>
<b>PECR0 </b> <b>PECR25 </b> <b>PECR50 </b> <b>PECR75 </b> <b>SEM </b> <i><b>p </b></i>
Dry matter 64.7a <sub>70.9</sub>a <sub>64.0</sub>ab <sub>56.9</sub>b <sub>2.04 </sub> <sub><0.001 </sub>
Organic matter 59.7b <sub>68.4</sub>a <sub>62.4</sub>ab <sub>57.0</sub>b <sub>2.157 </sub> <sub>0.003 </sub>
Crude protein 75.0a <sub>74.2</sub>a <sub>71.8</sub>ab <sub>68.0</sub>b <sub>1.63 </sub> <sub>0.002 </sub>
<i>abc<sub> Means with different letters within the same row are different at P<0.05 </sub></i>
<b>Nitrogen balance </b>
N intake and N retention increased with curvilinear trends reaching maximum
levels with 25% PECR in the diet thereafter decreasing (table 4). Part of the increase in
N retention was apparently due to the increased N intake; however, correction of the
data by covariance for differences in N intake did not change the relative pattern of
response to PECR level in the diet. The improvement in N retention with increasing
levels of PECR replacing mixed silages of taro foliage and banana stem contrasts with
the observed linear decrease in apparent N digestibility (table 4).
<b>Table 4. Mean values for N balance in pigs fed protein enriched cassava root replacing taro </b>
<b>silage with constant levels of ensiled banana stem </b>
<b>PECR0 </b> <b>PECR25 </b> <b>PECR50 </b> <b>PECR75 </b> <b>SEM </b> <i><b>p </b></i>
<i><b>N balance, g/d </b></i>
Intake 8.77c <sub>10.6</sub>a <sub>9.55</sub>b <sub>9.09</sub>bc <sub>0.188 </sub> <sub><0.001 </sub>
Feces 2.16b <sub>2.74</sub>ab <sub>2.65</sub>ab <sub>2.93</sub>a <sub>0.180 </sub> <sub><0.001 </sub>
Urine 1.77b <sub>1.78</sub>b <sub>2.56</sub>a <sub>2.40</sub>a <sub>0.122 </sub> <sub><0.001 </sub>
<i><b>N retention </b></i>
g/day 4.84b <sub>6.10</sub>a <sub>4.34</sub>bc <sub>3.77</sub>c <sub>0.16 </sub> <sub><0.001 </sub>
% of N digested 73.6a <sub>77.3</sub>a <sub>63.7</sub>b <sub>60.8</sub>b <sub>1.70 </sub> <sub><0.001 </sub>
% of N intake 55.1a <sub>57.5</sub>ab <sub>45.6</sub>b <sub>41.3</sub>b <sub>1.45 </sub> <sub><0.001 </sub>
<i><b>N retention corrected by covariance for differences in N intake </b></i>
g/day 4.95b <sub>5.93</sub>a <sub>4.33</sub>bc <sub>3.83</sub>c <sub>0.168 </sub> <sub><0.001 </sub>
<i>abc<sub> Means with different letters within the same row are different at p<0.05 </sub></i>
<b>DISCUSSION </b>
</div>
<span class='text_page_counter'>(52)</span><div class='page_container' data-page=52>
23
23
microbes in the small intestine (Patterson et al., 1995) and Stein et al., 1996). Colombus et
al., (2014) infused urea into the cecum of pigs fed a diet deficient in the amino acid valine,
and showed that it was recycled to the small intestine where it was converted by bacteria
into amino acids with the result that N retention was increased. These findings were
corroborated by Mansilla et al., (2015).
Amino acid synthesis from dietary NPN could be the explanation for the
positive effects on growth rate at the lower level of substitution of soybean protein by
protein-enriched cassava pulp, since protein was set at the limiting level of 10% of diet
DM. At this level of dietary protein, additional amino acids resulting from microbial
synthesis of amino acids from NPN could have played a critical role in increasing
growth rate. However, at higher rates of substitution of 50 and 75% of the taro protein
by protein-enriched cassava root, the levels of residual NPN (ammonia and urea) may
have exceeded the capacity of the gut microbes to synthesize it into amino acids with
resultant toxic effects of the ammonia leading to reduced feed intake and therefore
reduced growth rate.
The other factors to be taken into consideration are the possible “prebiotic and
probiotic” effects arising from the live yeast and lactobacilli present in the fermented
cassava pulp. Thiep, (2017) unpublished data) reported concentrations of yeast of 9
million CFU/g and lactobacilli 17 million CFU/g in cassava pulp fermented with yeast,
urea and DAP. Positive effects on N retention in Moo Lath pigs were reported by Sivilai
et al., (2017) when rice distillers’ by-product and brewers’ grains were fed at 4% of the
diet DM. Both these dietary supplements are equally rich in live yeast and lactobacilli
(Thiep, 2017) unpublished data.
The issues that are raised are: (i) the benefits from 25% PECR in the diet were
due to the presence of live yeast (estimated to be about 1% of the DM of the PECR25
diet) acting as a probiotic and: (ii) pigs can apparently utilize small quantities of
non-protein-nitrogen through absorption of the NPN from the large intestine and subsequent
recycling in the blood to the small intestine where microbes use the NPN for synthesis
of amino acids (Colombus et al., 2014).
</div>
<span class='text_page_counter'>(53)</span><div class='page_container' data-page=53>
24
24
for the benefits of having at least a part of the dietary protein being provided by
<b>nutrient-ich foliages such as taro. </b>
<b>CONCLUSIONS </b>
Enriching the protein content of cassava root (protein-enriched cassava root) by
fermenting it with urea, diammonium phosphate and yeast and including the
PECR at 25% in a diet of ensiled cassava root, ensiled taro foliage and ensiled
banana pseudostem, led to increases in feed intake, diet digestibility and N
retention in native Moo Lath pigs.
These criteria declined linearly when the proportions of protein-enriched
cassava root were increased to 50 and 75% of the diet DM.
It is suggested that: (i) the benefits from the 25% protein-enriched cassava root
diet may have been partially a response to its content of live yeast and the other
possibility could be the increased provision of vitamins of the β-complex from
the yeast in the fermented cassava root and (ii) the results support earlier
research showing that pigs are able to utilize small quantities of NPN recycled
to the intestine for microbial
<b>GENERAL CONCLUSIONS </b>
The true protein in cassava root increased with a curvilinear trend (R2<sub> = 0.98) from </sub>
2.3 to 6.87% in DM as the fermentation time increased from zero to 14 days, the proportion
of true protein in crude protein increasing from 24.6 to 63.7 over the same period.
Increasing the proportion of DAP from zero to 2% of the substrate DM increased the
true protein from 5.6 to 7.3%% after 14 days of fermentation. 30% of the original root
DM was fermented in the partial conversion of root carbohydrate to true protein after
14 days of fermentation. Steaming the cassava root prior to fermentation appeared to
have a slightly positive effect on conversion of crude to true protein.
The pH decreased with fermentation time, according to an almost linear trend,
from 5.8 immediately after mixing the substrate, to 5.4 in 3h and to 3.43 after 7 days.
The level of crude protein after mixing the substrate and additives was 10.35% in DM
and did not change over the 7 days of fermentation. There were no differences between
the aerobic and anaerobic condition, other than a tendency for the pH to fall slightly
more quickly in the first 4 days in the anaerobic condition followed by a slower rate of
fall to reach almost the same final value after 7 days, as for the aerobic condition. It is
suggested that the incomplete conversion of urea-N and ammonia-N to yeast protein is
because of incomplete hydrolysis of urea to ammonia due to action of urease being
inhibited by the fall in pH during the fermentation.
</div>
<span class='text_page_counter'>(54)</span><div class='page_container' data-page=54>
25
25
phosphate (DAP), have the potential to improve the economical efficiency of
smallholder pig production in Laos.
</div>
<!--links-->