phân tích dạng một số kim loại trong trầm tích và đánh giá khả năng tích lũy đồng và chì trong nghêu meretrix lyrata nuôi ở vùng cửa sông tiền
Bạn đang xem bản rút gọn của tài liệu. Xem và tải ngay bản đầy đủ của tài liệu tại đây (581.11 KB, 25 trang )
<span class='text_page_counter'>(1)</span><div class='page_container' data-page=1>
1
ticersini <b>COLLEGE OF SCIENCES </b>
<b>--- </b>
<b>HOANG THI QUYNH DIEU </b>
<b>ANALYSIS AND ASSESSMENT THE </b>
<b>BIOACCUMULATION OF COPPER AND LEAD BY </b>
<i><b>BIVALVE (Meretrix lyrata) CULTURED IN TIEN </b></i>
<b>ESTUARY </b>
<b>THE ABSTRACT OF DOCTORAL DISSERTATION</b>
</div>
<span class='text_page_counter'>(2)</span><div class='page_container' data-page=2>
2
<b>COLLEGE OF SCIENCES </b>
<b>--- </b>
<b>HOANG THI QUYNH DIEU </b>
<b>ANALYSIS AND ASSESSMENT THE </b>
<b>BIOACCUMULATION OF COPPER AND LEAD </b>
<i><b>BY BIVALVE (Meretrix lyrata) CULTURED IN </b></i>
<b>TIEN ESTUARY </b>
<b>MAJOR: ANALYTICAL CHEMISTRY </b>
<b>CODE: 62 44 01 18 </b>
<b>THE ABSTRACT OF DOCTORAL </b>
<b>DISSERTATION </b>
<b>SCIENTIFIC SUPERVISORS: </b>
</div>
<span class='text_page_counter'>(3)</span><div class='page_container' data-page=3>
<b>INTRODUCTION </b>
Toxic metals (Hg, Cd, Ni, As, Cr, Pb, Cu and Zn) from
environment (water, soil, sediment) could be bio-accumulated by
organism through food chain and affect human and animal health.
These metals originate from natural and/or anthropogenic sources
such as weathering of rock/soil and volcanic activity; industrial
processing of minerals and ores, industrial use of metals and metal
complexes… Sediments in rivers, lakes, oceans and especially
estuaries are accounted for the sinks of toxic metals in aquatic
ecosystems.
In Vietnam, many bivalve species are cultured on a large
scale in estuarine areas, such as the Tien Estuary in the Tan Thanh
Commune of the Go Cong Dong District in Tien Giang Province,
South Vietnam. This area is where the Tien River - a tributary of the
Mekong River - meets the sea. For years, this estuary has served as
<i>one of the focal areas for culturing clam (Meretrix lyrata) in South </i>
Vietnam, with an average yield of 20,000 tons per year for domestic
<i>consumption. The culture cycles of M. lyrata range from 8 to 10 </i>
months.
To date, few studies have examined the toxic metal
<i>bioaccumulation in M. lyrata cultured in the Tien Estuary. </i>
<i>Especially, the accumulation of metal in sediment and M. lyrata; </i>
metal speciation in sediment and bioavailability of them; the
<i>potential of M. lyrata to assess sediment contamination with toxic </i>
metals have not yet investigated. In recent years, the Centre of
environment monitoring of Tien Giang province and nearby
provinces have held many campaign of water monitoring for the Tien
River, but none of them have enough information about toxic metals
to assess their pollution level and effects on the estuarine water
environment.
</div>
<span class='text_page_counter'>(4)</span><div class='page_container' data-page=4>
<i><b> The main objectives of our study were: </b></i>
1) Assessment of the concentration of Fe, Mn and toxic metals
(Cd, As, Pb, Ni, Cr, Cu, Zn) in water of Tien River and Tien estuary;
2) Assessment of the toxic metals speciation in sediment
<i>3) Assessment of the toxic metals accumulation in M. lyrata </i>
cultured in Tien estuary
4) Assessment of the rate of copper and lead accumulation in
<i>M. lyrata through experiment of exposure to seawater or seawater – </i>
sediment environment added with different dissolved metal levels.
<i>Examining the potential of using M. lyrata as a biomonitor to assess </i>
sediment contamination with copper and lead in Tien estuary.
<i><b>Structure of the dissertation </b></i>
The study consists of 116 pages, 39 tables and 25 figures, of
which there are:
8 pages of index, list of tables, figure and abbreviation
3 pages of introduction
28 pages of literature review
16 pages of research subjects and methodology
51 pages of result and discussion
02 pages of conclusion
16 pages of reference, with 179 references
<b>CONTENTS </b>
<b>CHAPTER 1. LITERATURE REVIEW </b>
Sources of toxic metals in the environment;
Metal speciation in the environment;
Toxic effects of toxic metals on human health;
Accumulation of toxic metals in organism, bioindicator for
toxic metal pollution and related studies;
Introduction of Tien river, Tien estuary and white clam
<i>(Meretrix lyrata); </i>
Analytical techniques for toxic metals;
</div>
<span class='text_page_counter'>(5)</span><div class='page_container' data-page=5>
sediment and related studies;
Assessment of toxic metals accumulation in sediment and
organism.
<b>CHAPTER 2. RESEARCH SUBJECTS AND </b>
<b>METHODOLOGY </b>
<b>2.1. Specific research subjects </b>
1) Assessment of the concentration of toxic metals (Cd, As,
Pb, Ni, Cr, Cu, Zn), Fe and Mn in water of Tien River and Tien
estuary.
2) Assessment of toxic metals (Cd, As, Pb, Ni, Cr, Cu and Zn)
contamination in sediment by using geochemical load index and
enrichment factor.
3) Assessment of toxic metals speciation in sediment,
including 5 fractions (associated forms): Exchangeable; Carbonate
bound; Fe and Mn oxides bound; Organic matter bound; Residual.
Risk assessment of these metal species to environment and organism.
4) Correlation analysis between the metal species in sediment
<i>and those in M. lyrata. Assessment of the rate of metal accumulation </i>
<i>from the sediment by M. lyrata and the potential risk to the aquatic </i>
environment by using Biota-sediment accumulation factor (BSAF)
and Risk assessment code (RAC).
5) Assessment of the rate of copper and lead accumulation in
<i>M. lyrata through experiment of exposure to seawater or seawater – </i>
sediment environment containing different dissolved metal levels.
<i>Examining the potential of using M. lyrata as a biomonitor to assess </i>
sediment contamination with copper and lead in Tien estuary.
<b>2.2. Research methodology </b>
- Sampling method:
</div>
<span class='text_page_counter'>(6)</span><div class='page_container' data-page=6>
widths) and in the middle of the river. Sampling and preservation
were performed according to the standard protocol (ISO 5667–
1:2006 and ISO 5667–3:2003)
<i> + Water of Tien estuary: Sampling was conducted at 7 sites </i>
(S1–S7) in three periods: June, August, and November 2015. Each
sample was obtained by mixing water collected at 2 locations spaced
approximately 1 km apart at each site at a depth of 40–50 cm.
<i>+ Sediment sampling: Sampling was conducted at 7 sites (S1–</i>
S7) in three periods: June, August, and November 2015. Sediments
were sampled using an Ekman grab sampler at 2 locations spaced
<i>approximately 1 km apart at each site at a depth of 0–10 cm (M. </i>
<i>lyrata generally live at this depth). Each sediment sample of </i>
approximately 1 kg wet weight was obtained by mixing sediments
randomly collected at three points of a triangle spaced 1 m apart.
Sampling and preservation were performed according to the standard
protocol (ISO 5667–13:1997 and ISO 5667–15:1999).
<i>+ M. lyrata sampling: Sampling was conducted at 7 sites (S1–</i>
S7) in three periods: June, August, and November 2015. A total of
<i>20–25 M. lyrata clams aged 7–9 months (30 days before harvesting) </i>
and approximately 4 cm in size were collected at each of the two
locations at each sampling site, for an overall sample size of 40–50
<i>individuals. The M. lyrata clams were packed into plastic bags, </i>
preserved at 4°C and transported to the laboratory within two hours.
<i>- Sample preparation method for toxic metals analysis in water </i>
sample (SMEWW–3030); in sediment sample (metal speciation –
<i>Tessier’s method, total metal – EPA 3052); in M. lyrata (FDA-EAM </i>
4.7).
<i> - Analytical methods for determining metals in water – </i>
<i>SMEWW-3125B; in sediment – EPA-6020B; in M. lyrata – </i>
FDA-EAM 4.7.
<i>- Optimization of conditions for ICP-MS analysis of the </i>
<i>metals: optimization of general parameters and mass calibration; </i>
nebulizer flow; collision gas flow; analysis time; washing time.
<i>- Quality control of analytical methods: isotope selection and </i>
</div>
<span class='text_page_counter'>(7)</span><div class='page_container' data-page=7>
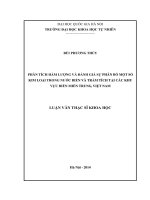
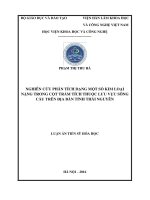
<i><b>Figure 2.1. Tien estuary (study area) and sampling sites </b></i>
<i> - Assessment of toxic metals contamination level in water and </i>
<i>sediment: based on national guidelines or some indices (Geological </i>
Accumulation Index/Igeo, Enrichment Factor/EF).
<i>- Assessment of toxic metals contamination level in M. lyrata: </i>
based on national guidelines or BSAF index.
- Assessment of the level of copper and lead accumulated in
<i>M. lyrata by the experiment of exposure to the estuary water or the </i>
estuary – sediment environment containing dissolved metal levels
<i>increased in order to examine the potential of using M. lyrata as a </i>
biomonitor of the metal pollution in the Tien estuary environment.
<b>CHAPTER 3. RESULT AND DISCUSSION </b>
<b>3.1 Optimization for analysis conditions of ICP-MS </b>
<i><b>3.1.1. Optimization of general parameter and mass calibration </b></i>
<i><b>3.1.2. Optimization of nebulizer flow </b></i>
<i><b>3.1.3. Optimization of collision gas flow </b></i>
<i><b>3.1.4 Optimization of analysis time and washing time </b></i>
</div>
<span class='text_page_counter'>(8)</span><div class='page_container' data-page=8>
<i><b>Table 3.1. Instrumental settings for the ICP-MS instrument </b></i>
No Parameter Value
1 RF power 1550 W
2 Nebulizer flow 0.96 (L/min)
3 Collision gas flow 5.5 (mL/min)
4 Analysis time 30 (second)
5 Washing time 20 (second)
6 Peristaltic pump 0.3 (round/min)
<b>3.2. Quality Control Analysis </b>
<i><b>3.2.1. Isotope selection and calibration range </b></i>
<i><b>Table 3.2. The equation of the calibration curve </b></i>
No Element Equation
Y = a*X + b r
1 Cd Y = 6.33*103 X + 1.61*102 0.9998
2 Ni Y = 8.25*104 X + 2.11*103 0.9999
3 Cr Y = 8.96*104 X + 1.03*103 0.9999
4 As Y = 9.63*103 X + 1.44*102 0.9999
5 Pb Y = 7.07*104 X + 2.30*103 0.9999
6 Cu Y = 6.15*104 X + 2.31*103 0.9997
7 Zn Y = 5.03*103 X + 1.41*102 0.9997
8 Fe Y = 8.40*104 X + 4.52*103 0.9999
9 Mn Y = 9.54*104 X + 2.37*103 0.9998
Y: count per second; X: concentration (µg/L); r: the coefficient of correlation
<i><b>3.2.2. Limit of detection, limit of quantification </b></i>
<i><b>Table 3.3. Limit of detection, limit of quantification of ICP-MS </b></i>
instrument
No Element LOD (µg/L) LOQ (µg/L)
1 Cd 0.03 0.10
2 Ni 0.03 0.10
3 Cr 0.03 0.10
4 As 0.03 0.10
</div>
<span class='text_page_counter'>(9)</span><div class='page_container' data-page=9>
No Element LOD (µg/L) LOQ (µg/L)
6 Cu 0.03 0.10
7 Zn 0.1 0.30
8 Fe 0.1 0.30
9 Mn 0.1 0.30
<i>Repeatability: The results shown that the analysis methods </i>
gained good repeatability. The RSD values obtained in our
laboratory were 1%-14% (for water), 2.6%-14.7% (for sediment) and
<i>2.0%- 8.6% (for M. lyrata); two times lower than ones of 11 – 28%, </i>
calculated by Horwitz equation.
<i><b>Table 3.4. Limit of detection, limit of quantification of </b></i>
analytical methods using ICP-MS system
Element River water <sub>(μg/L) </sub> Estuary water <sub>(μg/L) </sub> <i>M. lyrata </i>
(mg/kg)
Sediment
(mg/kg)
Cd 0.3/0.9 0.3/0.9 0.01/0.03 0.001/0.003
Ni 0.3/0.9 1.0/3.0 0.06/0.18 0.005/0.015
Cr 0.3/0.9 0.3/0.9 0.06/0.18 0.005/0.015
As 0.3/0.9 0.3/0.9 0.06/0.18 0.005/0.015
Pb 0.3/0.9 0.3/0.9 0.06/0.18 0.001/0.003
Cu 0.3/0.9 0.3/0.9 0.06/0.18 0.005/0.015
Zn 1.0/3.0 3.0/9.0 1.0/3.0 0.010/0.030
Fe 1.0/3.0 3.0/9.0 1.0/3.0 1.0/3.0
Mn 1.0/3.0 3.0/9.0 1.0/3.0 1.0/3.0
Limit of detection and limit of quantification are presented in the form of
“LOD/LOQ”
<i>Accuracy: For spiked sample, the analysis method had good </i>
trueness with recovery in the range of 98 – 106% for the metal levels
in the water sample; For CRM sample, the analysis had good
trueness with the metal contents found in the 95% confidence
interval of certified values.
<b>3.3. Levels of the metals in Tien River water </b>
</div>
<span class='text_page_counter'>(10)</span><div class='page_container' data-page=10>
- The levels of toxic metals determined in the dry season were
higher than those in the rainy season.
- There was an increasing trend of the metals concentrations
from upstream to downstream.
<b>3.4. Levels of the metals in Tien estuary water </b>
- Except Fe, the metal levels did not exceed the limit values
given by the national regulation of QCVN 10-MT:2015/BTNMT.
-The metal concentrations in the first sampling campaign
were significantly higher than those in the other sampling campaigns.
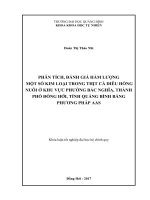
<i><b>3.5. Toxic metal contents in sediment and M. lyrata </b></i>
<i><b>3.5.1. Toxic metal contents in sediment </b></i>
Concentration (mg/kg dry)
0
5
10
15
20
25
30
35
As Cu Pb Metal
S1 S2 S3 S4
S5 S6 S7
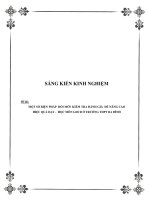
<i><b>Figure 3.9. As, Cu and Pb contents (mg/kg dry weight) in sediment </b></i>
- All the sediment samples in this study met the regulations
given by QCVN 43:2012/BTNMT for the metal contents.
- The mean metal levels in the sediment (mg/kg dry weight)
followed the order: Zn (60) Cr (46) Ni (22) As (17) Pb (14)
Cu (4.7) Cd (0.05).
</div>
<span class='text_page_counter'>(11)</span><div class='page_container' data-page=11>
terrace) contain more sand than the other sites (30% and 15%,
respectively).
- A linear correlation was found between the metal contents in
the sediment with R = 0.57 – 0.98 (p < 0.01).
Concentration (mg/kg dry weight)
0
10
20
30
40
50
60
70
80
90
Cd* Zn Ni Cr
Metal
S1 S2 S3 S4 S5
S6 S7
<i><b>Figure 3.10. </b></i>Cd, Zn, Ni and Cr contents (mg/kg dry weight) in
sediment; * Cd content presented as µg/kg dry weight)
<i><b>3.5.2. Toxic metal accumulation in sediment </b></i>
<i><b>Table 3.15. I</b></i>geo values for toxic metals in sediment at Tien estuary
Metal Site
S2 S3 S5 S6 S7 S1 S4
Cd -2.9 -2.9 -2.9 -2.8 -2.7 -2.0 -2.2
Ni -0.6 -0.6 -0.6 -0.6 -0.6 0 0
Cr -0.2 -0.3 -0.2 -0.3 -0.3 0 0
As 2.2 2.2 2.1 2.1 2.1 3.4 3.4
Pb -0.8 -0.8 -0.9 -0.9 -0.8 -0.3 -0.3
Cu -4.2 -4.3 -4.3 -4.3 -4.2 -3.9 -3.9
Zn -1.5 -1.5 -1.5 -1.5 -1.5 -0.8 -0.7
Fe -1.6 -1.6 -1.6 -1.6 -1.6 -1.1 -1.1
</div>
<span class='text_page_counter'>(12)</span><div class='page_container' data-page=12>
S1, S4 sites (Igeo 3.4), and moderately contaminated at other sites
(Igeo 2.1 – 2.2).
<i> - The EF values for As were 21.8 and 22.5 at S1, S4 sites, and </i>
12.4 – 13.6 at other sites. This again confirmed high accumulation of
As in S1 and S4 sites, and moderate accumulation of the metal at
other sites. Ni and Cr were accumulated in the sediment at fairly low
level with the EF of 1.9 to 2.6; while Cd, Zn, Cu and Pb were
non-accumulated with low EF values in the range of 0.2 – 1.7.
<i><b>Table 3.16. EF values for toxic metals in sediment at Tien estuary </b></i>
Metal Site
S2 S3 S5 S6 S7 S1 S4
Cd 0.4 0.4 0.4 0.5 0.5 0.5 0.5
Ni 2.1 1.9 1.9 2.1 2.0 2.0 2.1
Cr 2.6 2.4 2.5 2.6 2.4 2.0 2.1
As 13.6 13.4 13.0 13.6 12.4 21.8 22.5
Pb 1.7 1.7 1.6 1.7 1.7 1.7 1.7
Cu 0.2 0.2 0.2 0.2 0.2 0.1 0.1
Zn 1.1 1.0 1.0 1.1 1.1 1.2 1.3
<i><b>3.5.3. Toxic metal contents in M. lyrata </b></i>
<i>- The contents of toxic metals in the body tissue of M. lyrata </i>
showed that, although there was a considerable fluctuation of metal
<i>levels in M. lyrata with coefficient of variation (CV) of 6 to 22%, </i>
they did not exceed the international limit values given by the
guidelines of CODEX STAN193–1995; EC–1881 and S.I. 268. This
confirms that the species are safe for human consumption.
</div>
<span class='text_page_counter'>(13)</span><div class='page_container' data-page=13>
<i><b>Table 3.18. Toxic metal contents in the body tissue of M.lyrata (mg/kg dry weight)</b></i>(*)
Metal
Parameter Cd Ni Cr As Pb Cu Zn
Min–max 1.3–1.9 1.5–2.8 1.8–3.4 11–16 0.3–0.6 6.9–8.7 95–128
Mean S (n 21) 1.7 ± 0.2 2.2 ± 0.3 2.7 ± 0.4 13 ± 1 0.4 ± 0.1 8.0 ± 0.5 113 ± 9
CV, % 12 14 15 8 21 6 8
Tu et al (2010) 1.66±0.28 - 0.92±0.2 4.6±0.5 0.20±0.04 6.16±0.99 113 ± 20
1. CODEX STAN 193-1995 a ≤ 22.2 - - - -
2. EC-1881 a ≤ 22.2 - - - ≤ 16.7 - -
3. S.I. 268 ≤ 5.0 ≤ 5.0 ≤ 6.0 ≤ 30 ≤ 7.5 ≤ 400 ≤ 4000
4. Regulation of Malaysia (1985) a - - - ≤ 11.1 ≤ 22.2 ≤ 11.1 -
5. Regulation of Thailand (1986) a - - - ≤ 22.2 ≤ 11.1 ≤ 222 ≤ 1111
6. Regulation of Korea (2009) a 22.2 - - - ≤ 22.2 - -
7. Regulation of Australia (2016) a ≤ 22.2 - - ≤ 11.1 ≤ 22.2 - -
(*) (-) means non-regulated;
</div>
<span class='text_page_counter'>(14)</span><div class='page_container' data-page=14>
of metal in mobile and exchangeable forms. Clearly, besides total
metal, it is necessary to measure mobile and exchangeable forms of
toxic metals in sediment.
<b>3.6. Metal speciation in sediment and bioaccumulation in </b>
<i><b>Meretrix lyrata in the Tien estuary </b></i>
<i><b>3.6.1. Toxic metal speciation in sediment </b></i>
Ratio (%)
0%
20%
40%
60%
80%
100%
Cd Ni Cr As Pb Cu Zn
Metal
F1 F2 F3 F4 F5
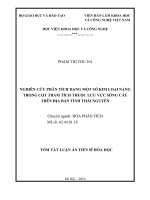
<i><b>Figure 3.13. Metal contents in the sediment fractions (%) </b></i>
- The concentrations, distribution and order of the different
fractions of toxic metals revealed the following:
+ The residual fraction (F5) dominated the distribution of toxic
metals in the sediments, with mean metal percentages of Cd (43)Pb
(53)Zn (60)Ni (83)Cu (84)As (85)Cr (94%). Excluding Cd,
these metals are strongly bound in crystal structures, reflecting the
geophysical characteristics of the sediments in the study area;
</div>
<span class='text_page_counter'>(15)</span><div class='page_container' data-page=15>
co-precipitation with Fe and Mn oxyhydroxides.
– The metal contents in the organic/sulfide-bound fraction
(F4) were low, with mean percentages of Cr (0.6)As (1.0)Zn
(2.1)Ni (2.9)Cd (3.3)Pb (6.5)Cu (9.2%).
– Excluding Cd, the metal contents in the exchangeable
fraction (F1) were higher than those in the carbonate-bound fraction
(F2). The highest proportion of Cd (37%) was detected in the
acid-soluble fraction (sum of the exchangeable and carbonate-bound
fractions) and was higher than those of the other metals. The mean
metal percentages in the acid-soluble fraction were Cr (0.4)Ni
(1.3)Cu (2.2)As (2.8)Zn (4.2)Pb (5.8%). This fraction consists
of contributions from anthropogenic sources such as industrial,
agricultural and urban activities. Due to the low level of these metals
in the acid-soluble fractions, the accumulation of these metals in
aquatic organisms in the study area may be insignificant.
- Two-factor ANOVA with replication was applied to the
results of the metal speciation in the sediments at all sampling
locations, yielding the following conclusions:
+ The metal concentrations in the acid-soluble fraction (sum of
the concentrations in F1 and F2) at all sites were significantly equal
(p 0.10; Fcalculated 1.4 F (0.10; 13; 252) 1.6), indicating that the
metal fraction originating from anthropogenic sources was the same
over the entire study area;
+ The summed metal concentrations in fractions F3, F4, and F5
at sites S1 and S4 were significantly higher than those at the other
sites (p 0.01; Fcalculated 66.8 F (0.01; 13; 196) 2.2). Sites S1 and S4
contained more sand (30%) than the other sites (15%), and the metals
were more strongly bound to crystal structures (sand and clay) than
to mud and silt in sediments at the study area.
<i><b>3.6.2. Metal contents in M. lyrata, BSAF (bio-sediment </b></i>
<i><b>accumulation factor) and RAC (risk assessment code) </b></i>
<i><b> i) About BSAF </b></i>
- The mean BSAFs of the metals in non-residual fractions for
<i>M. lyrata were Cd>Cu>As>Zn>Cr>Ni>Pb. Excluding Pb, the </i>
</div>
<span class='text_page_counter'>(16)</span><div class='page_container' data-page=16>
(24–869 and 9–155, respectively), indicating that these metals
<i>bioaccumulated in M. lyrata. </i>
- Since the percentages of Cd in mobile form were highest
(37%), Cd had the greatest BSAF (55 in the non-residual fraction
consisting of F1 + F2 + F3 + F4), indicating that this metal easily
bioaccumulated.
- Because Cu2+ ions can form strong complexes with soluble
organics, as mentioned above, part of the Cu in fractions F3 and F4
could be converted into a mobile form, increasing the Cu
<i>bioaccumulation in M. lyrata, with a BSAF of 10 in the non-residual </i>
fraction.
- In addition, As and Zn had high bioaccumulation levels, with
BSAFs of much greater than 1. The percentages of the mobile As
and Zn forms (2.8 and 4.2%, respectively) were greater than those of
the other metals, excluding Cd and Pb, which explains the high
bioaccumulation levels of As and Zn, with BSAFs of 5 in the
non-residual fraction.
<i><b>ii) About RAC: </b></i>
The RACs show that:
– Cr, with an RAC of less than 1%, poses no risk.
– Ni, As, Pb, Cu and Zn, with RACs of 1 – 10%, pose low risk
– Cd, with an RAC of 37%, poses high risk because it has the
highest mobile fraction in the sediment and can therefore easily
bioaccumulate and enters the food chain.
<i><b>3.6.3. Correlation between the metal contents in M. lyrata and </b></i>
<i><b>sediments </b></i>
- Correlation analysis was performed between the metal
contents in the exchangeable, acid-soluble, and non-residual
<i>fractions (x) and those in M. lyrata (y), the results shown that: </i>
+ For Cd, Ni, Cu and Zn, strong linear correlations existed
<i>between the metal concentration in M. lyrata (y) and that in the F1 </i>
fraction (x) (p < 0.01 and p < 0.05, respectively).
</div>
<span class='text_page_counter'>(17)</span><div class='page_container' data-page=17>
+ For Cd and Cu, significant correlations were found between
<i>the metal concentration in M. lyrata and that in the non-residual </i>
fractions (x) (p < 0.05).
<i>+ No correlations were found between the As content in M. </i>
<i>lyrata and that in the exchangeable, acid-soluble or non-residual </i>
fractions (x).
<i><b>Table 3.23. Correlations between the metal concentrations in M. </b></i>
<i>lyrata and the sediment fractions </i>(*)
Metal Fraction Correlation equation
Pearson
correlation
coefficient
(R)
p-value
Cd
F1
F1 + F2
F1 + F2 + F3 + F4
y = 0.012x - 0.009
y = 0.029x - 0.026
y = 0.040x - 0.028
0.56*
0.69*
0.49*
0.0089
0.0005
0.0239
Ni
F1
F1 + F2
F1 + F2 + F3 + F4
y = 0.027x + 0.015
y = 0.003x + 0.315
y = 0.145x + 4.434
0.67*
0.03
0.16
0.0009
0.8992
0.4798
Cr
F1
F1 + F2
F1 + F2 + F3 + F4
y = 0.001x + 0.024
y = 0.038x + 0.083
y = 0.005x + 3.026
0.09
0.74*
0.01
0.7093
0.0001
0.9693
As
F1
F1 + F2
F1 + F2 + F3 + F4
y = 0.001x + 0.064
y = -0.016x + 0.649
y = -0.015x + 2.610
-0.02
-0.26
-0.09
0.9271
0.2646
0.6984
Pb
F1
F1 + F2
F1 + F2 + F3 + F4
y = -0.008x + 0.019
y = 0.840x + 0.494
y = -0.634x + 6.838
-0.12
0.66*
-0.19
0.6054
0.0013
0.4208
Cu
F1
F1 + F2
F1 + F2 + F3 + F4
y = 0.008x - 0.022
y = 0.022x - 0.069
y = 0.108x - 0.032
0.56*
0.78*
0.47*
0.0080
0.0001
0.0312
Zn
F1
F1 + F2
F1 + F2 + F3 + F4
y = 0.002x - 0.056
y = 0.013x + 1.101
y = 0.043x + 20.303
0.48*
0.41
0.25
0.0270
0.0607
0.2726
(*) These correlations were derived from the mean data of x and y found at 7
sampling sites in 3 sampling campaigns (n = 21); * Correlation is significant
</div>
<span class='text_page_counter'>(18)</span><div class='page_container' data-page=18>
in the study area.
<i><b>3.7. Copper and lead accumulation in M. lyrata cultured in water </b></i>
<b>environment in laboratory condition </b>
<i><b>3.7.1. Effect of metal levels and exposure time </b></i>
<i>- For testing the bioaccumulation of Cu and Pb in M. lyrata, </i>
28-days culture was carried out at laboratory. The levels of metals
added to the containers were as followed: M1 - 30 µg/L Cu and 50
µg/L Pb (abbreviated to M1-30-50), M2-60-150, M3-100-300 and
M4-200-600, respectively. The result showed that:
- For metal concentrations (level M1, M2 and M3): the metal
concentrations in the bivalves (y) increased with the exposure time
(x) (R 0.97 – 0.99);
- For metal concentrations (level M4): after 14 days of the
exposure, the metals concentrations in the bivalves trended to
decrease, the first death occurred on the 22nd day of exposure and all
organisms died on 28th day of exposure;
- Pb accumulated in the bivalves much more than Cu;
-The correlation coefficients between the metal concentrations
accumulated in the bivalves (y) and the metal concentrations added
to the containers (x) shown that:
+ For 7 days of exposure: there was linear correlation between y
and x (R 0.88 – 0.90);
+ For 14 days of exposure: there was strong linear correlation
between y and x with R 0.95 – 0.99 (p ≤ 0.05);
+ For 21 days of exposure: there was linear correlation between
y and x with R 0.75 – 0.87 (p ≥ 0.10);
+ For 28 days of exposure: there was strong linear correlation
between y and x with R 0.99 (p 0.05).
</div>
<span class='text_page_counter'>(19)</span><div class='page_container' data-page=19>
<i><b>Table 3.25. Linear correlation between the metal contents in the M. lyrata and initial concentration of </b></i>
dissolved metals, and exposure time (*)
Factor Cu Pb
Equation R P Equation R p
Correlation between
the metal content in
<i>the M. lyrata</i>and
exposure time
M1–30–50 y = 12x + 501 0.985 0.02 y = 89x – 484 0.967 0.03
M2–60–100 y = 16x + 632 0.999 0.01 y = 454x –
2430 0.976 0.02
M3–100–300 y = 41x + 271 0.990 0.01 y = 748x +
1365 0.990 0.01
M4–200–600(*) – – – – – –
Correlation between
the metal content in
<i>the M. lyrata and </i>
initial level of
dissolved metals
7 days y = 2.9x + 485 0.880 0.12 y = 15x + 209 0.898 0.10
14 days y = 5.3x +
466 0.952 0.05 y = 50x – 3572 0.993 0.01
21 days y = 2.4x +
756 0.896 0.10
y = 23x +
3921 0.752 0.25
28 days (**) y = 8.9x +
578 0.999 0.03 y = 81x – 1772 0.999 0.01
(*)For these equations, initial concentrations of dissolved Cu and Pb (x) is 30, 60, 100 µg/L and 50, 100, 300, respectively, due to M.
<i>lyrata reached steady-state after 21 days of exposure at level M4-200-600 </i>
</div>
<span class='text_page_counter'>(20)</span><div class='page_container' data-page=20>
<i><b>3.7.2. Rate of the metal accumulation </b></i>
<i><b>Table 3.26. Rate of the metal accumulation by the M. lyrata (*) </b></i>
No
Initial levels
of metals
(µg/L)
Cu Pb
RMA
(µg/kg/day) Equation
RMA
(µg/kg/day) Equation
1 M1–30–50 6 ± 5
y 0.41x
– 9.2
R 0.996
p 0.004
77 ± 7
y 3.4x –
139
R 0.997
p 0.002
2 M2–60–100 15 ± 3 371 ± 35
3 M3–100–300 28 ± 11 797 ± 80
4 M4–200–600 25 ± 9 623 ± 127
<i><b>3.8. Bioaccumulation of copper and lead by bivalve Meretrix </b></i>
<i><b>lyrata cultured in water – sediment environment </b></i>
<i><b>3.8.1. Effect of metal levels and exposure time </b></i>
<i><b>Variation of the metal concentrations in the experiment container: </b></i>
For copper (Cu): Although there was increase in Cu
concentrations added to the containers, the concentrations of
dissolved Cu in the water phase still was significantly equal for the
same metal-to-bivalve exposure time (p > 0.05; Fcalculated 2.9 F(0.05;
3,24) 3.0); The concentrations of dissolved Cu in the containers for
the different exposure time was significantly different (p 0.05;
Fcalculated 3.0 F(0.05; 5,24) 2.6); From the time adding the metal to
the container (day 0) to day 28, dissolved Cu concentrations
decreased about 91 – 99% (compared with Cu concentrations added
to the container).
<i>For lead (Pb): The results in Table 2 show that, although </i>
increased Pb concentrations added to containers, after one day of the
exposure, the concentrations of dissolved Pb in all the containers
were below 0.2 µg/L
<i><b>Variation of the metal concentrations in the bivalves </b></i>
<i> - For exposure time: the metal concentrations in the bivalves </i>
</div>
<span class='text_page_counter'>(21)</span><div class='page_container' data-page=21>
significance with p 0.05). Cu accumulated in the bivalves much
<i>more than Pb </i>
<i>- For the metal concentrations added to the containers: the </i>
correlation coefficients between the metal concentrations
accumulated in the bivalves (y) and the metal concentrations added
to the containers (x) shown that: there was strong linear correlation
between y and x (R 0.73 – 0.99), except the case for Pb after 7
exposure days (R 0.034); for Pb, only 4 of 8 cases were of
significance with p 0.05
It should be noted that because there was the strong linear
correlation between the metal concentrations in the bivalves and the
concentrations added to the containers, the metals accumulated in the
bivalves must be derived from both the metals in the water phase and
the sediment phase. Besides, the increase of the metal concentrations
in the bivalves together with the increase of the metal concentrations
added to the containers and the exposure time allowed confirming
<i>that M. lyrata could be used as bio-indicator for the metal pollution </i>
in aquatic environment at the study area.
<i><b>3.8.1. Rate of the metal accumulation (RMA) in M. lyrata </b></i>
<i><b>Table 3.29. Rate of the metal accumulation (RMA) in M. lyrata </b></i>
bivalves after 28 days of exposure (*)
No Initial levels of
metals (µg/L)
Cu Pb
RMA
(µg/kg/day) Equation
RMA
(µg/kg/day) Equation
1 30 – 50 5 2
y 0.089x
3.8
R 0.982
p 0.018
0.8 0.2 <sub>y </sub><sub></sub>
0.002x +
0.8
R 0.943
p 0.056
2 60 – 100 10 1 1.1 0.3
3 100 – 300 14 3 1.5 0.2
4 200 – 600 21 4 1.7 0.4
</div>
<span class='text_page_counter'>(22)</span><div class='page_container' data-page=22>
<i><b>Table 3.27. Linear correlation between the metal concentrations in the bivalves and the metal concentrations added to the </b></i>
containers, and exposure time (*)
Factor Cu Pb
Equation R P Equation R P
Correlation between the metal
concentrations in the bivalves
(y) and the concentrations
added in containers (x) for
exposure days
7 days y = 0.969x + 596(*) 0.999 0.01 y = 0.002x + 25.94 0.034 0.81
14 days y = 1.055x +
692(*) 0.994 0.07
y = 0.038x +
24.83 0.915 0.04
21 days y = 2.194x + 711 0.933 0.03 y = 0.035x +
43.46 0.731 0.14
28 days y = 2.381x + 719 0.955 0.02 y = 0.046x +
46.56 0.881 0.06
Correlation between the metal
<i>concentrations in the bivalves </i>
(y) and exposure time for the
metal levels added in the
containers
M1-30-50 y = 5.536x + 613 0.784 0.11 y = 1.160x + 12.20 0.894 0.05
M2-60-100 y = 10.91x + 594 0.963 0.02 y= 1.316x + 17.41 0.882 0.06
M3-100-300
y = 15.88x +
592.5 0.908 0.05
y = 1.893x +
15.23 0.953 0.02
M4-200-600
y = 24.59x +
525.1 0.930 0.03
y = 2.186x +
13.28 0.99 0.01
</div>
<span class='text_page_counter'>(23)</span><div class='page_container' data-page=23>
The results showed that: i) Increase in the metal levels added to the
containers (or increase of the metal pollution) led to increars of the
<i>RMA. The RMA for Cu in M. lyrata (after 28 days of exposure) was </i>
greater 7 – 12 times than that of Pb for all the metal levels added to
the culture container, although Cu levels added were lower than the
Pb levels; ii) Between the RMA (y) and the metal concentrations
added to the containers (x), there was also strong linear correlation
with R 0.94 (p 0.05).
<i> This once again proves that M. lyrata could be used as </i>
bio-indicator for the Cu, Pb pollution in the aquatic environment of Tien
estuary.
<b>CONCLUSION </b>
<i><b>On the basis of the results of this research, it can be concluded </b></i>
<i><b>that: </b></i>
1) Preliminary analysis of toxic metals content (Cd, As, Pb,
Ni, Cr, Cu, Zn, Fe and Mn) in the water of Tien River and Tien
Estuary was conducted. The pollution of river with Fe led to an
increase in the Fe pollution of estuary.
2) The total metal concentrations in the sediment met the
requirements of the National Technical Regulation on
Saline/Brackish Water Sediment Quality (QCVN 43:2012/BTNMT).
The Igeo and EF factor indicated that sediment of Tien estuary was
polluted with As.
3) The speciation of seven toxic metals (Cd, As, Pb, Ni, Cr, Cu
and Zn) and risk assessment of them to environment and organism
were determined for the first time in the Tien estuary sediment.
<i>4) The metal concentrations in the Meretrix lyrata met the </i>
requirements of the regulations of Vietnam and several of
international organizations. There was no linear relationship between
<i>the concentrations of toxic metals in the Meretrix lyrata tissues and </i>
the sediments. There was linear correlation between the metal levels
<i>accumulated in the Meretrix lyrata and the mobile metal levels in the </i>
sediment.
<i>5) The Cu and Pb levels accumulated in the calm Meretrix </i>
</div>
<span class='text_page_counter'>(24)</span><div class='page_container' data-page=24>
metal in the estuary water and water-sediment were determined for
the first time. There were strong correlations between the metal
contents (Cu, Pb) in the clam and exposure times or the dissolved
metal concentrations; between RMA and metal contents in the
environment of experiment. The results obtained indicate that the
<i>Meretrix lyrata can be used as bioindicator of the metal pollution in </i>
</div>
<span class='text_page_counter'>(25)</span><div class='page_container' data-page=25>
<b>LIST OF PUBLICATIONS </b>
1. Nguyen Van Hop, Hoang Thi Quynh Dieu, Nguyen Hai Phong
(2017). Metal speciation in sediment and bioaccumulation in
<i>Meretrix lyrata in the Tien Estuary in Vietnam, Environmental </i>
<i>Monitoring and Assessment, 189(6), pp. 299. DOI: </i>
10.1007/s10661-017-5995-2. PubMed-ID: 28553695.
2. Hoang Thi Quynh Dieu, Nguyen Van Hop, Nguyen Hai Phong
(2017). Contents of the toxic metals in the sediment and their
bioaccumulation in Meretrix lyrata cultured in Tien estuary area,
<i>Tien Giang Provine, Conference proceeding, The 5th Analytical </i>
<i>Vietnam Conference 2017, pp. 76 – 83. </i>
3. Hoang Thi Quynh Dieu, Nguyen Van Hop, Nguyen Hai Phong
(2017). Bioaccumulation of copper and lead by bivalve Meretrix
<i>lyrata cultured in water–sediment environment, Journal of Analytical </i>
<i>Sciences (Vietnam Analytical Sciences Society), 22(2), pp. 146 - 152 </i>
4. Hoàng Thị Quỳnh Diệu, Nguyễn Hải Phong, Nguyễn Văn Hợp
<i>(2016). Nghiên cứu đánh giá chất lượng nước sông Tiền, Tạp chí </i>
<i>Phân tích Hóa Lý Sinh (Hội KHKT Phân tích Hóa, Lý& Sinh học </i>
<i>VN), 21(1), tr. 38 - 48. </i>
5. Hoàng Thị Quỳnh Diệu, Nguyễn Văn Hợp, Nguyễn Hải Phong
(2017). Tích lũy sinh học đồng và chì bởi nghêu (Meretrix lyrata):
Nghiên cứu trường hợp đối với nghêu lấy từ vùng nuôi ở cửa sông
<i>Tiền, tỉnh Tiền Giang, Tạp chí Khoa học - Khoa học Tự nhiên, Đại </i>
<i>học Huế, 126(1A), tr. 31 – 40. </i>
6. Hoàng Thị Quỳnh Diệu, Nguyễn Văn Hợp, Lê Thị Ngọc
Thảo, Nguyễn Hải Phong (2017). Nghiên cứu đánh giá chất lượng
<i>nước vùng cửa sông Tiền, tỉnh Tiền Giang, Tạp chí Khoa học và </i>
</div>
<!--links-->
Nghiên cứu xác định một số kim loại trong nguồn nước sinh hoạt ở khu vực xã thạch sơn lâm thao phú thọ
- 14
- 559
- 0


.push({});</script> </div> </div> </div> <div class="vf_link_relate px-2 my-2"> <h2 class="vf_doc_relate text-2xl font-bold my-4">Tài liệu liên quan</h2> <ul class="grid grid-cols-12 gap-2"> <li class="col-span-6 md:col-span-2"> <div class="card-doc " onclick="actionDocRelated(this)"> <a class="card-doc-img" href="https://text.123docz.net/document/1030686-nghien-cuu-xac-dinh-mot-so-kim-loai-trong-nguon-nuoc-sinh-hoat-o-khu-vuc-xa-thach-son-lam-thao-phu-tho.htm" title="Nghiên cứu xác định một số kim loại trong nguồn nước sinh hoạt ở khu vực xã thạch sơn lâm thao phú thọ"> <i class="icon i_type_doc i_type_doc2"></i> <img class="lazy" src="data:image/gif;base64,R0lGODlhAQABAIAAAP///wAAACH5BAEAAAAALAAAAAABAAEAAAICRAEAOw==" data-src="https://media.store123doc.com/images/document/14/br/ap/medium_4mveN8j8ed.jpg" width="124" height="179" alt="Nghiên cứu xác định một số kim loại trong nguồn nước sinh hoạt ở khu vực xã thạch sơn lâm thao phú thọ" onerror="this.src=)