A study on the applicability of mobility management to change the behavior of private mode use in asian developing countries
Bạn đang xem bản rút gọn của tài liệu. Xem và tải ngay bản đầy đủ của tài liệu tại đây (2.61 MB, 129 trang )
A Study on the Applicability of Mobility Management
to Change the Behavior of Private Mode Use in Asian
Developing Countries
(アジア開発途上国におけるモビリティ・マネジメントの適用可能性について
の研究)
by
Hong Tan Van
Master of Civil Engineering, Tokyo Institute of Technology, 2004
Bachelor of Civil Engineering, Ho Chi Minh City University of Technology, 2002
Submitted to the Department of Civil and Environmental Engineering
in partial fulfillment of the requirements for the degree of
Doctor of Engineering
in
Civil Engineering
at the
Tokyo Institute of Technology
Examination Committee
Prof. Satoshi Fujii (Chairman)
Prof. Tetsuo Yai
Assoc. Prof. Daisuke Fukuda
Assoc. Prof. Shinya Hanaoka
Assoc. Prof. Jan-Dirk Schmưcker
February, 2009
© 2009 Tokyo Institute of Technology - All rights reserved
i
A Study on the Applicability of Mobility Management
to Change the Behavior of Private Mode Use in Asian
Developing Countries
by
Hong Tan Van
Abstract
The objective of this thesis was to investigate the applicability of psychological
approaches such as mobility management that can induce a behavioral change from
private mode usage toward public transport in Asian developing countries. In the
study, the results of comprehensive investigations in two Asian cities, Bangkok and
Ho Chi Minh City (HCMC), demonstrated that mobility management has potential to
be applied to change the behavior of private mode use toward more use of public
transport. Specifically:
In Bangkok, the study found that mobility management communication measures had
the potential to induce up to 37% of Bangkok car users who commute to Commercial
Business Districts to change to use rail and 29% of them to change to use bus. It was
also found that the most three important conditions that public transport service needs
to improve to meet the requirement of car users were availability, low ticket cost and
access comfort for the rail; and speed, reliability and comfort for the bus. The 8%
greater potential for the rail than the bus means that communication mobility
management to persuade car users to commute by rail would have bigger possibility
to success. However at the same time, the study found that for around 32% of people
in Bangkok, it is totally impossible to use the rail, 13% higher than the bus. These two
factors imply that an expansion of rail service would increase more potential for the
success of mobility management measures.
Investigating the psychological structure of car drivers in Bangkok regarding car use
reduction and public transport use, the Structural Equation Model analysis of the
psychological structure based on the Theory of Planned Behavior (TPB) yielded the
results that nearly all of the TPB constructs (attitude, subjective norm, perceived
behavioral control, and moral obligation) contributed in significant proportion to the
intention variances. The study also found that the intention to reduce car use was a
precedent factor to the intention to use the bus and the rail. Such findings indicate that
for those car users belonging to high potential group, communication mobility
management to impact on significant psychological factors could induce them to shift
to use public transport.
Besides, the study performed a pilot test of mobility management measures on
transport planners. Three testing methods were applied to increase the understanding
of local transport officials about Bus Rapid Transit (BRT) as well as changing their
attitudes toward the implementation of BRT in their city. Two methods were found to
increase the planners’ inclination to implement BRT including information provision
and behavior plan method. Another method that provided detailed information on
ii
using and operating a model BRT system appeared to increase the feeling of
“obligation” of the planners to develop a BRT system for their countries. The
combination of these methods would be an effective way to change attitudes of
transport planners in developing countries toward promoting sustainable transport
modes.
In Ho Chi Minh City, the study found that mobility management communication
measures had the potential to induce a maximum of 40–50% of motorcycle users in
HCMC to change their modes of transportation. The potential for changes depended
on the length and the nature of the trips. Regardless of the trip purpose, long trips by
motorcycle have ~10% greater potential to be switched to the bus compared to short
trips. Regardless of trip length, non-work/school trips also have ~10% greater
potential to change than work/school trips. This means that communication mobility
management targeted at long, non-work/school trips would have the biggest potential
payoff of modal shift from motorcycle to bus.
Investigating the relationships among psychological constructs based on TPB, we
found that TPB has potential for predicting the behavioral intention of mode choice in
HCMC. Besides, from a set of psychological factors related to various aspects of bus
use, the study found four underlying factors including moral concerns, negative
experiences, quality of service, and social status. The regression of the intention on
these four factors revealed that moral concerns and the quality of bus service are
determinants of intention to use the bus in HCMC. Thus, efforts to make bus service
in HCMC more attractive to motorcycle users would consequently increase patronage
for the bus. The significance of the factor of moral concerns indicates that a
communicative mobility management measure that tries to activate moral obligation
regarding socially desirable travel behavior could be expected to have potential for
convincing people to use the bus in HCMC. Accordingly, increasing the behavioral
intention to use the bus in HCMC can be achieved by enhancing the public’s
awareness of the benefits of bus use toward improving the environment and mobility
for society and by making people feel “morally responsible” to cooperate in solving
the current traffic situation. This would be a very important mission, not only for
transportation planners, but for the public in general.
This study laid an important foundation for further steps in testing and implementing
mobility management in Bangkok and HCMC. Note that these findings may not be
limited to these two cities, but should be considered the framework for developing
mobility management measures for other developing countries having similar
characteristics.
iii
Acknowledgments
Most of all, I want express my deep gratitude to my advisor, Professor Satoshi
Fujii for his devoted guidance and thoughtful advices throughout the period of my
graduate study at Tokyo Institute of Technology. Appreciation is also owed to
Professor Tetsuo Yai, Assoc. Professor Daisuke Fukuda, Assoc. Professor Shinya
Hanaoka and Visiting Assoc. Professor Jan-Dirk Schmöcker, who have served on the
review committee of this thesis. Besides, I want to express my gratitude to Dr. Kasem
Choocharukul for his support and senior advices.
I would like to thank Professor Atsushi Fukuda (at Nihon University), Mr. Oravit
Hemachudha
(Director
of
Transport
Division,
BMA),
Mr.
Surawongse
Swangbamrung (BMA), Dr. Tuenjai Fukuda, Mr. Ryosuke Oshima, and Mr. Atit
Tippichai and the International Association for Traffic Safety Sciences (IATSS) for
their organization of the workshops in Bangkok and great supports on the collection
of data in my thesis.
I am really grateful to the Japanese Ministry of Education, Culture, Sports,
Science and Technology (Monbukagakusho) who grant me the scholarship for my
study in Japan.
I also thank all my friends, colleagues and fellow students at Tokyo Institute of
Technology for their friendships and kind supports during my nearly-five years of
studying.
Finally, I would like to greatly thank my parents and my brother for their deep
love and continuous encouragement.
iv
Contents
Title Paper ..................................................................................................................... ....i
Abstract ............................................................................................................................ ii
Acknowledgements...................................................................................................... ....iv
Contents ........................................................................................................................... v
List of Figures ............................................................................................................... viii
List of Tables .................................................................................................................. ix
Chapter 1 – Introduction ....................................................................................... 1
1.1. Background ............................................................................................................... 1
1.1.1. Rapid urbanization in Asian developing countries ....................................... 1
1.1.2. Motorization in Asian developing countries and consequences ................... 2
1.1.3. Trends in urban transport development in Asian developing countries ....... 5
1.1.4. Measures to manage travel demand ............................................................. 6
1.2. Literature review of mobility management ............................................................... 7
1.2.1. Theoretical background of mobility management ........................................ 7
1.2.2. Definition of mobility management ............................................................. 8
1.2.3. The roles of mobility management as a psychological approach in
changing behavior .................................................................................................. 9
1.2.4. Types of mobility management .................................................................. 10
1.2.5. Overview of mobility management schemes in developed countries ........ 11
1.2.6. The effectiveness and benefits of practical mobility management ............ 13
1.2.7. Mobility management in Asian developing countries – Why not? ............ 14
1.2.8 Fundamentals prior to applying mobility management................................ 15
1.3. Thesis objective and scope ...................................................................................... 16
1.4. Structure of the thesis .............................................................................................. 17
Chapter 2 - Overview of the case study cities ............................................... 19
2.1. Rationale for choosing the case study cities ........................................................... 19
2.2. Bangkok .................................................................................................................. 19
2.2.1. Social economic characteristics .................................................................. 19
2.2.2. Infrastructure and Transportation ............................................................... 21
2.2.3. Traffic problems in the city center of Bangkok........................................... 23
2.3. Ho Chi Minh City ................................................................................................... 26
2.3.1. Social economic characteristics .................................................................. 26
2.3.2. Infrastructure and Transportation ............................................................... 27
2.3.3. The seriousness of traffic condition in near future in Ho Chi Minh City
as car use increases ............................................................................................... 30
2.3.3.1. Method ........................................................................................... 31
2.3.3.2. Analysis results .............................................................................. 34
2.3.3.3. Discussion ...................................................................................... 36
2.4. Conclusions ............................................................................................................. 37
v
Chapter 3 - Potential of behavioral change toward using public
transportation of car users in Bangkok .......................................................... 39
3.1. Introduction ............................................................................................................. 39
3.2. Method .................................................................................................................... 40
3.2.1. Sampling ..................................................................................................... 40
3.2.2. Questionnaire .............................................................................................. 41
3.3. Results ..................................................................................................................... 42
3.2.1. Potential for inducing car commuters to use rail ........................................ 42
3.3.2. Potential for inducing car commuters to use bus ........................................ 43
3.3.3. Reasons to use bus or rail ........................................................................... 43
3.3.4. Knowledge about bus and rail .................................................................... 44
3.4. Discussion ............................................................................................................... 46
3.5. Conclusion .............................................................................................................. 48
Chapter 4 - Potential of behavioral change toward using public
transportation of motorcycle users in Ho Chi Minh City ........................ 49
4.1. Introduction ............................................................................................................. 49
4.2. Method .................................................................................................................... 50
4.2.1. Sampling ..................................................................................................... 50
4.2.2. Questionnaire .............................................................................................. 51
4.3. Results ..................................................................................................................... 52
4.3.1. Breakdown of trips by purpose .................................................................. 53
4.3.2. Potential for inducing motorcycle users to use the bus .............................. 53
4.3.3. Comparison of work/school trips and trips for other purposes .................. 54
4.3.4. Respondents’ knowledge about the bus as an alternative mode ................. 56
4.4. Discussion ............................................................................................................... 58
4.5. Comparison of the results to those in Bangkok ...................................................... 59
4.6. Conclusion .............................................................................................................. 60
Chapter 5 - Applicability of mobility management in Bangkok ............ 61
5.1. Background ............................................................................................................. 61
5.2. Method .................................................................................................................... 62
5.3. Results ..................................................................................................................... 64
5.3.1. The model of car use reduction .................................................................. 65
5.3.2. The models of rail use and bus use ............................................................. 65
5.4. Discussion ............................................................................................................... 66
5.5. Conclusion .............................................................................................................. 66
Chapter 6 - Applicability of mobility management in Ho Chi Minh
City ............................................................................................................................... 68
6.1. The study on theory of planned behavior & its applicability to behavioral
intention to travel mode use ........................................................................................... 68
6.1.1. Method ........................................................................................................ 69
6.1.2. Analysis ...................................................................................................... 70
6.1.2.1. Attitudinal factors .......................................................................... 70
6.1.2.2. Structural equation modeling ......................................................... 72
6.1.3. Discussion .................................................................................................. 74
6.2. The study on the determinants of behavioral intention to use bus .......................... 75
6.2.1. Background ................................................................................................ 75
vi
6.2.2. Method ........................................................................................................ 77
6.2.2.1. Sample ............................................................................................ 77
6.2.2.2. Measurement .................................................................................. 77
6.2.3. Results ........................................................................................................ 78
6.2.3.1. Principal Components Analysis ..................................................... 79
6.2.3.2. Regression analysis ........................................................................ 80
6.2.4. Discussion .................................................................................................. 81
6.3. Conclusion .............................................................................................................. 83
Chapter 7 - Applicability of mobility management for transport
planners ...................................................................................................................... 84
7.1. Introduction............................................................................................................. 84
7.2. Method .................................................................................................................... 86
7.3. Results ..................................................................................................................... 89
7.3.1. Effects of informing the planners of public attitudes and perceptions of
BRT ...................................................................................................................... 90
7.3.2. Effects of providing detailed information about the use and operating
practices of model BRT systems .......................................................................... 91
7.3.3. Effects of planning and drawing BRT routes on a city map ...................... 91
7.4. Discussion ............................................................................................................... 91
7.5. Conclusion and recommendations .......................................................................... 92
Chapter 8 - Conclusions ....................................................................................... 94
8.1. Summary ................................................................................................................. 94
8.1.1. The transport problems of Asian developing countries .............................. 94
8.1.2. The necessity of managing travel demand ................................................. 95
8.1.3. The potential of behavior change ............................................................... 95
8.1.4. The applicability of mobility management ................................................. 96
8.2. Thesis contributions ................................................................................................ 97
8.3. Limitations and furthers studies .............................................................................. 98
References ................................................................................................................ 101
Appendices .............................................................................................................. 112
vii
List of Figures
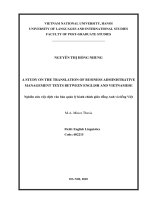
Fig. 1.1: Urban population in selected Asian cities from 1990 to present ....................... 1
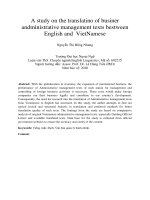
Fig. 1.2: Relationship between car ownership and GDP per capita for Asian Pacific
cities .................................................................................................................. 3
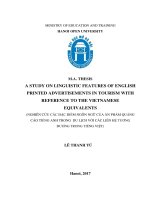
Fig. 1.3: The process of behavior change and the role of mobility management on
behavior change process ................................................................................... 8
Fig 1.4: Thesis’s structure .............................................................................................. 18
Fig. 2.1: Illustration of urban expansion in Bangkok from 1958 to 2000 ..................... 20
Fig. 2.2: Map of Bangkok’s population density in 2001 ............................................... 21
Fig. 2.3: Registered four wheel vehicles in Bangkok .................................................... 22
Fig. 2.4: Present traffic speed in Bangkok ..................................................................... 24
Fig. 2.5: Location of frequently congested intersections in Bangkok ........................... 24
Fig. 2.6: Predicted traffic situation in Bangkok in 2021 ................................................ 25
Fig. 2.7: Ho Chi Minh City’s population ....................................................................... 26
Fig. 2.8: Map of Ho Chi Minh City’s population density in 2001 ................................ 27
Fig. 2.9: Average travel speeds during evening peak hour in 2002 and 2008 present ... 28
Fig. 2.10: Four-wheel vehicle ownership in Ho Chi Minh City .................................... 28
Fig. 2.11: The relationships between GDP per capital and 4-wheel vehicle
ownership in Bangkok and in HCMC .......................................................... 29
Fig. 2.12: Layout view of the modeled corridor and its branches ................................. 32
Fig. 2.13: Average travel speed and percentage of congested part if motorcycle
users shift to car use ..................................................................................... 34
Fig. 2.14: Average travel speed and percentage of congested part if bus use
increases under condition that car share becomes 40% and 60% ................ 36
Fig. 3.1: Potential of bus use and rail use by car users .................................................. 43
Fig. 3.2: The two most important reasons for the respondents to choose to use rail ..... 44
Fig. 3.3: The two most important reasons for the respondents to choose to use bus .... 44
Fig. 4.1: Evaluation of travel time by mode .................................................................. 51
Fig. 4.2: Breakdown of trips by purpose ....................................................................... 53
Fig. 4.3: Potential bus use by motorcycle users ............................................................. 53
Fig. 4.4: Comparison of the possibility for using the bus for different trip types ......... 54
Fig. 4.5: Reasons for respondents to choose the bus ..................................................... 56
Fig. 4.6: Comparison of the possibility for using the bus and using the rail of
commuters in Bangkok and HCMC ............................................................... 60
Fig. 6.1: Comparison of the mean scores for three aspects of attitudes across six
travel modes .................................................................................................... 72
Fig. 6.2: Hypothetical structure based on the Theory of Planned Behavior .................. 73
Fig. 7.1: Results of the attitudes of the public from the first workshop, presented to
transport professionals in Bangkok ................................................................ 88
viii
List of Tables
Table 3.1: Characteristics of survey respondents........................................................... 41
Table 3.2: Percentage of respondents knowing about train/bus route attributes ........... 45
Table 4.1: Characteristics of survey respondents .......................................................... 50
Table 4.2: Percentage of respondents knowing about bus route attributes ................... 57
Table 5.1: Means and Standard deviation of psychological variables .......................... 63
Table 5.2: Estimate results of linear regression of behavioral intention to reduce
car use, behavioral to use the rail and behavioral to use the bus ................. 64
Table 6.1: Rotated factor loadings of beliefs for six travel modes ............................... 71
Table 6.2: Means and standard deviations of psychological factors by mode .............. 71
Table 6.3: Standardized coefficients of causal paths and dummy variables
estimated in structural equations model analysis of behavioral intentions
to use a travel mode ..................................................................................... 74
Table 6.4: Attitudinal factors toward bus service and negative critical incidents ......... 77
Table 6.5: Distribution of the dependent variable ......................................................... 78
Table 6.6: Correlations and simple regression analysis of intention to use the bus
on perceptions about quality of bus service.................................................. 79
Table 6.7: Rotated factor loadings of perceptions about bus service by principal
components analysis .................................................................................... 79
Table 6.8: Estimation results of ordered logistic regression of behavioral intention
to use the bus ................................................................................................ 80
Table 7.1: Descriptive statistics of the participants in the experiments ........................ 87
Table 7.2: Beliefs and the questions used in the questionnaires for two experiments
and two subject groups ................................................................................. 87
Table 7.3: Mean scores (standard deviation) and t-test results of the beliefs of
transport professionals about the implementation and use of BRT
between phases of experiments in Bangkok ................................................ 90
ix
Chapter 1
Introduction
1.1. Background
1.1.1. Rapid urbanization in Asian developing countries
Cities in Asian developing countries have undergone rapid population growth. In
recent years, the rates have accelerated faster than before partly due to economic
growth, especially in Asia. As can be seen in Figure 1, populations of large cities in
Asia have been rising upward rapidly for the recent 20 years. In 2005, Asia alone had
11 mega-cities, those with 10 million or more, for example Jakarta (24.9 million),
Shanghai (17.2 million), Beijing (14.3 million), Manila (11.5 million), Bangkok (10.2
mil) etc. It is estimated by UN (2002) that 13 out of 21 mega-cities will be in Asia by
2015. Except for Tokyo and Osaka, the remains are located in developing countries.
Still, there has been warning that in this region, fast population growth may not occur
in large urban agglomerations but the fastest growing cities are those having smaller
populations. This is because the growth rate of a city’s population tends to be slowed
down as the population size increases. Therefore, population growth together with its
problems would be potentially large in other smaller urban areas within the next few
years. It is therefore predicted that by 2015, there will be 258 cities in Asia with a
population of over one million (UN, 2002).
Population (thousand)
30,000
Beijing
25,000
Manila
Taipei
20,000
Jakarta
Bangkok
15,000
Kuala Lumpur
Tianjin
10,000
Shanghai
HCM City
5,000
0
1990
1995
Year
2000
2005
Fig. 1.1: Urban population in selected Asian cities from 1990 to present
Note: Data is derived from a variety of sources. Except for HCMC, populations of all others are in metropolitan area.
1
Note that this high increase in urban population was mostly because of migration
from the rural rather than natural factors because government in most Asian countries
have had policy to control high birth rate. Such migrations have led to population
increase and occupational change in zones immediately outside the metropolitan area
(Jones, 2002). The extension of urban areas was therefore exaggerated. Consequently
changing of land use from “agricultural” to “residential” and “industrial” purpose in
these areas has generated dramatically changes in transportation, and thus induced
greater population mobility.
Even though many people in the former rural and suburban areas are gaining certain
benefits from urbanization, many other people are still faced with difficulties when
their living places were changed to urbanized areas. Thus, urbanization may enlarge
the social gap between those who could benefit from infrastructure building and those
who do not. Besides, due to the expansion of the urban areas to accommodate for
living place of more people, many transport problems have emerged. In terms of land
use, the sprawling development makes it impossible to maintain accessibility to public
transportation service for the newly urbanized areas. Moreover, travel demand will
increase when economic growth generates more new employment opportunities. Thus
more transport infrastructure need to be built to respond to those increasing demand.
The increase of income due to economic growth combining with the increase of travel
demand would lead to an increase of private mode use, in other words, a phenomenon
called motorization would occur.
1.1.2. Motorization in Asian developing countries and consequences
As a corollary of rapid urbanization, motorization has been virtually speeding up,
especially in developing countries. The car ownership rates presently are dramatically
increasing in many Asian developing cities (Morichi, 2005; Hayashi et al., 2004) than
in other developing regions due to comparatively higher economic growth. For
instance, in Beijing alone, the number of cars increased by 11% annually from 2000
to 2006 (Ma, et al., 2007). In Manila, by 2002 approximately 20% of the Metro
Manila households had private car. Noticeably, Bangkok, Jakarta and Kuala Lumpur
were known to have particularly high jump in car ownership rate. From 1985 to 2002,
car ownership in Jakarta increased approximately three times (Susilo et al., 2007)
while Kuala Lumpur also had very high proportion of car ownership of 58% as of
2003. Meanwhile, in Bangkok between 1985 and 1990 the vehicle fleet grew by 3040%. With such a trend, car ownership rates in these exemplified cities possibly will
soon reach the level of US cities.
Additionally, there is a remarkable variation in motorization patterns across
developing countries due to different levels of development and transport policies in
the past (Sperling and Clausen, 2002; Gakenheimer and Zegras, 2004). In some cities,
shares of motorcycles are quite minor while in some other cities, especially in Asia
and the Pacific region, motorcycles are so prevalent. Ho Chi Minh City is typical of
the so-called ‘cheap’ motorization as motorcycle is a dominant mode accounting for
nearly 90% of vehicle ownership. Similarly, in Khon Kaen and Chiang Mai of
Thailand, in Chennai and Delhi of India and in Wuhan of China, two-wheelers
account for around 65 to 95% of the total vehicles. Kuala Lumpur by 2003
motorcycles comprised around 40% of the city’s vehicle fleet. Jakarta also witnessed
a rapid increase of motorcycles in recent years.
2
The key factor influencing the motorization trend is level of per capita income. It is
inferred that motorization of car could follow a ‘stylized S- curve’ showing
relationship between GPD per capita and car ownership per 1000 population (Dargay
and Gately, 1999; Zegras and Gakenheimer, 2006). This relationship was verified
using data of some cities in Asian Pacific regions, as can see in Figure 1.2. Besides,
Vasconcellos (2001) speculated that per capital income of $US 5,000 could be the
threshold at which car ownership sharply increase. In the developing world, the
majority of the cities are still below this level, Bangkok was said to be already above
this threshold level while cities such as Delhi, Jakarta, Manila, and HCMC etc. will be
approaching this critical level soon. In general, Sperling and Salon (2002)
summarized this as followed: “At a low level of income, people generally take public
transport or use some form of non-motorized transport. At a middle income level, a
group emerges that spends a substantial percentage of their travel time in jitney or
motorcycles. At a high level of income, a large percentage of trips are made in private
cars”. Literatures also mentioned other factors such as public policy and investment
can influence the motorization.
Cars per 1000 people
350
300
Bangkok(07)
Kuala Lumpur(00)
Taipei(05)
Bangkok(03)
Kuala Lumpur(95)
Bangkok(94)
250
200
150
Beijing(02)
100
50
Beijing(06)
HCMC(07)
0 HCMC(00)
1000
Manila(96)
Shanghai(02)
Tianjin(02)
10000
GDP per capita USD
10000
Fig. 1.2: Relationship between car ownership and GDP per capita for Asian Pacific
cities (Remember to note the log scale)
Note: Data derived from various sources.
The horizontal axis is in logarithm scale
In developing countries, at the early stage of urbanization, the increase of motor
vehicles had been a revolution to transportation when it helped reduce manual labor,
making the transportation of materials and products easier, faster and more convenient.
In many Asian countries such as China, India, Vietnam, Malaysia, Thailand etc.
motorcycles, are prevalent because with just an affordable price they could provide
flexibility, convenient movement in narrow roads. It should be recognized that trucks
and two wheelers had provided mobility and opportunities for many people in
urbanizing areas during early stages of motorization process. However, the
proliferation of these two wheelers for personal use in several cities lurked many risks
to the development when more roads were built to accommodate for the movement of
such private modes. Here regarding the problem whether motorcycle use is merely
transition step to car use, it should alerted that, the contribution of motorcycles could
aggravate the negative impacts of motorization since motorcycles may keep
increasing even after car ownership rate is high, as can be seen from the case of
Taipei.
3
The disadvantages of motorization are however much larger than its advantages. The
most noticeable consequence is tremendous traffic jams. The increasing number of
personal-transportation vehicles boosted up the needs for roadways; however, budgets
of developing countries for building and widening infrastructure could not response to
such a high demand. At present many cities in developing countries now experience
far worse traffic congestion than what happened in cities of developed world (Lu and
Yin, 1997; Sperling and Claussen, 2002) even though car ownership level (cars/1000
populations) in developing countries is substantially lower, i.e. 30 compared to 200 in
developed cities. The low level of infrastructure is certainly a significant factor
explaining this issue. For example, UITP (2001) reported that average traffic speeds
in downtown of Bangkok, Manila, Jakarta, Shanghai were around 15-20 km/h, which
meant that the speeds during peak hour were even worse (Morichi, 2005).
Besides traffic congestion, environmental pollution and global warming are other
adverse effects of motorization. Emission from motorized vehicles has become a
subject of growing environmental concern. Recent estimates by World Bank (2002)
showed that the total economic damage due to air pollution reached up to 10% of
GDP in Bangkok, Kuala Lumpur and Jakarta. Average pollutants emissions from
urban transport systems, for example CO emissions, were reported as high as 2420
ton/day in Jakarta, 1485 ton/day in Manila, 324 ton/day in Beijing (Shrestha et al.
2002). Shrestha et al. (2002) also estimated that annual growth rates of CO2 emission
during 1998-2020 of some developing mega-cities in Asia would be high. Such huge
amounts of toxic emissions have cumulatively contributed to devastate human living
environment.
Losses due to traffic congestion, air and noise pollution are not only money and time
but also people’s health. The consequences of motorization therefore may have very
significant impacts on the income of a developing country. In Ho Chi Minh City
(HCMC), Vietnam, for example, the estimated losses due to congestion may reach a
level of one billion US dollars per year, i.e., 7% of the city’s gross domestic product
(HCMC Department of Transport, 2007b). With such a trend as presented above, it
should be alarming that congestion in developing countries would be more severe in
the coming years.
High motorization would lead to intensive consumption of oil resource since motor
vehicles are the largest consumers of oil with an estimation that about 60.3% oil
energy consumption in 2005 globally is for transportation (International Energy
Agency, 2007). Increase of fuel consumption was caused by not only the increase of
trips and travel distance when people get more freedom from using private modes but
also the waste of fuel burned during congestion. Thus, high use of petroleum for
private transportation under congested condition apparently is not a wise use of
energy for transportation.
The upward leap of motor vehicle ownership in many countries has caused the
reduction of the demand of public transport as transit would become more and more
inconvenient compared to private modes (Mohamad and Kiggundu, 2007). Besides,
proliferation of the low cost motorcycles encourages an early shift from buses to
motorized personal travel, like the condition in Ho Chi Minh City, Vietnam.
Moreover, people who were using other sustainable transportation modes such as
cycling and walking may choose not to use such modes since they feel more
4
dangerous when motor vehicles are more present on their way. The congestion due to
excessive use of private motorized vehicles increases the operation cost of road-based
public transport and the travel time of public modes. This condition has led to the
decrease of quality of the bus, the affordable mode of transportation for the majority
of low-income people (Sohaila et al., 2004)
In fact, high level of motorization, at which private modes users excessively exploit
the right to use road, has led to a phenomenon called ‘resource dilemma’ (Platt, 1973;
Biel and Gärling, 1995), a common type of social dilemma. This is a situation in
which at short term, private mode user individually gains but after long term, their
defective and ‘overusing’ behaviors would cause great losses to all users of the
transport system. In developing countries, people’s awareness of cooperation is
considered low while the ‘resource’ is much smaller than those of developed countries.
As a result, the eventual state that the whole community encounters lost, i.e. heavy
congestion, pollution etc. will reach faster.
As discussed, those negative consequences of motorization, i.e. congestion, pollution,
inefficient energy use, undermining environmental-friendly transport modes, and
social inequity have very pronounced effects on various aspects of Asian developing
societies. In conclusion, the way toward high motorization is not the way to
sustainability for developing countries. Therefore, it would be the right way if
transport planners in Asian developing countries could fully control motorization by
either stopping or slowing it down. However, the present situation and the trend in the
near future seem not to exactly be on this direction.
1.1.3. Trends in urban transport development in Asian developing
countries
There has been growing interests by governments in Asian developing countries in
building rail-based transit systems to respond to the shortage of capacity of road
systems. Metro projects have been studied or implemented in several large cities, for
example Bangkok (Thailand), Mumbai (India), Kuala Lumpur (Malaysia), Manila,
Guangzhou, Tianjin (China), Jakarta, Bangdung (Indonesia), Hanoi, Ho Chi Minh
City (Vietnam). However, due to the requirement of large investments, these projects
have taken much longer time than expected to be put into operation. Besides, many of
them reach an impasse because of no fund available.
Another trend is the attention to improving the quality of bus service. In some cities
like HCMC or Hanoi, recently major investments have been put to developing bus
fleet or expanding bus network. Some other cities already having bus service
available such as Bangkok, Kuala Lumpur, Shanghai, and Shenzhen have introduced
higher-quality buses on their roads. Besides, Bus Rapid Transit (BRT) projects have
been initiated in several countries including Thailand, Philippines, Indonesia, China,
Vietnam etc. Among them, Jakarta and Beijing could be considered the two
successful examples in implementing BRT (Matsumoto, 2003; Hook and Ernst, 2005).
However, through the situations of low bus use in many Asian developing countries
and few BRT routes having been implemented so far, it seems that governments in
many countries are not keen on a policy to make bus a backbone public transport
mode.
5
Meanwhile, amid rapid motorization, an apparent trend that now can be seen in many
countries is building more roads in response to the demand. From the view point that
infrastructures in many cities are still far below the requirement, the intensive
infrastructure building could be a suitable policy. However, the major concern is that
building more roads in many cities do not go together with managing travel demand.
Such trends would deepen the social gap by generating more social inequity since the
majority poor people cannot afford private vehicles while the minority of wealthy car
users benefit from massive budgets on roadway construction. Hook and Replogle
(1996) stated that policies adopted across much of Asia are today promoting rapid
motorization and the destruction of economically and environmentally sustainable
low-cost non-motorized transportation modes. Moreover, just building more roads is
not a right way to deal with motorization because new roads will induce more traffic
(Hills, 1996). Acharya (2005) demonstrated that urban mobility measured in terms of
passenger-km per capita would increase in all metropolitan areas of developing
countries as people’s income increase. Therefore, it is indispensable to apply
measures to manage travel demand, simultaneously to building infrastructure and to
improving public transport.
1.1.4. Measures to manage travel demand
The problem that road capacity cannot keep pace with growing demand is most
serious in developing countries, and even in developed countries. Therefore, the
rational way is to use the transport infrastructure more efficiently. Accordingly, one
way is managing traffic, that is, to induce travelers to use other less congested routes
and times of the day. This way, e.g. using ITS, seems to be more suitable to
developed countries which have much better infrastructure and advanced technology
to control the traffic. The other way is to reduce the number of private vehicles using
the road network while increasing the ridership of public transport. This is changing
people’s travel behavior by using ‘structural strategies’ and/or psychological
strategies.
‘Structural strategies’ (Fujii et al., 2001a) are travel demand management (TDM)
schemes, e.g. system improvement, improving public transport, and other regulatory
measures. TDM measures which are based on regulatory or economic factors may
vary by the coerciveness (Loukopoulos et al, 2001; Litman, 2002), for example, from
restriction car use to road pricing, which is less coercive, to individualized marketing
which is more voluntary. Besides, those measures could also be classified in terms of
push measures that discourage car use and pull measures that encourage the use of
alternative modes (Steg and Vlek, 1997). Even though regulatory measures could
instantly reduce a certain amount of car use, it was said that coercive strategies may
result in negative effects and the change may be just instantaneous and people may
return to use private mode as their awareness and acceptance still has not been much
changed
Some Asian developing cities like Beijing, Bangkok, and Kuala Lumpur, have all
explored the possibilities of applying road and congestion pricing (Ma et al., 2007;
Bhattacharjee et al., 1997; Kasipillai and Chan, 2008). However, except for the clear
success of Singapore’s Pricing License Scheme (Seik, 1997), those ‘hard’ measures
like pricing and transportation capacity expansion might become more difficult to
implement because of low public acceptance and budgetary limitation.
6
On the other hand, psychological measures could induce behavior change through
modifying psychological factors such as beliefs, attitudes, problem awareness and
personal norms (Nordlund and Garvill, 2003). These ‘soft’ measures (hereafter
referred to as mobility management) are non-coercive and thus not politically difficult.
Moreover, they do not necessary require large financial investment in relation to their
positive outcomes in changing the behavior (EPPOM, 2008). This approach has been
developed since last decade mostly by researchers in Australia, Europe and Japan.
The next section will provide a detailed description about this approach.
1.2. Literature review of mobility management
1.2.1 Theoretical background of mobility management
Mobility management is a strategy that tries to yield voluntary behavioral change. So
the study of the applicability of this method needs to base on the science of behavior.
It is believed that human behaviors are generated from the influence of different
psychological factors via a complex cognition process. So far, there have been several
theories trying to explain behavior and how to change it. For example, selfdetermination theory, developed by Deci and Ryan (1985), focused on importance of
intrinsic motivation in driving human behavior. Self-efficacy theory (Bandura, 1986)
suggested that self-efficacy beliefs affect human functioning since people just act as
long as they perceive their actions can produce the desired outcomes. Exemplified
above are motivational theories, which identify the social factors that push people to
engage in activities.
Unlike these two motivational theories, Ajzen (1991) in the Theory of Planned
Behavior (TPB) proposed that behavior and its intention are determined by attitude
toward the behavior, the subjective norm (perceptions of social pressure to perform
the behavior) and perceived behavioral control (perception of the ease or difficulty of
performing the behavior). Other than motivational theory, the use and support for the
theory of planned behavior are widespread, with several meta-analyses and literature
reviews showing support for the general model (see Armitage and Conner, 2001;
Sutton, 1998). Besides, the general model has also been extended with additional
psychological mediators such as moral norm, awareness and perceived responsibility
that were assumed in the norm activation theory (Schwartz, 1977) to improve the
predictive power of the theory. Fujii (2003) further expanded the theory by proposing
that habit be another factor influencing behavior and implementation intention could
be a mediator between behavioral intention and behavior. The process of behavior
change is illustrated in Figure 1.3.
7
Fig. 1.3: The process of behavior change and the role of mobility management on
behavior change process
Mobility management methods have their roots in psychological theory. Primarily
they are based on the Theory of Planned Behavior and its extension as presented in
Figure 1.3. Based on the psychological structure, the factors that significantly
influence behavioral intention and/or behavior are targets for mobility management
measures such as communication and persuasion to make favorable changes in
behavior. Past studies have shown that psychological effects vary across different
groups of people and types of behavior (Armitage and Connor, 2001). Though it is
expected that the causal relationships between psychological factors in the structure
remain having same direction and sign in different populations, the significant
contribution of psychological factors in predicting intention and behavior may differ
across countries. In developed countries, the important role of psychological factor on
intentions and behavior has been verified; this led to the application of mobility
management in these cities. In developing countries, however, the behavioral
intention of travel-mode selection has not been well investigated, which has led to a
lack of basic understanding of applying any psychological measures to tackle
transportation problems. Therefore, understanding the psychological structure
regarding currently used travel modes in developing countries is a prerequisite to any
psychological approach.
1.2.2 Definition of mobility management
The basic idea of mobility management, as suggested by Atterbrand et al. (2005), was
a package of voluntary actions to reduce the dependency on private car and encourage
the use of other transport modes. The concept “mobility management” has therefore
been defined by several scholars in countries where mobility management has been
applied. As defined in the website of the Cities for Climate Protection Australia
Program, mobility management “actively supports and encourages people to use
sustainable transport. It is a demand-oriented approach to changing travel behavior in
favor of modes such as walking, cycling, car-pooling car-sharing and public
transport”. The European Platform on Mobility Management (EPOMM) gave a
similar definition of the common concept of mobility management: “A concept to
promote sustainable transport and to manage the demand for car use by changing
travelers’ attitudes and behavior. At the core of mobility management are "soft"
8
measures like information and communication, organizing services and coordinating
activities of different partners” (EPOMM, 2008).
Fujii (2005) after synthesizing the ideas from previous mobility management models
in Australia, Europe, and Japan defined that mobility management is a transport
management policy which tries to yield voluntary travel behavior change from car use
into sustainable travel mode (e.g. public transport, bicycle and walk) mainly by means
of communicative measures.
The term “mobility management” is therefore more narrowly focused on
psychological measures such as information, marketing, partnerships,
communications, and promotion of sustainable modes as used in Australia, Europe,
and Japan. Regarding this sense, mobility management in these countries might be
considered as a subset of measures within the broader U.S definition of transportation
demand management (TDM). It is necessary to recognize the use of these terms when
exploring demand management approaches.
Mobility management can be applied in various thematic fields on a city or site level,
for example communities, companies, schools and universities. So far several
mobility management methods have been developed including: Information Provision
method, Feedback method, Behavioral Plan method, and Advice method (Fujii, 2005).
1.2.3 The roles of mobility management as a psychological approach in
changing behavior
Many policy makers in developing countries may still have a perception or
expectation that as long as a good public transportation service is built and/or private
mode use become more costly, travelers would definitely change to use public
transport. However, this is not a thorough way of thinking. First, people‘s attitudes
may not always fully reflect how the public transport system has been improved.
Besides, once the public transportation service become better but is not as perfect as
people’s expects, people may still not change to use public transport. These points
imply that even though the causal relationships theoretically exist as shown in Figure
1.3, the effects and psychological process need to be provoked by external impacts
such as communication measures. So mobility management needs to be there to
narrow the gap between the objective quality of public transportation service and the
perceived one, to provide people information of how to use public transportation
service, to help people realize that it is not such difficult to use public transportation,
to make them realize their ‘responsibility’ of negative externalities caused by their
private mode use as well as benefits if they choose other ways to travel. Besides,
mobility management such as “behavioral plan method” (Fujii and Taniguchi, 2006)
could play a role to bridge between the behavioral intention and the actual behavior.
Figure 1.3 illustrates the process of behavior change due to different mobility
management methods.
Past researches also found that non-public transport users usually have negative
perception about public transport (Fujii et al., 2001b). Moreover, though repeated
behavior, private mode users would form a consolidated habit of driving (Aarts et al.,
1997). In such cases, intention and attitudes are not enacted if they are interfered with
by habits (Verplanken and Faess, 1999). That is, they become progressively worse
9
predictors of behavior when habit increases in strength and vice versa. Therefore, it
requires some kind of psychological intervention to change people’s attitude as well
as to break the private mode use habit. Mobility management is necessary for such
situations.
1.2.4 Types of mobility management
There are several types of mobility management which are different in terms of the
location and the target of intervention measures. Accordingly, there are mainly three
types of mobility management, depending on locations: residential, school, and
workplace. The descriptions about each type of mobility management are outlined
below:
Residential mobility management
This type of mobility management comprises travel behavior interventions in
communities. The program typically targets people across a selected area who
indicate a willingness to change their travel behavior. The participants in the program
receive information that was designed based on the previously-reported travel
behavior. The information may include, for example individualized and stop-specific
timetables, community maps, as well as cycling and walking guides. These are to
inform the participants of their transport options and motivate them to change. They
may further receive in-depth advice through consultation. In addition, information on
public transport promotion can also be provided in large scale via public campaign or
television. These intervention measures are expected to increase behavioral awareness
thus could change the behavior of the residents.
School mobility management
This mobility management scheme targets at the students and their families because
schools, in addition to residences and workplaces are the main constituents generating
traffic. Since awareness and habit are critical factors that prevent people from
changing behaviors, students are chosen for applying mobility management because
young age students are at just the age of developing awareness while university
student are those who have not yet built transport habits. It is therefore expected that
communicative measures targeting these groups of people would be more effective
than communication directed at habitual car users. The mobility management can be
implemented as part of a program in elementary school by providing resources to
support primary age students to become aware of the impact of the car on the
environment, the community and their health, and to try other forms of transport
(TravelSmart Australia, 2008). For example, in a program in Japan (Fujii and
Taniguchi, 2005a), the pupils will be educated with interactive lessons on the global
warming issues, the role of CO2 in this problem and the level of CO2 emission from
car use. Their families are also involved with program through answering questions
about their travel activities and through getting advices and requests to modify these
activities to reduce CO2 emission. Such interventions are expected to change not only
the behavior of using car in trips taking the pupils to school but also in other trips
made by their parents.
10
Workplace mobility management
This type of mobility management targets at working groups, especially those who
commute with a single occupied car, to manage their travel demand. For work place
mobility management, researchers, e.g. Atterbrand et al. (2005), Hagihara (2007),
proposed two simultaneous approaches to facilitate behavioral change: One is
targeting at personal employees and the other is approaching toward employers. The
approach toward personal employees aims at changing the commuting behavior of
individual employees. This may include a sequence of steps as follows: 1/
investigating the present commuting behavior of the employees and asking them to
look over other possible alternative ways to get to work; 2/ providing information
about the demerits of driving to work together with information on how to commute
by public transport; and 3/ contacting directly with the employees to modify their
commuting behaviors toward environmental friendly modes. In addition to affecting
employees, it is necessary to implement measures to influence the employers also.
This can be done by raising awareness of the leaders in the companies through
informing them the merits of participating in the program. As long as the leader group
of a company is aware of the benefits of reducing car use to their companies and to
their staffs, they will be recommended to build workplace travel plans and to change
regulations and facilities that encourage their employees to modify their behavior.
In addition to the above three types of approaches, mobility management schemes
may also involving with other measures to impact on transport agencies to improve
the system for easy accessibility to public transport, to transform facilities for car use
into those for walking and bicycle use, and to change the legislations and taxes that
restrict car use etc..
1.2.5 Overview of mobility management schemes in developed countries
Travel Blending and TravelSmart Individualized Marketing in Australia
Mobility management was initiated rather soon in Australia (in 1996) with a program
named Travel Blending developed to reduce pollution by car use in Sydney before the
year 2000 Olympics. This program used a combination of the information provision
method, the feedback method, and the advice method to convince people to “blend
travel choices in a manageable but sustainable way to reduce motor vehicle use”
(Rose and Ampt, 2001). Travel Blending involves in-depth analysis of people’s travel
behavior to come up with suggestions on how behavior could be modified. It’s
basically a way to help people to reduce car use by blending their travel choices over
time, thus it is expected to improve travel efficiency and decreasing the strain on
transport network.
In 1997, another program named TravelSmart was introduced. A pilot project of this
program covering 500 local people in South Perth was implemented. This program
used a tool called Individualized Marketing (Brög, 1998) which inform, provide skills
and motivate people to change their travel behaviors. Specifically, participants of the
program were encouraged to voluntarily make a small change in their travel behavior,
e.g. to use an alternative to the car as a driver. This initiative has resulted in dramatic
increases in the usage of sustainable transportation mode in Perth. This success of the
pilot project had led to the large scale application of this technique in 8 states and
local governments around Australia. Currently, there are 4 smaller programs targeting
11
at different groups of travelers: TravelSmart schools, TravelSmart workplaces,
TravelSmart destinations, TravelSmart communities. Noticeably, the TravelSmart
Individualized Marketing program is now being replicated in the United Kingdom,
Portland and Oregon in the United States, Gothenburg in Sweden.
In European countries
Mobility management in Europe has involved from TDM. Since the last decade,
authorities in many European countries have used TDM approaches to influence and
manage the demand for transport. In responding to increasing private car use, TDM
approaches during this time aimed to restrain private car use and promoting public
transport use. Many measures have been integrated into national transport policy and
implemented in European countries to meet this objective, for example, road pricing
in UK, Sweden, parking fees, land use policy (US Department of Transportation,
2006). Road pricing has been implemented in many countries such as UK, Sweden to
terminate and curtail car use. Besides pricing measures, many TDM organizations in
European countries have been offering incentives to encourage the use of public
transport. Reducing fares, enhancing smooth transfer between alternative modes,
increasing availability, convenience, and reliability of public transport were typical
improvements made to attract more public transport users (Cleland and Cooper, 2003).
Recent efforts in Europe have been devoted to encourage the use of public
transportation by alternating infrastructure to benefit non-motorized access to public
transport modes. For example, streets in municipal areas were designed to give
preference to travelers who use alternative modes to commute or to access to public
transport facilities. More recently, there are efforts from individual European
countries and the whole union to apply relatively new approach of influencing travel
behavior through advertising campaigns and marketing, encouraging citizens to make
wiser travel choices and simultaneously targeting a younger, school aged
demographic before their travel habits become routine.
At nation level, there have been several initiatives of mobility management, using
information provision method and behavioral plan method, were implemented via
local-level cooperation between authorities, companies and individuals, for example
TravelWise and HeadStart in UK in 1993, Travel Blend in Nottingham, commuter
plans in Denmark, Netherlands etc. Most of these initiatives are drafting and
implementing transportation plans for wok places in which each employee was
advised to elaborate a plan to use forms of transportation other than a car. Even
though there was not an overall evaluation for those national programs, mobility
management in European countries can be considered to achieve certain success.
At union level, the European Platform on Mobility Management, a network of
governments in European countries engaged in mobility management, has been
organized to promote and further develop mobility management in Europe. MOST
(Mobility Management Strategies for the next Decades) was a mobility management
project supported by the European Commission. It involved the participation of 32
countries in Europe. MOST was designed to further develop the concept of mobility
management and demonstrate the feasibility of mobility management services in
practice. MOST program‘s target was to enhance public awareness and to promote
use of public transport by personalizing travel via mobility centers. These mobility
centers, located in major European cities, have been offering various transport
12
services to the users such as information to use all available modes, car sharing and
vanpooling. In addition, for commuters, a plan named Green Commuter Plan was
developed to encourage both employers and employees to reduce auto travel to
workplace by providing a set of incentives such as rewarding for cycling, car sharing
or using public transport to work as well as offering optional schedules of tele-work
or variable work which actually benefit both of these two parties (Rye and McGuigan,
2000).
During 3 years implementation, the MOST project was highly supported by local
authorities, public transport companies and site managers since these parties realized
that mobility management could solve their transportation related problems. Within
the project, mobility management strategies were tested in various fields (schools,
hospitals, new developments etc.). Specifically, six thematic fields were used when
selecting the testing sites, including: Education, health, site development, temporary
sites, and mobility consulting centers.
It should be noted that at the beginning, managing travel demand in Europe was
basically similar to those of the US, i.e. taxation, pricing, improvement of public
transport. The change toward mobility management measures such as individualized
travel, carpool matching, and mobility management at workplaces have made travel
demand management in European countries more prescient and future-oriented
compared to the US (Cleland and Cooper, 2003).
In Japan
In 1998, communication based mobility management was first introduced to policy
makers and researchers in Japan. After that, in 1999, a pilot mobility management
approach named Travel Feedback Program (TFP) was tested in Sapporo and Osaka.
Since then, there have been many efforts nationwide to test mobility management to
find the most suitable ways to implement mobility management. These attempts have
used communicative techniques such as the information provision method (e.g. by
newspaper, newsletter), the feedback method (Taniguchi et al., 2003), and behavioral
plan to appeal and persuade people to use environmentally friendly transportation
modes. The target groups of these attempts included students at school, car
commuters in both work places and residential areas. Number of mobility
management testing projects has increased very fast within 8 years, reaching nearly
100 projects as of the year 2006. Based on the findings of these researches, some
transportation boards in some regions, for example Kinki region, have acknowledged
the necessity of implementing mobility management as a transport policy to reduce
car use.
1.2.6. The effectiveness and benefits of practical mobility management
Mobility management showed to be an effective strategy with promising results in
promoting sustainable transportation use. In Japan, a review of results of 12 TFP
projects implemented in different regions in Japan from 2000 to 2005 showed that car
use has reduced by 19% while public transportation use increased by approximately
32% (Taniguchi et al, 2007). The result of time analysis also revealed that these
changes are maintained, some up to three years as observed so far. In Australia,
transport’s pilot project in South Perth achieved a 90% increase in cycling, 21% in
13
public transport and a 16% increase in walking trips, while a 10% reduction in car as
driver only trips was observed (Brög and John, 2001) and car driver mode share in
South Perth was reduced 8% as the result of the large scale application of the Travel
Smart Program. This change was sustained four years after the program was
completed. Regarding benefits, the TravelSmart Individualized marketing program
has been found to be highly cost effective. By considering the benefits in terms of
travel time savings, environmental benefits, and network congestion reduction
benefits and the costs including initial survey costs, follow up costs for implementing
the mobility management program, the benefit to cost ratio for Travel Smart was
estimated to be 13:1 in the City of South Perth (Department of Transport, 1999, 2000;
Ker and James, 1999) and to be around 6:1 for Travel Blending (Tisato and Robinson,
1999).
Mobility management in European countries has also achieved certain results. For
example, individualized marketing initiatives in UK have reduced car driver trips by
between 5% and 16% (Department for Transport, 2004). An overview of some
mobility management projects in Europe showed that mobility management measures
have brought about 7 to 38% car use reduction with significant increases of
sustainable mode use (MOST, 2003). The effectiveness and economic benefits of
mobility management programs are probably among the most important factors for
convincing potential followers, decision takers and funding institutions in developed
countries.
1.2.7 Mobility management in Asian developing countries – Why not?
Mobility management has not yet been applied in Asian developing countries,
therefore it is still unclear whether mobility management is effective or not. This is
partly because so far, few studies have investigated the psychological factors relevant
to travel mode choice in these countries. Therefore, studying the applicability of
psychological measures such as mobility management in developing countries is
necessary. Besides, with the fact that people in many Asian developing countries
likely favor private car use over public transit use (Action Plans for Reducing Vehicle
Emissions, 2002), the application of psychological strategies could also be very
important for managing transport demand.
An additional form of mobility management for Asian developing countries
In developed countries, psychological strategies have been applied since recent years
while the ‘structural strategies’ have been strongly implemented for long time and
until now, these countries already have relatively good infrastructure for both public
and private transport. Meanwhile, in most developing countries, structural strategies
for transit-oriented development might not be well planned and promoted while
psychological strategies are even completely neglected. In that view, while transport
in developing countries are far lagged behind that in developed countries, mobility
management is more necessary for developing countries even though at present they
still need to focus on infrastructure building and legislative measures. The
combination of ‘soft’ measures i.e., mobility management and ‘hard’ measures, i.e.
structural strategies, could help facilitate the development of public transport system
in these countries. Litman (2002) speculated that effective mobility management at
14
early stages of infrastructure development would be much better than when people are
too car-dependent.
Moreover, measures proposed by transport planners in many Asian developing cities
are still not exclusively oriented toward environmental friendly transport. As
remarked by Litman (2002), most transport officials and decision makers are
relatively wealthy and may possess private vehicles, so they personally tend to prefer
automobile-oriented improvements to transit-oriented development. Besides, the
cause may also be due to the differences between transport planners in developed and
developing countries in terms of planning visions and awareness about importance of
sustainable transport.
The discussion above implies that in developing countries, besides the conventional
mobility management targeting at the public or travelers, we need intervention
measures targeting transport planners to affect their intention and consensus on
restraining private mode use and on developing transit oriented policies. Therefore,
this thesis suggests an additional form of mobility management for Asian developing
countries, that is, mobility management to enhance the awareness and attitude of
transport planners.
1.2.8. Fundamentals prior to applying mobility management
There are generally two main problems to be considered prior to applying mobility
management. First, we need to know whether there is a large potential to make a
change from private mode use to other sustainable transport use. Specifically, the
questions are how many percents of private mode trips are in subjective situation
(Brög et al., 1999) and which types of trips are potential for behavioral change (Brög
and Erl, 1996). Seethaler and Rose (2003) reasoned such a potential in terms of three
rationales: external barriers which are objective constraints, internal barriers which
are (mis-)perceptions and the habitual nature of the decision process.
Information about the potential could be acquired via intensive dialogs with
individuals and households to investigate each individual trip (Brög and Erl, 1980).
Still, such a method requires much time and effort, but could yield higher accuracy,
thus it is suitable for large-scale implementation of mobility management. For
applying Travel Smart and other types of mobility management measures, such kinds
of investigations had been implemented in Australian cities, and German cities etc…
(James and Brög, 1999). Another way is utilize travel demand models to analyze and
to calculate how many trips in a certain network could be transferred to sustainable
modes (Mozon and Vega, 2006). However, this analysis requires disaggregated
mobility data, and therefore it seems to be more suitable to developed countries where
person trip data is normally available.
As long as the potential is verified, the problem of inducing behavioral change is just
the effectiveness of the measures to correct subjective perceptions. Regarding this, it
is necessary to know whether and what mechanism of persuasion, etc. information
and communication, is effective to change people’s subjective perceptions. There are
three approaches that explicate communication methods and messages for persuasion,
attitude and behavior change, they are: cognitive response approach (like the TPB),
15
attribution approach and heuristic processing approach (Eagly and Chaiken, 1993).
Each approach itself generates several principles of persuasion.
For social-cognitive approach, researchers in transport psychology in developed
countries have implemented many studies regarding measures to influence intention
and behavior, for example, Fujii and Kitamura (2003) in using temporal structural
change to break behavior, Gärling et al. (2001) in studying determinants of lessdeliberate driving choice etc. These studies helped identify suitable principles of
persuasion for mobility management and that led to the test and the application of
mobility management in countries like Australian, Europe and Japan. Meanwhile, in
developing countries, there are few studies about the role of psychological factors in
predicting intention and behavior, representatively for example, a study by
Choocharukul and Fujii (2007) about behavior of future mode choice in Bangkok, a
study by Joewono and Kubota (2007) about overall satisfaction and loyalty in using
para-transit etc. However, these studies are still incoherent and thus they are not
sufficient for a clear conclusion about the possibility of behavioral change by using
some certain communication tools.
1.3. Thesis objective and scope
Given the background discussed above, the objective of this thesis was to investigate
the applicability of psychological approach such as mobility management that can
induce the behavior change of private mode use toward using public transport in
Asian developing cities. This is finally for a sustainability of transportation and
sustainable development of developing countries. Towards this goal, the thesis built
up three specific objectives, they are:
•
To investigate the potentials of changing the behavior of private mode users
toward more public transport use.
•
To investigate applicability of mobility management in terms of psychological
aspect.
•
To test the efficiency of mobility management methods used to increase the
awareness and to change the attitudes of local transport planners toward
sustainable transport system.
Scope of the thesis
As stated in the objective, this thesis attempts to study the necessary, the potential and
the applicability of using psychological approach to change the behavior of private
mode users in Asian developing countries rather than developed countries where
psychological approach has been widely tested and applied. Therefore, to discuss on
these aspects of using psychological approach, the thesis will use exemplified studies
in some Asian developing cities which are facing with many problems regarding
private mode use. The scope of this thesis is defined as follows:
•
The thesis targets at Asian developing countries.
16