Tail dependence between gold and sectorial stocks in China: Insights for portfolio diversification
Bạn đang xem bản rút gọn của tài liệu. Xem và tải ngay bản đầy đủ của tài liệu tại đây (1.22 MB, 27 trang )
<span class='text_page_counter'>(1)</span><div class='page_container' data-page=1>
<b>Tail dependence between gold and sectorial stocks in China: </b>
<b>Insights for portfolio diversification </b>
Joscha Beckmann,a Theo Berger,b Robert Czudajc and Thi-Hong-Van Hoangd
a <sub>University of Duisburg-Essen, Department of Economics, Chair for Macroeconomics, Germany </sub>
b<sub> University of Bremen, Department of Business Administration, Chair for Applied Statistics and Empirical Economics, Germany </sub>
c<sub> University of Duisburg-Essen, Department of Economics, Chair for Econometrics, Germany </sub>
d
Montpellier Business School, Montpellier Research in Management, France
August 25, 2015
<b>Abstract</b>
This article analyzes dynamics of relationship between gold quoted on the Shanghai Gold
Exchange and Chinese sectorial stocks from 2009 to 2015. Using different copulas, our
results show that there is weak symmetric tail dependence between gold and sectorial stocks.
Based on the efficient frontier, optimal weight, hedge ratio and hedging effectiveness, we find
that adding gold to Chinese stock portfolios can help to reduce their risk. Gold appears to be
the most efficient with stocks of the Energy, Information, Telecommunication and Materials
sectors and the less efficient with the Utilities sector. As a robustness check, gold is compared
to oil and the results show that gold is also more efficient than oil in the diversification of
Chinese stock portfolios.
<i>JEL Classifications: G11, C58 </i>
<i>Keywords: Shanghai Gold Exchange, Chinese sectorial stocks, oil, copulas, portfolio implications </i>
_____________________
<i>Email addresses: J. Beckmann (</i>), T. Berger (), R. Czudaj
</div>
<span class='text_page_counter'>(2)</span><div class='page_container' data-page=2>
<b>1.</b> <b>Introduction </b>
China has been the largest producer in gold in 2014, contributing 45% of the world
production and is also the largest world consumer jointly with India with both markets
accounting for 54 percent of consumer gold demand according to the World Gould Council.1
However, since Chinese investors cannot trade gold abroad without restrictions, the Shanghai
Gold Exchange (SGE) is the main trading platform for their gold investment (Cheng 2014).
At the LBMA Bullion Market Forum 2014 in Singapore, Mr. Luode, the current Chairman of
the SGE, announced its opening to international members for the first time and this actually
happened on September 18, 2014. The SGE is still a relatively novel market which was
opened on October 30, 2002, and its development has been noticed in numerous analyses of
specialists (World Gold Council, 2014). Chinese institutional and individual investors have
been able to invest in gold through the SGE only since 2004 and 2007, respectively (Cheng,
2014). The “GFMS Gold Survey 2014” reported that the turnover of the SGE was just behind
London, New York (Comex) and Tokyo (Tocom) over the 2007-2013 period. According to
Wang (2011), the previous Chairman of the SGE, from October 2002 to April 2011, the
transaction volume of gold on the SGE reached more than 20,000 tons. In 2013, it was 10,701
tons, of which 1,132 tons were private demand (Cheng, 2014). Wang (2011) indicated that
commercial banks account for 58% of the transaction volume, individual investors for 19%
and institutional members for 23% in 2010.2
Taking into account the leading role of China in the global gold market, the growing
development and internationalization of the SGE has attracted interest among researchers and
investors. However, the number of studies on the SGE remains quite small compared to the
huge literature on the financial economics of gold.3 To the best of our knowledge, there are
only three studies dealing with the SGE: Lucey et al. (2014) and Hoang et al. (2015a,b).
Lucey et al. (2014) study the relationship between gold markets around the world and find
that the SGE is an isolated one and does not have significant interaction with other
international gold markets. Hoang et al. (2015a) study the relationship between gold and
inflation in five countries from 2002 to 2013 and find that gold is not a good hedge against
1
According to the World Gold Council, the total global demand for gold in 2014 was 3,924 tonnes, with India’s
consumer demand accounting for 843 tonnes and China's for 814 tonnes. See World Gold Council, “Gold
Demand Trends”, February 2015.
2<sub> In 2015, the SGE offers 13 products (spot and futures) covering gold, silver and platinum on the Main Board </sub>
with 167 domestic members, 8000 corporate customers and over seven individual investors trading on the SGE
through their carrying members. As for the International Board, there are 40 members, such as HSBC, Goldman
Sachs, Deutsche Bank, etc., with three products (iAu100g, iAu99.99 and iAu99.95).
</div>
<span class='text_page_counter'>(3)</span><div class='page_container' data-page=3>
Chinese inflation in the long term. Hoang et al. (2015b) find that including gold quoted at the
SGE in Chinese stock and bond portfolios is more preferable to risk-seeking investors than to
risk-averse ones. Some other studies provide analysis on the relationship between Chinese
stocks and gold, such as Ziaei (2012), Anand and Madhogaria (2012), Thuraisamy et al.
(2013), Gürgün and Ünalmis (2014) and Arouri et al. (2015). However, they do not take into
account gold prices from the SGE but those from London converted into Chinese currency.4
However, this choice can only be appropriate for foreign investors but not for Chinese who
cannot trade gold abroad as mentioned above. Thus, using gold prices on the SGE is more
appropriate for Chinese investors whose demand for gold investments has increased strongly
and it is estimated that the private demand would reach 1,350 tons in 2017 (Cheng 2014).
In this twofold context, the rapid development of the SGE with a lack of literature on it, the
objective of our article is to analyze the relationship between Chinese stocks and gold quoted
at the SGE. We provide a new perspective on gold investments in general and the Chinese
market in particular for several reasons. First, we use gold prices quoted at the SGE and not
those from London converted into Chinese currency. As we mentioned above, this is more
suitable to Chinese investors and may also bear some interesting implications for international
investors, which trade gold on the SGE using the local currency, i.e. the Renminbi. Thus, the
results that we obtain would provide rational information to both Chinese and international
investors on the SGE. Second, we pay a particular attention to the extreme returns of gold and
stocks in China through their tail dependence calculated by different copulas (Gaussian, t,
Gumbel, Clayton and Frank) based on the generalized Pareto distribution on GJR-GARCH
filtered returns. Third, we analyze the impact of the sector of Chinese stocks on its
relationship with gold. To the best of our knowledge, this issue has not been analyzed before
for the SGE. However, it is of particular importance considering the specificity of each sector.
Fourth, we further investigate how the tail dependence of returns between gold on the SGE
and Chinese sectorial stocks would be profitable in the diversification of portfolios.
Our portfolio analysis considers four types of portfolios for each stock sector: 100%
stocks, 50% stocks+50% gold, weights of each asset following the minimal-variance portfolio
on the efficient frontier of Markowitz (1952) and following the optimal weight of gold to
minimize the conditional variance of returns proposed by Kroner et al. (1998). We then
compare these portfolios to analyze the benefit of gold in a portfolio using the hedging
effectiveness ratio proposed by Ku et al. (2007). Furthermore, as a robustness check, we also
</div>
<span class='text_page_counter'>(4)</span><div class='page_container' data-page=4>
perform the above-mentioned analysis to investigate the relationship between oil and sectorial
stocks in China to verify the results of recent studies on the similar behavior of gold and oil
vis-à-vis stocks. Our 2009-2015 daily dataset is composed of spot gold prices on the SGE and
values of sectorial stocks quoted on the Shanghai Stock Exchange (SSE) with 1,314
observations in total. As for oil prices, we use those provided by West Texas Intermediate
(WTI) as a robustness check.
Our findings show that…
The rest of the paper is organized as follows. The second section details the literature
review related to the role of gold in the diversification of portfolios. Section 3 presents our
methodology while Section 4 focuses on the data set. Section 5 analyzes our results on the tail
dependence and provides insights for portfolio diversification. Section 6 presents a robustness
check including oil and Section 7 concludes.
<b>2.</b> <b>Literature review: Gold in the diversification of portfolios </b>
Gold investments and the link between stock prices and gold has been analyzed by several
authors. The first study investigating gold investments has been provided by McDonald and
Solnik (1977), several years after the abolition of the Bretton-Woods system. It is followed by
Sherman (1982), Jaffe (1989), Chua et al. (1990), Blose (1996), Blose and Shieh (1995),
Davidson et al. (2003) and Lucey et al. (2006). All these studies reveal the significant
relationship between gold and stocks, and the positive role of gold in the diversification of
portfolios. In 2010, Baur and Lucey (2010) and Baur and McDermott (2010) investigate the
role of gold as a safe haven asset. Following these two studies, many others, for example,
Hood and Malik (2013) or Beckmann et al. (2015a) examined the role of gold in stock and
bond portfolios in different countries, relying on different frameworks with the later also
accounting for nonlinearities.
</div>
<span class='text_page_counter'>(5)</span><div class='page_container' data-page=5>
proposing a more flexible approach to test these hypotheses compared to Baur and Lucey
(2010). Sadorsy (2014) reveals that gold and oil can also be used as a hedge and safe haven
for socially responsible stocks, in a similar way as for conventional stocks. In comparing gold
to bonds, Flavin et al. (2014) find that both gold and longer-dated bonds can be considered as
safe haven assets. Applying the wavelet approach on daily data from 1980 to 2013, Bredin et
al. (2015) conclude that gold acts as a safe haven for stocks and bonds only for horizons up to
one year, but this is not true in the early 1980s. Overall, the above-mentioned studies show
that gold acts as a safe haven for stocks and bonds. However, it is time-varying and
market-specific.
Other studies go beyond analyzing the usual role of gold as a safe haven and focus on its
impact in the diversification of portfolios. For example, Hammoudeh et al. (2013) find
significant relationship between gold and stocks and conclude that gold can thus play an
important role in the diversification of stock portfolios. Kumar (2014) shows that stock and
gold portfolios perform better than portfolios only consisting of stocks. Based on a wavelet
analysis, Michis (2014) concludes that gold provides the lowest contribution to the portfolios’
risk at medium- and long-term investment horizons. Baur and Löffler (2015), Choundhry et
al. (2015), and Malliaris and Malliaris (2015) confirm the results of previous articles about the
significant impact of gold in the diversification of portfolios.
</div>
<span class='text_page_counter'>(6)</span><div class='page_container' data-page=6>
<b>3.</b> <b>Methodology </b>
Our methodology can be divided into two different parts. In the first step, we explore the tail
dependence between gold and sectorial stocks in China using several copula measures based
on the generalized Pareto distribution on GJR-GARCH filtered returns. In the second part, we
will investigate the hedging efficiency of gold in Chinese sectorial stock portfolios based on
the four types of portfolios which have already been mentioned in the Introduction.
<b>3.1.</b> <b>GJR-GARCH </b>
Before applying different copula measures to investigate the tail dependence, we first focus
on the heteroscedasticity and autocorrelation of the second moment of the distribution of
returns and as conventional in the literature (see for instance Beckmann et al. 2015b) we
apply an ARCH filter since we deal with daily return series that are characterized by
autocorrelation and conditional heteroscedasticity. Moreover, to account for the potential that
shocks tend to impact conditional volatility asymmetrically, we apply a GJR-GARCH filter as
defined by Glosten et al. (1993):
where denotes the return series and represents the variance of its error terms . In this
setup, Ω represents a constant, α measures the impact of shocks and β indicates the
persistence of the process. Moreover, to capture the asymmetric impact of shocks on the
volatility, γ takes a value of unity if the shock is negative and 0 otherwise.
<b>3.2.</b> <b>Generalized Pareto distribution </b>
As we deal with different assets and thus with different asset specific properties, we apply a
flexible return distribution that adjusts to each asset individually. More precisely, according to
Longin and Solnik (2001), we apply the generalized Pareto distribution (GPD), which models
the tails of each distribution individually whereas the “interior part” of the distribution is
described by the empirical distribution. In order to model both tails of the marginal return
distribution individually, we need to define the amount of observations that should be
considered in the tails. Therefore, we set a predefined threshold of , so that the
lowest 10% and highest 10% values of the time series are modeled via the GPD.
</div>
<span class='text_page_counter'>(7)</span><div class='page_container' data-page=7>
with and . In this setup, determines the shape and the scale of the
respective tail. The parameters are maximized via the log likelihood function as defined by
Longin and Solnik (2001).
<b>3.3.</b> <b>Copulas </b>
The linear correlation coefficient lacks in capturing non-linear transformations of the margins
and it does not capture the tail dependence. That is why we use the copula approach to
separate the modeling of the marginal distribution from the modeling of the dependence.
Generally, the copula approach goes back to Sklar’s Theorem (1959). Based on the modeled
margins, we apply different copulas to assess different patterns of the tail dependence. These
copulas are briefly introduced in the following.
• <b>Gaussian Copula </b>
The Gaussian copula is directly derived from the multivariate normal distribution:
stands for the multivariate normal distribution. If all margins are normally distributed, this
copula equals the multivariate normal distribution. The Gaussian copula does not capture tail
dependence between the analyzed time series. Therefore, joint extreme movements cannot be
adequately captured. To account for this feature we also consider the t copula.
• <b>t Copula </b>
Analogous to the Gaussian copula, the t copula is directly derived from the multivariate t
distribution and is given as follows:
stands for the multivariate t distribution. Due to its degrees of freedom, the t copula
captures joint extreme movements and is therefore characterized as symmetric tail
dependence. For , the t copula approximates a Gaussian copula. Both the Gaussian and
</div>
<span class='text_page_counter'>(8)</span><div class='page_container' data-page=8>
• <b>Gumbel Copula </b>
In contrast, the Gumbel copula belongs to the family of Archimedean copulas and is
widely used as it captures asymmetric joint movements. The setup of the Gumbel copula is
given as follows
with . Positive tail dependence is described by .
• <b>Clayton Copula </b>
Another Archimedean copula is given by the Clayton copula. In contradiction to the setup of
the Gumbel copula, the Clayton copula captures joint negative shocks, so called negative tail
dependence:
with . Negative tail dependence is characterized by .
• <b>Frank Copula </b>
The Frank copula does also belong to the family of Archimedean copulas, whereas it accounts
for symmetric tail dependence:
For
All parameters are estimated via the log-likelihood in a two-step mechanism (see Joe
1996). This setup is often referred to as inference to the margins (IFM) and allows us to
estimate the GARCH parameters in the first step and the copula parameters in a second step.
<b>3.4.</b> <b>Efficient frontier </b>
The classical mean-variance portfolio optimization (MVPO) model introduced by
Markowitz (1952) can be used to determine the asset allocation for a given amount of capital
through the efficient frontier. To present the MVPO model formally, we assume that there are
<i>n assets and let xi (i=1,…,n) be the fraction of the capital invested in asset i of portfolio P in </i>
which the average return<i>R<sub>p</sub></i> is maximized, subject to a given level of its variance 2
<i>p</i>
σ . We
<i>denote Ri to be the expected return of asset i and </i>
σ
<i>ij the covariance of returns between assets i </i><i>and j, for any i, j =1,…,n. The general MVPO model is presented as follows: Max </i>
1
<i>n</i>
<i>p</i> <i>i</i> <i>i</i>
<i>i</i>
<i>R</i> <i>R x</i>
=
=
∑
, subject to: 21 1
<i>n</i> <i>n</i>
<i>ij</i> <i>i</i> <i>j</i> <i>p</i>
<i>i</i> <i>j</i>
<i>x x</i>
σ σ
= =
=
∑∑
and1
1.
<i>n</i>
<i>i</i>
<i>i</i>
<i>x</i>
=
=
∑
If short sale is not used, we add</div>
<span class='text_page_counter'>(9)</span><div class='page_container' data-page=9>
<b>3.5.</b> <b>Optimal weight and hedging effectiveness </b>
To assess the hedging and diversification of portfolios with gold, we determine the optimal
weight of gold in Chinese sectorial stock portfolios in referring to the method proposed by
Kroner et al. (1998) as follows:
<i>P</i>
<i>t</i>
<i>PG</i>
<i>t</i>
<i>G</i>
<i>t</i>
<i>PG</i>
<i>t</i>
<i>P</i>
<i>t</i>
<i>G</i>
<i>t</i>
<i>h</i>
<i>h</i>
<i>h</i>
<i>h</i>
<i>h</i>
<i>w</i>
+
−
−
=
2
with <i>G</i>
<i>t</i>
<i>w</i> as the optimal weight of gold in the portfolio, <i>P</i>
<i>t</i>
<i>h</i> as the conditional variance of the
stock-only portfolio <i>P</i>, <i>PG</i>
<i>t</i>
<i>h</i> as the conditional covariance between the stock-only portfolio
and gold, and <i>G</i>
<i>t</i>
<i>h</i> as the conditional variance of gold. The optimal weight is thus calculated for
each date under the condition that: <i>G</i> =0
<i>t</i>
<i>w</i> if <i>G</i> <0
<i>t</i>
<i>w</i> ; <i>G</i>
<i>t</i>
<i>G</i>
<i>t</i> <i>w</i>
<i>w</i> = if 0≤<i>w<sub>t</sub>G</i> ≤1, and <i>G</i> =1
<i>t</i>
<i>w</i> if
1
>
<i>G</i>
<i>t</i>
<i>w</i> . We use the average over the study period which is the average optimal weight of gold
to minimize the conditional variance of returns of the portfolio.
In this study, we rely on the bivariate CCC-GARCH(1,1) model of Bollerslev (1990) to
estimate the conditional variances and covariance. We use the CCC representation as it
provides more economic significance in estimating conditional correlation rather than the
conditional covariance (like in the BEKK-GARCH model of Engle and Kroner (1995) for
example). In general, for each pair of stock-only portfolio and gold returns, the bivariate
VAR(1)-GARCH(1,1) has the following specification:
=
+
Φ
+
= <sub>−</sub>
<i>t</i>
<i>t</i>
<i>t</i>
<i>t</i>
<i>t</i>
<i>t</i>
<i>H</i>
<i>R</i>
<i>R</i>
η
ε
ε
µ
2
/
1
1
where =( , <i>G</i>)′
<i>t</i>
<i>P</i>
<i>t</i>
<i>t</i> <i>R</i> <i>R</i>
<i>R</i> is the vector of returns of the stock-only portfolio and gold,
respectively. Φrefers to a (2 x 2) matrix of coefficients <sub></sub>
=
Φ
2
1
0
0
φ
φ
,
(
<i>G</i>)
<i>t</i>
<i>P</i>
<i>t</i>
<i>t</i> ε ε
ε = , is the
vector of the error terms of the conditional mean equations for the stock-only portfolio and
gold, respectively.
(
<i>G</i>)
<i>t</i>
<i>P</i>
<i>t</i>
<i>t</i> η η
η = , refers to a sequence of independently and identically
distributed (<i>i.i.d) random errors with E</i>(η<i>t</i>)=0 and <i>Var</i>(η<i>t</i>)=<i>IN</i>; and
=
Η <i><sub>G</sub></i>
<i>t</i>
<i>PG</i>
<i>t</i>
<i>PG</i>
<i>t</i>
<i>P</i>
<i>t</i>
<i>t</i>
<i>h</i>
<i>h</i>
<i>h</i>
<i>h</i>
is the
matrix of conditional variances of the stock-only portfolio and gold returns.
The CCC-GARCH(1,1) model specifies the Η<i>t</i> matrix as follows:
<i>t</i>
<i>t</i>
<i>t</i>=<i>DKD</i>
</div>
<span class='text_page_counter'>(10)</span><div class='page_container' data-page=10>
where ( , <i>G</i>)
<i>t</i>
<i>P</i>
<i>t</i>
<i>t</i> <i>diag</i> <i>h</i> <i>h</i>
<i>D</i> = , and <i>K</i>=(ρ<i>ij</i>)is the (2 x 2) matrix containing the constant
conditional correlations ρ<i>ij</i> with ρ<i>ii</i> =1, ∀<i>i</i>=<i>P</i>,<i>G</i>. The conditional variances and covariance
are given by
=
+
+
=
+
+
=
−
−
−
−
<i>G</i>
<i>t</i>
<i>P</i>
<i>t</i>
<i>PG</i>
<i>t</i>
<i>G</i>
<i>t</i>
<i>G</i>
<i>G</i>
<i>t</i>
<i>G</i>
<i>G</i>
<i>G</i>
<i>t</i>
<i>P</i>
<i>t</i>
<i>P</i>
<i>P</i>
<i>t</i>
<i>P</i>
<i>P</i>
<i>P</i>
<i>t</i>
<i>h</i>
<i>h</i>
<i>h</i>
<i>h</i>
<i>C</i>
<i>h</i>
<i>h</i>
<i>C</i>
<i>h</i>
ρ
β
ε
α
β
ε
α
1
2
1
1
2
1
)
(
)
(
To estimate this model, the maximum likelihood method is used.
As for the optimal hedge ratio to minimize the conditional variance of returns of the
portfolio, Kroner and Sultan (1993) consider a two-asset portfolio, equivalent to a portfolio
composed of sectorial Chinese stocks and gold (or oil) in our study. To minimize the risk of
this hedged portfolio, a long-position of one Yuan on the stock segment must be hedged by a
short position of <i>SG</i>
<i>t</i>
β Yuan of gold. This optimal hedge ratio is given by the following:
<i>G</i>
<i>t</i>
<i>SG</i>
<i>t</i>
<i>SG</i>
<i>t</i>
<i>h</i>
<i>h</i>
=
β
.Furthermore, the hedging effectiveness can be evaluated by examining the realized
hedging errors which are determined as follows (Ku et al. 2007):
<i>unhedged</i>
<i>hedged</i>
<i>unhedged</i>
<i>Var</i>
<i>Var</i>
<i>Var</i>
<i>HE</i>= −
where the variance of the hedged portfolios <i>Var<sub>hedged</sub></i> is obtained from the variance of the
returns of the gold-stock portfolios, the variance of the unhedged portfolios <i>Var<sub>unhedged</sub></i> is
obtained from the variance of the stock-only portfolios. A higher <i>HE ratio indicates a greater </i>
hedging effectiveness in terms of the portfolio’s variance decrease.
<b>4.</b> <b>Data and preliminary analysis </b>
To investigate the relationship between gold quoted at the SGE and Chinese sectorial stocks,
our daily dataset running from January 9, 2009 to January 9, 2015 is collected from the
websites of the Shanghai Gold Exchange (SGE) and the Shanghai Stock Exchange (SSE). The
starting date is conditioned by the availability of the data on Chinese sectorial stock indexes
on the SSE’s website. Therefore, our dataset is composed of 1,314 daily observations. More
details about gold prices on the SGE and sectorial stocks on the SSE are presented in the
following.
<i>Gold prices from the Shanghai Gold Exchange (SGE) </i>
</div>
<span class='text_page_counter'>(11)</span><div class='page_container' data-page=11>
asset in our analysis because it is considered to be the reference gold spot asset in annual
reports of the SGE. Its prices are in Chinese Yuan per gram and are available on the SGE
website.
<i>Sectorial stock indexes from the Shanghai Stock Exchange (SSE) </i>
Daily data on sectorial stocks in China are available on the website of the SSE starting
from January 9, 2009. The sectorial indexes that are considered by the SSE are: Consumer
Discretionary, Consumer Staples, Energy, Financials, Health Care, Industrials, Information
Technology, Materials, Telecommunication Services and Utilities. We use the total return
index in order to take into account dividends paid on stocks under consideration. Following
information about the methodology of sectorial index construction given on the SSE website,
all stocks in the “A-shares” list, meaning stocks that are limited to domestic investors,
excluding stocks that are IPOs within 3 months and have anomalies (see the SSE website for
more details). Furthermore, all stocks at the bottom 15% by trading value and at the bottom
2% by cumulative market capitalization are deleted. For sectors which have less than 30
stocks, all the stocks enter the index. If this is not the case, stocks are ranked by daily average
market capitalization and only the top ranked stocks are chosen till the cumulative market
capitalization coverage reaches 80% of the total value or the number of stocks reaches 50.
The constituents of each index are adjusted semi-annually. Currently, in 2015, the number of
stocks that are considered in each sector is: 50, 30, 30, 30, 30, 50, 31, 50, 11 and 30,
respectively to the list of sectors that we present above.
<i>Descriptive statistics </i>
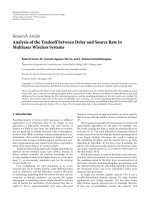
Figure 1 presents daily values of indexes on sectorial stocks and gold prices in China from
January 2009 to January 2015.
<b>Figure 1: Daily values of indexes on sectorial stocks and gold in China from 2009 to 2015 </b>
</div>
<span class='text_page_counter'>(12)</span><div class='page_container' data-page=12>
Service sectors Technology sectors
Note: For an easier comparison, we fix all values at the same basis of 100 on January 9, 2009.
From Figure 1, we notice that all gold and stocks were very volatile in China from 2009 to
2015. It is thus necessary to study the tail dependence of these two assets. At the beginning of
the sample period, sectorial stock indexes seem to exhibit a high degree of co-movements
while this pattern seems to become lower as time evolves. Furthermore, the industrial sectors
(Energy, Industrials and Materials) seem to behave differently compared to other sectors in
being in a decreasing tendency from 2013 while it is an increasing tendency for other sectors.
More importantly, in most of the time, gold prices evolve inversely with those of stocks and
two sub-periods seem to appear. The first period is from January 9, 2009, to September 9,
2011, when gold prices were increasing and reached its peak on September 9, 2011. This
same period is also characterized by an increasing tendency of stock prices in most cases. The
second period is from September 10, 2011 to January 9, 2015 and is characterized by the
increasing tendency of stocks and decreasing tendency of gold. As a preliminary analysis, we
assess the linear dependence between all assets with a simple correlation measure (Table 1).
<b>Table 1: Linear correlation </b>
<b>Disc </b> <b>Stap Energy Finance Health </b> <b>Indust </b> <b>Info </b> <b>Materi </b> <b>Tele </b> <b>Utili </b> <b>Gold </b>
Discretionary <b>1 </b> 0.84 0.76 0.69 0.74 0.89 0.88 0.83 0.78 0.83 0.13
Staples <b>1 </b> 0.65 0.54 0.8 0.77 0.8 0.73 0.69 0.74 0.13
Energy <b>1 </b> 0.76 0.51 0.83 0.67 0.87 0.64 0.75 0.16
Financials <b>1 </b> 0.42 0.77 0.54 0.73 0.57 0.69 0.12
Health Care <b>1 </b> 0.64 0.74 0.6 0.68 0.62 0.12
Industrials <b>1 </b> 0.8 0.88 0.75 0.87 0.11
Information <b>1 </b> 0.76 0.81 0.76 0.11
Materials <b>1 </b> 0.7 0.8 0.23
Telecom <b>1 </b> 0.71 0.11
Utilities <b>1 </b> 0.1
<b>GOLD </b> <b>1 </b>
</div>
<span class='text_page_counter'>(13)</span><div class='page_container' data-page=13>
The correlation between different sectors is relatively high, ranging between 0.5 and 0.9.
We notice that the correlation of the consumption (Discretionary and Staples) and energy
sectors with the other ones is the highest. The financial sector is the less correlated to the
other sectors. In all cases, the correlation between gold and sectorial stocks is low, around 0.1.
The sector the less correlated with gold is Utilities and the highest is Materials. This may be
explained by the fact that gold is used more in the Materials sector than in the Utilities one.
Table 2 gives the principal descriptive statistics of our sample data.
<b>Table 2: Descriptive statistics </b>
<b>Average </b> <b>SD </b> <b>Skewness </b>
<b>Kurtosis </b>
<b>excess </b> <b>JB </b> <b>KS </b>
Discretionary 16.82% 26.83% -0.32*** 2.67*** 412*** 0.05***
Staples 13.49% 24.83% -0.45*** 1.65*** 194*** 0.05***
Energy 1.75% 30.63% 0.10 2.97*** 485*** 0.06***
Financials 13.03% 27.82% 0.52*** 6.03*** 2043*** 0.07***
Health Care 19.46%* 26.74% -0.07 2.08*** 237*** 0.05***
Industrials 5.32% 24.93% -0.43*** 2.10*** 280*** 0.06***
Information 19.78% 31.17% -0.46*** 1.05*** 107*** 0.05***
Materials 7.52% 29.81% -0.29*** 2.69*** 414*** 0.06***
Telecom 7.80% 28.63% -0.27*** 1.51*** 139*** 0.05***
Utilities 8.66% 22.38% -0.63*** 2.84*** 529*** 0.07***
<b>GOLD </b> 4.31% 19.17% -0.83*** 14.89*** 12264*** 0.08***
Note: Mean and SD (standard deviation) are in annualized values, estimated by multiplying the daily values by 252
and 252<sub>,</sub> respectively. *** means that the value is significant at the 1% threshold. No asterisk means that the
value is not significant at the 10% threshold. JB (Jarque-Bera) and KS (Kolmogorov-Smirnov) are tests for the
normality of the distribution in which *** means that it is not normal at the 1% threshold.
From Table 2, we note that gold is less profitable than sectorial stocks in most cases,
except the Energy sector for which the annualized rate of return is only 1.75%, vs. over 4%
for gold. The sectors the most profitable are Health Care and Information Technology, almost
20% per year. The standard deviations are very high in all cases, from 20% to 34% per year.
The highest ones are for the Information and Energy sectors (over 30%) and the lowest one is
for gold (about 19%). The skewness coefficients are negative in most cases (except for the
Energy and Financials sectors). This means that, in most cases, the distribution of returns is
skewed to the left. The excess kurtosis is the highest for gold (about 15), meaning that there
are the most extreme values for gold returns. This is followed by the Financials sector (about
6). As usually found, all the normality tests (JB and KS) show that the distributions of all
return series are not normal.
</div>
<span class='text_page_counter'>(14)</span><div class='page_container' data-page=14>
Care and Information Technology. However, gold can provide profitable impact to sectorial
stock portfolios since gold has a lower variance and a low correlation to stocks. In the next
part of our study, we will investigate the tail dependence of return distributions and its
implications in the portfolio diversification between gold and sectorial stocks in China.
<b>5.</b> <b>Empirical results and discussions </b>
<b>5.1.</b> <b>GJR-GARCH estimates and copula parameters </b>
Before assessing the tail dependence between gold and different Chinese sectorial stocks, we
first present the results of the GJR-GARCH model based on the univariate time series. As
mentioned in Section 3, we apply an ARCH filter to deal with autocorrelation and conditional
heteroscedasticity of our sample daily returns. Table 3 reports the estimated parameters for all
investigated assets.
<b>Table 3: GJR-GARCH Parameters </b>
<b>Gold</b> <b>Discretionary Staples Energy Financials Health Care Industrials Information Materials Telecom Utilities </b>
<b>Omega</b> 3,85 2,09 2,64 0,00 2,35 2,37 1,97 0,00 1,81 34,65 0,00
<b>t-Value</b> 536,30 447,20 406,30 0,00 465,70 48,03 244,10 0,00 416,60 0,00 0,00
<b>Alpha</b> 0,09 0,07 0,09 0,23 0,06 0,22 0,06 0,21 0,06 0,00 0,27
<b>t-Value</b> 5,23 5,12 5,29 6,81 4,98 6,33 4,22 11,29 4,55 0,00 0,00
<b>Gamma</b> 0,02 0,01 0,00 0,00 0,01 0,00 0,02 0,00 0,01 0,25 0,00
<b>t-Value</b> 1,17 1,07 0,11 0,00 0,62 0,00 0,93 0,00 0,70 4,36 0,00
<b>Beta</b> 0,88 0,92 0,89 0,40 0,93 0,22 0,92 0,42 0,94 0,00 0,73
<b>t-Value</b> 37,89 53,62 34,56 0,00 61,91 0,86 39,58 0,00 62,85 0,00 0,00
<b>LL</b> 4007 3560 3653 3340 3517 3504 3630 3281 3446 3401 3778
<b>Q-Stat</b> 50,44 43,12 38,16 29,65 49,77 73,07 44,61 43,29 36,70 47,38 35,59
<b>LM</b> 15,86 16,26 18,59 8,78 15,49 44,86 11,45 14,50 10,92 10,60 11,91
Notes: Omega represents the constant. Alpha measures the GARCH effect. Gamma captures the asymmetric impact
of shocks on the volatility and Beta indicates the persistence of the process. LL denotes the log likelihood, Q-stat
represents the Ljung-Box test statistic for serial correlation, and LM gives the Lagrange multiplier test statistic for
serial correlation up to order 20.
</div>
<span class='text_page_counter'>(15)</span><div class='page_container' data-page=15>
the filtered return series, we carry on by assessing different copula measures and their
respective parameters.
<b>Table 4: Copula parameters between gold and sectorial stocks in China </b>
<b>Discretionary Staples Energy Financials Health Care Industrials Information Materials Telecom</b> <b>Utilities </b>
<b>Gauss</b> 0,12 0,10 0,15 0,10 0,08 0,10 0,10 0,22 0,09 0,07
<b>AIC</b> -15,47 -12,07 -28,58 -10,00 -6,60 -12,05 -11,36 -65,41 -9,17 -4,84
<b>t</b> 0,11 0,09 0,15 0,10 0,07 0,10 0,10 0,22 0,09 0,07
<b>DoF</b> 15,35 12,59 12,28 8,95 16,51 14,26 30,55 14,31 20,38 20,33
<b>AIC</b> -21,13 -20,47 -36,60 -27,16 -12,10 -19,18 -12,83 -71,78 -12,06 -8,11
<b>Frank</b> 0,58 0,52 0,86 0,56 0,41 0,59 0,53 1,32 0,49 0,37
<b>AIC</b> -9,87 -7,50 -24,07 -8,91 -4,13 -10,29 -8,07 -58,54 -6,48 -2,87
<b>Clayton</b> 0,11 0,08 0,17 0,12 0,06 0,12 0,09 0,26 0,09 0,07
<b>AIC</b> -10,53 -5,71 -25,64 -13,62 -2,08 -13,64 -6,96 -59,24 -7,83 -4,33
<b>Gumbel</b> 1,07 1,07 1,09 1,06 1,05 1,06 1,06 1,14 1,05 1,04
<b>AIC</b> -23,67 -23,61 -26,24 -15,34 -18,58 -9,72 -13,30 -55,10 -9,09 -6,69
Notes: DoF denotes the degree of freedom. AIC denotes the Akaike information criterion. The values in the cells present the
copulas estimated by the Gaussian, Student t, Frank, Clayton and Gumbel approaches as described in Section 3.
Table 4 presents the tail dependence between all assets and gold which is measured by
different copulas. In line with the results from Table 1, the dependence between gold and the
investigated stocks appears to be weak and the applied Gaussian and t copulas lead to values
that are similar to the linear correlation coefficients reported in Table 1. According to the AIC
information criterion, it is the t copula that adequately describes the dependence between all
assets. Although the dependence per se is weak, the t copula indicates significant tail
dependence. Moreover, the relatively small values for the degrees of freedom also underline
the existence of the tail dependence between gold and sectorial Chinese stocks which could be
interpreted that extreme events tend to occur jointly in gold and stock markets.
</div>
<span class='text_page_counter'>(16)</span><div class='page_container' data-page=16>
2013, Sadorsy 2014). Thus, as a robustness check, we will investigate the tail dependence
between oil and sectorial stocks in China and also its insights in the diversification of
portfolios in Section 6 below. How can investors profit from this tail dependence in their asset
allocation? It is what we would like to study in the next section.
<b>5.2.</b> <b>Insights for the diversification of portfolios </b>
As explained in the Introduction and Section 3, to investigate the profit of the tail dependence
between gold and sectorial stocks in China, we base on the comparison of four types of
portfolios: 100% stocks, 50% stocks+50% gold, and weights of gold determined in the
minimal-variance portfolio (Markowitz, 1952) and by the optimal weight proposed by Kroner
and Ng (1998). The first sub-section will focus on the efficient frontier analysis while the
second sub-section will compare the four above-mentioned portfolios using the hedging
effectiveness measure (Ku et al., 2007).
<b>5.2.1 Efficient frontiers </b>
We apply the classical Markowitz approach and minimize the portfolio variance with respect
to the expected portfolio return. In this context, we consider two different setups: (a) a
portfolio in the absence of short selling (only positive weights of assets), where the maximum
weight for each individual asset is set to 30% and to ensure a realistic risk diversification, (b)
a portfolio in the presence of short selling (with also negative weights of assets), where the
minimum and maximum weight of each individual asset is set to between -30% and 30%.
For both setups, we examine the following two scenarios:
1.) The portfolio manager exclusively invests in Chinese stocks.
2.) The portfolio manager invests in Chinese stocks and gold.
<b>The relevant efficient frontiers are illustrated in Figure 2. </b>
<b>Figure 2: Mean-Variance efficient frontiers </b>
</div>
<span class='text_page_counter'>(17)</span><div class='page_container' data-page=17>
Note: The graphs show the mean-variance efficient frontiers for three different portfolios: (1) including all sectorial Chinese
stocks, (2) including all sectorial Chinese stocks + gold, and (3) including all sectorial Chinese stocks + oil. The latter
portfolio serves as a robustness check and is discussed in Section 6.
Figure 2 plots the mean-variance efficient frontiers for the two above-mentioned scenarios
without short sales (Panel A) and with short sales (Panel B). Obviously, adding gold leads to
portfolios that are characterized by lower risk for a given expected return and a higher return
for a given level of risk. This is because the efficient frontiers with gold are both higher than
the one with only stocks (with all sectors together or each sector separately). As can be seen
in Panel B, including short sales does not change the result qualitatively. To stress this
finding, we compare the portfolio allocations that lead to the minimum degree of risk for each
scenario (i.e. the minimal-variance portfolio). For a given investment of 1,000,000 Yuan, the
respective amounts for the expected return and risk of each portfolio are presented in Table 6.
In addition, Figure 3 shows the weights of each asset included in these portfolios presented in
boxplot diagrams.
<b>Table 6: Minimal-variance portfolios in three different scenarios with and without short </b>
<b>selling </b>
<b>In Yuan </b> <b>Expected return </b> <b>Expected risk </b>
<i>Without short selling </i>
Only stocks 531.60 13535.93
Stocks + Gold 404.84 10499.87
<i>With short selling </i>
Only stocks
Stocks + Gold
395.54
305.50
12870.04
9797.50
Note: Risk is given by the standard deviation. The figures in this table show the
return and standard deviation based on 1,000,000 Yuan invested in the
minimal-variance portfolio.
Obviously, adding gold to Chinese stock portfolios5 lowers the risk. However, we notice
that the expected return of the only-stock portfolio is higher than the ones with gold. This is
explained by the fact that within the study period (2009-2015), the rates of return for stocks
were higher than the ones for gold (see Table 2).
</div>
<span class='text_page_counter'>(18)</span><div class='page_container' data-page=18>
<b>Figure 3: The weight of each asset in the minimal-variance portfolios </b>
Note: The graph presents the portfolio weights for each asset as a boxplot diagram. The central mark in the box indicates the
median, the edges of the box are the 25th and 75th percentiles and the whiskers limits describe the extreme data points. Not
considered outliers are marked individually (in red). The assets are numbered on the horizontal axis according to their
appearance order in the tables. 1=Discretionary, 2=Staples, 3=Energy, 4=Financials, 5=Health Care, 6=Industrials,
7=Information, 8=Materials, 9=Telecom, 10=Utilities, 11=Gold or Oil. The graphs in the first (second) line refer to the case
without (with) short selling. The portfolio weights including oil are discussed in Section 6.
In Figure 3, the weight of each asset in the minimal-variance portfolios is shown (we refer
to the portfolio composed of all stock sectors). The sum of all the weights presented in the
graphs is always 100%, and the maximal weight for one asset is 30% and the minimal one is
-30% when short sales are used. The graphs in the first line (without short sales) show that
when gold is not included, the minimal-variance portfolio is composed of six sectors
essentially: Consumer Discretionary, Consumer Staples, Financials, Health Care, Information
and Utilities. When gold is included, the weight of the Financials, the Information, and the
Utilities sector becomes 0 and the weight of the Energy, Industrials and Materials sectors
increased strongly. The weight of gold is around 0 and 15% in 50% of the portfolios. As we
showed in Table 6, including gold lowers the return but also the standard deviation. Overall,
the graphs in the first line (without short sales) show that the composition of assets can
change significantly when including gold into sectorial stock portfolios. The graphs in the
second line show that the weight of each sector also changes when using short sales.
Furthermore, the weight of gold is very large in each portfolio, i.e. 30%. This finding suggests
that gold should be more efficient in the diversification of portfolios when allowing for short
sales. The results in Table 6 also show that the standard deviation of the minimal-variance
portfolio is even lower using short sales.
</div>
<span class='text_page_counter'>(19)</span><div class='page_container' data-page=19>
Energy sectors present a relevant investment. However, if we allow for short selling, Energy,
Materials and Telecom are characterized by larger weights. Furthermore, in the absence of
short selling, adding gold leads to lower weights on Financials, Information and Utilities but
to larger weights on Energy, Industrials and Materials. In the presence of short selling, adding
gold leads to larger weights on Financial and Industrials. To have a clearer view on the effect
of gold in each stock sector, we continue our analysis with four different types of portfolios
for each sector diversified with gold.
<b>5.2.2.</b> <b>Hedging effectiveness of gold in Chinese sectorial stock portfolios </b>
In this section, we will compare only-stock portfolios (PF1) with three other ones: PF2 is
composed of 50% of stock and 50% of gold; PF3 is composed following the
minimal-variance portfolio taken from the mean-minimal-variance efficient frontier; and PF4 is composed
following the optimal weight of gold calculated using the CCC-GARCH model (Kroner and
Ng, 1998). Table 7 presents the weight of gold in PF3 and PF4 as well as the hedge ratio
(Kroner and Sultan, 1993) for each sector.
<b>Table 7: The weight of gold in PF3, PF4 and the hedge ratio </b>
<b>Sectors </b> <b>PF3 : Minimal-Variance </b> <b>PF4 : CCC-GARCH </b> <b>Hedge ratio </b>
<b>Discretionary </b> 68.52% 68.00% 17.60%
<b>Staples </b> 64.49% 64.17% 16.26%
<b>Energy </b> 75.49% 74.64% 23.61%
<b>Financials </b> 70.05% 69.16% 15.35%
<b>Health Care </b> 68.02% 67.91% 15.53%
<b>Industrials </b> 64.40% 64.64% 14.04%
<b>Information </b> 74.95% 74.68% 17.29%
<b>Materials </b> 76.15% 74.93% 34.16%
<b>Telecommunication </b>71.19% 71.33% 15.85%
<b>Utilities </b> 58.50% 58.12% 9.99%
Note: The calculations of these values are explained in Section 3.
</div>
<span class='text_page_counter'>(20)</span><div class='page_container' data-page=20>
that the sectors in which gold is involved in their activities (such as Energy, Information and
Materials) are the most suitable to be diversified with gold investments.
As for the hedge ratio (or beta), it means that a long position of 100 Yuan on the stock
segment must be hedged by a short position on gold whose value corresponds to the hedge
ratio. The last column of Table 7 shows that investors should take a short position on gold
between about 10 and 34 Yuan using future contracts available on the Shanghai Gold
Exchange. The highest value of the short position on gold is with the Materials sector and the
lowest one is for the Utilities sector. Again, we find that stocks of the Materials sector are the
most suitable to be diversified with gold.
Table 8 presents the hedging effectiveness (Ku et al., 2007) when gold is included in
Chinese sectorial stock portfolios.
<b>Table 8: Hedging effectiveness </b>
<b>Sectors </b> <b>PF2: 50% Stocks </b> <b>PF3: Minimal-variance </b> <b>PF4: CCC-GARCH </b>
Discretionary 57.51% 62.04% 62.04%
Staples 55.08% 58.01% 58.01%
Energy 60.26% 68.01% 68.00%
Financials 58.99% 64.26% 64.25%
Health Care 58.02% 62.41% 62.41%
Industrials 55.95% 58.89% 58.89%
Information 62.24% 70.00% 70.00%
Materials 57.34% 65.01% 65.00%
Telecommunication 60.11% 65.96% 65.96%
Utilities 52.55% 53.68% 53.68%
Note: This table presents the hedging effectiveness of PF2, PF3 and PF4 (including gold) compared to PF1 (only
stocks) as presented in Section 3. The higher the value, the greater the hedging effectiveness is.
From Table 8, we note that in all cases, including gold helps to reduce the volatility of
returns of Chinese sectorial stock portfolios. The hedging effectiveness is between 53% and
70%. We also notice that the hedging effectiveness is greater for minimal-variance portfolios
and CCC-GARCH portfolios than for the equal-weighted one where the share of gold in the
portfolio is lower. The Information sector has the highest hedging effectiveness (70%),
followed by Energy (68%) and Materials (65%). Again, the Utilities sector has the lowest
hedging effectiveness (53%).
<b>6.</b> <b>Robustness check: Is oil a better hedge than gold? </b>
</div>
<span class='text_page_counter'>(21)</span><div class='page_container' data-page=21>
oil can have similar behavior regarding their relationship with stocks (e.g., Mensi et al., 2013;
Ewing and Malik, 2013; Sadorsy, 2014). The objective of this section is thus to verify this
conjecture in the Chinese context. For that, we will conduct the same calculations as we have
done for gold, meaning GJR-GARCH filter, tail dependence with different copulas, efficient
frontiers, and the comparison between four types of portfolios. We use oil prices provided by
the West Texas Intermediate (WTI) which have been taken from the website of the Federal
Reserve Bank of Saint Louis. These are nominal prices expressed in the USD. Thus, to be
consistent with data on stocks and gold prices, we convert oil prices into the Chinese Yuan
using the exchange rate, also available on the website of the Federal Reserve Bank of Saint
Louis. In order to save space, the corresponding tables are presented in the Appendix and we
will only briefly discuss the main findings in this section.
Our findings on copula parameters (Appendix 1) show that the t-copula also dominates
other copulas for the tail dependence between oil and sectorial stocks. We find that the
magnitude of the tail dependence between oil and sectorial stocks is also similar to the case of
gold. However, the degrees of freedom for the t-copula are a bit higher for oil than for gold.
Consequently, the tail dependence between gold prices and Chinese stocks is stronger than
between oil prices and Chinese stocks. This means that the likelihood of extreme joint
movements with stocks tends to be higher for gold than for oil. This suggests that Chinese
stocks tend to react more to extreme variations of gold prices quoted on the Shanghai Gold
Exchange than international oil prices. Moreover, following the t-copula results, the tail
dependence between oil and the Energy sector is the highest, followed by the Financials,
Industrials and Telecommunication sectors. This is different from gold for which the highest
t-copula value is with the Materials sector, followed by the Energy, Industrials and
Information sectors. This difference may be explained by the fact that gold can be used in the
production system of the Materials sectors while oil can be used in Energy firms.
</div>
<span class='text_page_counter'>(22)</span><div class='page_container' data-page=22>
As for the weight of oil in PF3 and PF4 (Appendix 3), we notice that, in all cases, the
optimal weight of gold is higher than the one of oil (about 70% vs. 40%). This suggests that
gold is more efficient to reduce the risk of Chinese stock portfolios than oil. The sectors for
which the weights of gold are the highest are Energy, Information and Materials (ranging
from 74% to 76%). For oil, the sectors are also the same but the weights of oil are much lower
than gold, ranging from 42% to 44%. As for the hedge ratio (Appendix 3), the highest value
of the short position on gold is with the Materials sector and the lowest one is for the Utilities
sector. For oil, these values are 5 and 15 Yuan for the Health Care and Utilities sectors,
respectively. Finally, referring to the hedging effectiveness (Appendix 4), in all cases, gold is
more efficient than oil. The Information sector has the highest hedging effectiveness and the
Utilities sector has the lowest one, with both oil and gold.
Overall, this robustness check shows that gold and oil have effectively similar impacts on
Chinese sectorial stocks with similar copula coefficients and similar impact on the efficient
frontier of Chinese sectorial stock portfolios. However, the principal difference is that gold
quoted on the Shanghai Gold Exchange tends to interact more than oil with Chinese stocks.
Furthermore, oil tends to be more correlated with the Energy sector while for gold, it is the
Materials sector. To our opinion, this result is consistent with the implication of oil in the
Energy sector and gold in the Materials sector. In general, oil offers higher rate of return but
also higher risk than gold. This implies that the weight of gold to include in Chinese sectorial
stock portfolios is higher than that of oil to minimize the risk (measured by the variance or
conditional variance). In all cases, stocks of the Utilities sector seem to be the less efficient in
the diversification with either gold or oil. Finally, gold has a higher hedging effectiveness
than oil in Chinese sectorial stock portfolios.
<b>7.</b> <b>Conclusion </b>
</div>
<span class='text_page_counter'>(23)</span><div class='page_container' data-page=23>
robustness check, we have also compared gold to oil since it is well known that these two
commodities can have similar impacts on stock portfolios. Our results show that gold quoted
on the Shanghai Stock Exchange is more effective than oil in Chinese stock portfolios.
Furthermore, oil tends to be more efficient with stocks of the Energy sector while for gold, it
is the Materials sector. Overall, our findings show that investors who are interested in Chinese
stocks can use gold quoted on the Shanghai Gold Exchange to diversify their portfolios which
is now opened to both domestic and international investors. Oil can also be considered to
reduce the risk of Chinese portfolios. However, gold is more efficient. The sectors which are
the most consistent with gold and oil are Energy, Information, Telecommunication and
Materials. The sector which is the less efficient when being diversified with gold and oil is
Utilities.
<b>References </b>
Agyei-Ampomah, S., Gounopoulos, D., Mazouz, K., 2014. Does gold offer a better protection against losses in
<i>sovereign debt bonds than other metals? Journal of Banking and Finance 40, 507-521. </i>
<i>Anand, R., Madhogaria, S., 2012. Is gold a “safe-haven”? – An econometric analysis. Procedia Economics and </i>
<i>Finance 1, 24-33. </i>
<i>Antonakakis, N., Kizys, R., 2015. Dynamic spillovers between commodity and currency markets. International </i>
<i>Review of Financial Analysis, In Press. </i>
<i>Apergis, N., 2014. Can gold prices forecast the Australian dollar movements? International Review of </i>
<i>Economics and Finance 29, 75-82. </i>
Arouri, M., Jouini, J., Nguyen, D.K., 2011. Volatility spillovers between oil prices and stock sector returns:
<i>Implications for portfolio management. Journal of International Money and Finance, 30, 1387-1405. </i>
Arouri, M., Lahiani, A., Nguyen, D.K. (2015). World gold prices and stock returns in China: Insights for
<i><b>hedging and diversification strategies. Economic Modelling, 44, 273-282. </b></i>
Auer, B.R., 2015. Does the choice of performance measure influence the evaluation of commodity investments?
<i>International Review of Financial Analysis 38, 142-150. </i>
<i>Blose, L.E., 1996. Gold price risk and the returns on gold mutual funds. Journal of Economics and Business 48, </i>
499-513.
<i>Baur, D.G., Lucey, B.M., 2010. Is gold a hedge or a safe haven? An analysis of stocks, bonds and gold. The </i>
<i>Financial Review 45, 217-2209. </i>
Baur, D.G., 2011. Explanatory mining for gold: Contrasting evidence from simple and multiple regressions.
<i>Resources Policy 36, 265-275. </i>
<i>Baur, D.G., Löffler, G., 2015. Predicting the equity premium with the demand for gold coins and bars. Finance </i>
<i>Research Letters, In Press. </i>
<i>Baur, D.G., McDermott, T.K., 2010. Is gold a safe haven? International evidence. Journal of Banking and </i>
<i>Finance 34, 1886-1898. </i>
Beckmann, J., Berger, T., Czudaj, R., 2015a. Does gold act as a hedge or a safe haven for stocks? A smooth
<i>transition approach. Economic Modelling 48, 16-24. </i>
<i>Beckmann, J., Berger, T., Czudaj, R., 2015b. Oil price and FX-rates dependency. Quantitative Finance, In Press. </i>
<i>Blose, L.E., Shieh, J.C.P., 1995. The impact of gold price on the value of gold mining stock. Review of Financial </i>
<i>Economics 4(2), 125-139. </i>
Bredin, D., Conlon, T., Potì, V., 2015. Does gold glitter in the long-run? Gold as a hedge and safe haven across
<i>time and investment horizon. International Review of Financial Analysis, In Press. </i>
</div>
<span class='text_page_counter'>(24)</span><div class='page_container' data-page=24>
Caporale, G.M., Menla Ali, F., Spagnolo, N. (2014). Oil price uncertainty and sectorial stock returns in China: A
<i>time-varying approach. China Economic Review, In Press. </i>
<i>Cheng, A.L.H. (2014). China’s gold market: progress and prospects. World Gold Council Report. </i>
Chkili, W., Aloui, C., Nguyen, D.K., 2014. Instabilities in the relationships and hedging strategies between crude
<i>oil and US stock markets: Do long memory and asymmetry matter? Journal of International Financial </i>
<i>Markets, Institutions and Money 33, 354-366. </i>
<i>Chua, J.H., Sick, G., Woodward, R.S., 1990. Diversifying with gold stocks. Financial Analysts Journal 46(4), </i>
76-79.
Choundhry, T., Hassan, S.S., Shabi, S., 2015. Relationship between gold and stock markets during the global
<i>financial crisis: Evidence from nonlinear causality tests. International Review of Financial Analysis, In Press. </i>
Ciner, C., Gurdgiev, C., Lucey, B.M., 2013. Hedges and safe havens: An examination of stocks, bonds, gold, oil
<i>and exchange rates. International Review of Financial Analysis, 29, 202-211. </i>
Conrad, C., Loch, K., Rittler, D., 2014. On the macroeconomic determinants of long-term volatilities and
<i>correlations in U.S. stock and crude oil markets. Journal of Empirical Finance 29, 26-40. </i>
Daskalaki, C., Skiadopoulos, G., 2011. Should investors include commodities in their portfolios after all? New
<i>evidence. Journal of Banking and Finance 35, 2606-2626. </i>
<i>Davidson, S., Faff, R., Hillier, D., 2003. Gold exposures in international asset pricing. Journal of International </i>
<i>Financial Markets, Institutions and Money 13, 271-289. </i>
<i>Engle, R.F., Kroner, K.F., 1995. Multivariate simultaneous generalized ARCH. Economic Theory 11, 122-150. </i>
Ewing, B.T., Malik, F., 2013. Volatility transmission between gold and oil futures under structural breaks.
<i>International Review of Economics and Finance 25, 113-121. </i>
Flavin, T.J., Morley, C.E., Panopoulou, E., 2014. Identifying safe havens assets for equity investors through an
<i>analysis of the stability of shock transmission. Journal of International Financial Markets, Institutions and </i>
<i>Money 33, 137-154. </i>
Ghosh, S., Kanjilal, K., 2014. Co-movement of international crude oil price and Indian stock market: Evidences
<i>from nonlinear cointegration tests. Energy Economics. In Press. </i>
Gil-Alana, L.A., Yaya, O., 2014. The relationship between oil prices and the Nigerian stock market. An analysis
<i>based on fractional integration and cointegration. Energy Economics 46, 328-333. </i>
Glosten L, Jaganathan R, Runkle D. 1993. On the relation between the expected value and the volatility of the
<i>nominal excess return on stocks. Jornal of Finance 48, 1779-1801. </i>
Gürgün, G., Ünalmis, I., 2014. Is gold a safe haven against equity market investment in emerging and
<i>developing countries. Finance Research Letters 11, 341-348. </i>
Hammoudeh, S., Santos, P.A., Al-Hassan, A., 2013. Downside risk management and VaR-based optimal
<i>portfolios for precious metals, oil and stocks. North American Journal of Economics and Finance 25, </i>
318-334.
<i>Hoang, T., Lahiani, A., Nguyen, D.K., 2015. Is gold a hedge against inflation? New evidence from a nonlinear </i>
<i>ARDL approach. Working Paper. </i>
Hoang, T., Wong, W.K., Zhu, Z.Z., 2015. Is gold different for risk-averse and risk-seeking investors? An
<i>empirical analysis of the Shanghai Gold Exchange. Economic Modelling 50, 200-211. </i>
Hood, M., Malik, F., 2013. Is gold the best hedge and a safe haven under changing stock market volatility?
<i>Review of Financial Economics 22, 47-52. </i>
<i>Jaffe, J.F., 1989. Gold and gold stocks as investments for institutional portfolios. Financial Analysts Journal </i>
49(2), 53-59.
Jain, A., Ghosh, S., 2013. Dynamics of global oil prices, exchange rate and precious metal prices in India.
<i>Resources Policy 38, 88-93. </i>
<i>Joe H. 1996. Families of m-variate distributions with given margins and m(m-1)/2 bivariate dependence </i>
parameters. In Ruschendorf L, Schweizer B, Taylor MD (eds.) Distributions with Fixed Margins and Related
Topics, vol. 28, IMS Lecture Notes Monograph Series, 120-141.
<i>Joy, M., 2011. Gold and the US dollar: Hedge or haven? Finance Research Letters 8, 120-131. </i>
Kang, W., Ratti, R.A., Yoon, K.H., 2015. The impact of oil price shocks on the stock market return and volatility
<i>relationship. Journal of International Financial Markets, Institutions and Money 34, 41-54. </i>
</div>
<span class='text_page_counter'>(25)</span><div class='page_container' data-page=25>
<i>Kroner, K.F., Ng, V.K., 1998. Modelling asymmetric movements of asset prices. Review of Financial Studies, </i>
11, 844-871.
Ku, Y.H., Chen, H., Chen, K., 2007. On the application of the dynamic conditional correlation model in
<i>estimating optimal time-varying hedge ratio. Applied Economics Letters 7, 503-509. </i>
Kumar, D. 2014. Return and volatility transmission between gold and stock sectors: Application for portfolio
<i>management and hedging effectiveness. IIMB Management Review 26, 5-16. </i>
<i>Longin, F., Solnik, B., 2001. Extreme correlation of international equity markets. Journal of Finance 56, </i>
649-676.
<i>Liu, L., Ma, F., Wang, Y., 2015. Forecasting excess stock returns with crude oil market data. Energy Economics, </i>
In Press.
Lucey, B.M., Larkin, C., O’Connor, F.A., 2014. Gold markets around the world – Who spills over what, to
<i>whom, when? Applied Economics Letters 21, 887–892. </i>
<i>Lucey, B., Tully, E., Poti, V., 2006. International portfolio formation, skewness and the role of gold. Frontiers in </i>
<i>Finance and Economics 3(1), 49-67. </i>
<i>Luode, X., 2014. The development and opening of the China’s gold market. Alchimist 75, 6-8. </i>
<i>Malliaris, A.G., Malliaris, A.G., 2015. What drives gold returns? A decision tree analysis. Finance Research </i>
<i>Letters, In Press. </i>
<i>Mandaleno, M., Pinho, C., 2014. Wavelet dynamics for oil-stock world interactions. Energy Economics 45, </i>
120-133.
<i>Markowitz, H.M., 1952. Portfolio selection. Journal of Finance 7, 77-91. </i>
<i>McDonald, J.G., Solnik, B.H., 1977. Valuation and strategy for gold stocks. Journal of Portfolio Management 3, </i>
29-33.
<i>Michis, A.A., 2014. Investing in gold: Individual asset risk in the long run. Finance Research Letters 11, </i>
369-374.
Mensi, W., Beljid, M., Boubaker, A., Managi, S., 2013. Correlations and volatility spillovers across commodity
<i>and stock markets: Linking energies, food and gold. Economic Modelling 32, 15-22. </i>
<i>Narayan, P.K., Gupta, R., 2015. Has oil price predicted stock returns for over a century? Energy Economics 48, </i>
18-23.
Narayan, P.K., Narayan, S., Sharma, S.S., 2013. An analysis of commodity markets: What gain for investors?
<i>Journal of Banking and Finance 37, 3878-3889. </i>
<i>Narayan, P.K., Liu, R., 2011. Are shocks to commodity prices persistent? Applied Energy 88(1), 409-416. </i>
<i>O’Connor, F.A., 2015. The financial economics of gold – A survey. SSRN working paper. </i>
Phan, D.H.B., Sharma, S.S., Narayan, P.K., 2015. Oil price and stock returns of consumers and producers of
<i>crude oil. Journal of International Financial Markets, Institutions and Money 34, 245-262. </i>
Roboredo, J.C., 2015. Is there dependence and systemic risk between oil and renewable energy stock prices?
<i>Energy Economics 48, 32-45. </i>
Roboredo, J.C., 2013. Is gold a safe haven or a hedge for the US dollar? Implications for risk management.
<i>Journal of Banking and Finance 37, 2665-2676. </i>
Reboredo, J.C., Rivera-Castro, M.A., 2014a. Can gold hedge and preserve value when the US dollar depreciates?
<i>Economic Modelling 39, 168-173. </i>
Reboredo, J.C., Rivera-Castro, M.A., 2014b. Gold and exchange rates: Downside risk and hedging at different
<i>investment horizons. International Review of Economics and Finance 34, 267-279. </i>
Sadorsy, P., 2014. Modelling volatility and conditional correlations between socially responsible investments,
<i>gold and oil. Economic Modelling 38, 609-618. </i>
<i>Sherman, E.J., 1982. Gold: A conservative, prudent diversifier. The Journal of Portfolio Management 8(3), </i>
21-27.
<i>Sklar C. 1959. Fonctions de répartition à n dimensions et leurs marges. Publications de l’Institut Statistique de </i>
<i>l’Université de Paris 8, 229-231. </i>
<i>Soucek, M., 2013. Crude oil, equity and gold futures open interest co-movements. Energy Economics 40, </i>
306-315.
<i>Thomson Reuters, GFMS Gold Survey 2014. </i>
</div>
<span class='text_page_counter'>(26)</span><div class='page_container' data-page=26>
<i>Wang, Z., 2011. The Shanghai gold exchange and its future development. Alchemist 63, 17-20. </i>
<i>Wang, K.W., Lee, Y.M., 2011. The yen for gold. Resources Policy 36, 39-48. </i>
World Gold Council, 2014. China’s gold market: progress and prospects. April 2014.
Ziaei, S.M., 2012. Effects of gold price on equity, bond and domestic credit: Evidence from ASEAN+3.
<i>Procedia Social and Behavioral Sciences 40, 341-346. </i>
<b>Appendix </b>
<b>1.</b> <b>Copula parameters with oil </b>
<b>Gold</b> <b>Discretionary Staples Energy Financials Health Care Industrials Information Materials Telecommunication Utilities </b>
<b>Gauss</b> 0,14 0,11 0,09 0,15 0,13 0,06 0,13 0,08 0,12 0,10 0,10
<b>AIC</b> -23,38 -12,82 -7,90 -27,13 -20,76 -3,13 -19,04 -7,27 -16,79 -12,51 -12,44
<b>t</b> 0,13 0,10 0,08 0,15 0,14 0,06 0,12 0,08 0,12 0,10 0,10
<b>DoF</b> 11,47 30,12 21,53 27,36 15,07 30,04 21,65 17,94 19,38 16,53 63,54
<b>AIC</b> -33,38 -14,23 -10,41 -28,76 -27,46 -4,49 -21,78 -11,35 -19,74 -16,96 -12,76
<b>Frank</b> 0,74 0,56 0,37 0,77 0,79 0,28 0,65 0,37 0,61 0,48 0,56
<b>AIC</b> -17,69 -9,16 -3,02 -19,33 -20,20 -0,84 -13,31 -3,04 -11,06 -6,36 -9,49
<b>Clayton</b> 0,16 0,11 0,09 0,15 0,15 0,06 0,14 0,08 0,11 0,10 0,10
<b>AIC</b> -25,46 -12,27 -6,73 -20,05 -20,28 -2,36 -19,01 -4,86 -11,22 -9,06 -10,10
<b>Gumbel</b> 1,08 1,05 1,05 1,09 1,07 1,03 1,07 1,05 1,07 1,06 1,06
<b>AIC</b> -22,53 -7,09 -7,38 -25,41 -15,98 -1,09 -13,65 -7,62 -15,81 -14,08 -9,48
<b>2.</b> <b>Return and risk of the minimal-variance portfolio with oil </b>
<b>In Yuan </b> <b>Expected return Expected risk </b>
<i>Without short selling </i>
Only stocks 531.60 13535.93
Stocks + Gold 404.84 10499.87
Stocks + Oil
<i>With short selling </i>
Only stocks
Stocks + Gold
Stocks + Oil
452.65
395.54
305.50
375.54
11983.45
12870.04
9797.50
11506.78
<b>3.</b> <b>The weight of gold and oil in each portfolio </b>
<b>PF3: Minimal-variance </b> <b>PF4: CCC-GARCH </b> <b>Hedge ratio </b>
<b>Sectors </b> <b>Gold </b> <b>Oil </b> <b>Gold </b> <b>Oil </b> <b>Gold </b> <b>Oil </b>
Discretionary 68.52% 36.59% 68.00% 38.33% 17.60% 8.67%
Staples 64.49% 32.81% 64.17% 34.57% 16.26% 8.00%
Energy 75.49% 43.36% 74.64% 44.15% 23.61% 15.42%
Financials 70.05% 38.09% 69.16% 39.57% 15.35% 11.52%
Health Care 68.02% 36.95% 67.91% 38.98% 15.53% 5.38%
Industrials 64.40% 32.24% 64.64% 34.50% 14.04% 10.87%
Information 74.95% 44.82% 74.68% 46.60% 17.29% 7.75%
Materials 76.15% 42.00% 74.93% 42.99% 34.16% 12.98%
</div>
<span class='text_page_counter'>(27)</span><div class='page_container' data-page=27>
<b>4.</b> <b>Hedging effectiveness </b>
<b>PF2: 50% Stocks </b> <b>PF3: Minimal-variance </b> <b>PF4: CCC-GARCH </b>
<b>Gold </b> <b>Oil </b> <b>Gold </b> <b>Oil </b> <b>Gold </b> <b>Oil </b>
Discretionary 57.51% 42.23% 62.04% 31.84% 62.04% 31.77%
Staples 55.08% 34.30% 58.01% 28.58% 58.01% 28.50%
Energy 60.26% 52.28% 68.01% 36.23% 68.00% 36.22%
Financials 58.99% 44.84% 64.26% 31.88% 64.25% 31.83%
Health Care 58.02% 43.30% 62.41% 33.97% 62.41% 33.87%
Industrials 55.95% 33.50% 58.89% 26.24% 58.89% 26.11%
Information 62.24% 55.92% 70.00% 41.00% 70.00% 40.93%
Materials 57.34% 50.22% 65.01% 36.03% 65.00% 36.01%
</div>
<!--links-->