Statistical optimization of activated carbon from Thapsia transtagana stems and dyes removal efficiency using central composite design
Bạn đang xem bản rút gọn của tài liệu. Xem và tải ngay bản đầy đủ của tài liệu tại đây (2.32 MB, 10 trang )
<span class='text_page_counter'>(1)</span><div class='page_container' data-page=1>
Original Article
Statistical optimization of activated carbon from
Thapsia transtagana
stems and dyes removal ef
fi
ciency using central composite design
A. Machrouhi
a, H. Alilou
a,b, M. Farnane
a, S. El Hamidi
a, M. Sadiq
a, M. Abdennouri
a,
H. Tounsadi
c,*, N. Barka
a,**a<sub>Sultan Moulay Slimane University of Beni Mellal, Research Group in Environmental Sciences and Applied Materials (SEMA), FP Khouribga, B.P. 145, 25000</sub>
Khouribga, Morocco
b<sub>Facult</sub><sub></sub><sub>e Polydisciplinaire de Taroudant, Universit</sub><sub></sub><sub>e Ibn Zohr, Agadir, Morocco</sub>
c<sub>Laboratoire d'Ing</sub><sub></sub><sub>enierie, d'Electrochimie, de Mod</sub><sub></sub><sub>elisation et d'Environnement, Universit</sub><sub></sub><sub>e Sidi Mohamed Ben Abdellah, Facult</sub><sub></sub><sub>e des Sciences Dhar El</sub>
Mahraz, Fes, Morocco
a r t i c l e i n f o
Article history:
Received 29 March 2019
Received in revised form
21 August 2019
Accepted 7 September 2019
Available online 13 September 2019
Keywords:
Thapsia transtaganastems
Dyes removal
Chemical activation
Central composite design
a b s t r a c t
This study focused on the preparation of activated carbons fromThapsia transtaganastems by boric acid
activation and their evaluation for dyes removal. The central composite design and response surface
methodology were used to optimize the preparation conditions. The effect of activation temperature,
impregnation ratio and activation time on iodine number (IN), methylene blue index (MB index) and
removal efficiencies of methyl violet (MV), methyl orange (MO) and indigo carmine (IC) were fully
evaluated. The activated carbon samples prepared in optimal conditions were characterized by FTIR,
XRD, SEM-EDX, Boehm's titration, and point of zero charge (pHPZC). The equilibrium data for dyes
sorption onto optimum activated carbons were bestfitted with Langmuir isotherm.
©2019 Publishing services by Elsevier B.V. on behalf of Vietnam National University, Hanoi. This is an
open access article under the CC BY license ( />
1. Introduction
Nowadays, the extensive uses of textile dyes are considered the
main sources of water pollution [1]. It has been estimated that
10%e15% of the dye used during the manufacturing of textile
products are released into the environment worldwide annually
[2]. Moreover, many of these organic compounds can cause
al-lergies, skin irritation or even cancer and human mutations[3]. It is,
therefore, essential to remove dyes from wastewater and water
reuse to avoid contamination and destruction of natural resources.
Currently, there are numerous methods employed to remove
dye molecules from aqueous solutions including adsorption [4],
precipitation [5], ion-exchange [6], coagulation [7], membrane
filtration [8], photocatalytic degradation [9], etc. Among these
processes, the adsorption is more applicable because it is an effi
-cient, simple and economic method for the removal of dyes from
aqueous solutions[10,11]. For that, various types of low-cost, easily
available and highly effective adsorbents are reported such as
activated carbon, zeolite, clay, polymer, and nanomaterials[12e16].
From economic point of view, the process of adsorption onto
activated carbon is advantageous due to the plentiful accessibility
of low cost raw material. Also, activated carbon is basically
referred as carbonaceous materials, with a high physicochemical
stability, high porosity, high sorption capacity and with immense
surface area.
Recently, many studies have been carried out to investigate the
use of inexpensive biomasses to produce low-cost activated
car-bons using agricultural solid wastes including coffee ground[17],
Carob shell[18], Diplotaxis harra[19],Glebionis coronariaL.[20],
maize corncob [21], beetroot seeds [22], apricot stones [23],
hazelnut shells[24]and loofah sponge[25].
Activated carbon can be produced in a two-step process:
carbonization and activation. Carbonization is usually conducted
via pyrolysis at temperatures of 400e850C in the absence of
ox-ygen[26]. The activation process converts carbonized materials to
activated carbon via heating. Carbon dioxide, air or steam is used as
a physical activation method to develop the porosity of the
carbo-naceous materials. The increase of surface area and the pore
vol-ume is achieved through the elimination of internal carbon mass
*Corresponding author.
**Corresponding author. Fax:ỵ212 523 49 03 54.
E-mail addresses:(H. Tounsadi),barkanoureddine@
yahoo.fr(N. Barka).
Peer review under responsibility of Vietnam National University, Hanoi.
Contents lists available atScienceDirect
Journal of Science: Advanced Materials and Devices
j o u r n a l h o m e p a g e : w w w . e l s e v i e r . c o m / l o c a t e / j s a m d
/>
</div>
<span class='text_page_counter'>(2)</span><div class='page_container' data-page=2>
and the removal of volatiles[27]. However, in chemical activation,
the carbonization temperature is done only between 400 and
600C. This method highlights an impregnation of the precursor or
raw material with dehydrating agents such as alkali metal
hy-droxide or acid. This method produces an activated carbon with
higher yield and well developed microporosities.
The objective of this research was to investigate the feasibility of
activated carbon produced from Thapsia transtagana stems
biomass, by H3BO3 activation and their ability for cationic and
anionic dyes removal from aqueous solution. Central composite
design (CCD) combined with response surface methodology (RSM)
was used to optimize the process. The factors chosen are
impreg-nation ratio, activation temperature and activation time. Five
re-sponses including iodine number (IN), methylene blue index (MB
index) and removal efficiencies for methyl violet (MV), methyl
or-ange (MO) and indigo carmine (IC) are investigated.
2. Material and methods
2.1. Material
All the chemicals/reagents used in this study were of analytical
grade. H3BO3 (100%), HCl (37%), I2 (99.8e100.5%), Na2S2O35H2O,
Na2CO3, NaHCO3 (99.5e100.5%), commercial activated carbon
(powder form) (100%), methyl violet, methyl orange and indigo
carmine (100%) were purchased from SigmaeAldrich (Germany)
(100%). Methylene blue was purchased from Panreac (Spain)
(100%). HNO3 (65%) was provided from Sharlau (Spain). NaOH
(99%) from Merck (Germany), potassium iodide (KI) (100%) was
obtained from Pharmac (Morocco).
2.2. Preparation of activated carbons
TheT. transtaganaplant was collected from the region of Oued
zem, Morocco. Steams were cut into small pieces and were
powdered to a particles of size<125
m
m using a domestic mixer.15 g of the biomass were impregnated with H3BO3as the activating
agent at the desired mass ratio. Later, the sample was loaded in a
stainless steel vertical tubular reactor placed into a furnace under
puri<sub>fi</sub>ed nitrogen atmosphere. The obtained activated carbons were
washed with distilled water and dried at 105 C for 24 h. The
powder was sieved in particles of size lower than 125
m
m using anormalized sieve and kept in a hermetic bottle for a further use.
The impregnation ratio of the activating agent with the
pre-cursor was computed using Eq(1):
Impregnation ratio¼(dried weight of H3BO3/precursor of TTS) (1)
2.3. Design of experiments using central composite design
Central composite design (CCD) was used to study the individual
and synergetic effect of the three factors towards defined
re-sponses. This method can reduce the number of experimental trials
required to evaluate the main effect of each parameter and their
interactions[28]. It is characterized by three operations namely: 2n
factorial runs, 2n axial runs and six center runs[29]. For this case,
it's translated into eight factorial points, six axial points and six
replicates at the center which gives a total of 20 experiments as
calculated from Eq(2):
Total number of experiments (N)ẳ2nỵ2nỵnc (2)
where n is the number of factors, nc is the number of center points
(six replicates).
The independent variables were coded as <sub>ỵ</sub>1 and<sub></sub>1 which
represent the eight factorial points at their low and high levels,
respectively. The six axial points were located at (±
a
, 0, 0), (0,±a
,0), (0, 0,±
a
), and the six replicates were at the center (0, 0, 0) wererun to examine the experimental error and the reproducibility of
the data. Where
a
is the distance of axial point from center whichmakes the design rotatable; its value wasfixed at 1.682. This value
of rotatability
a
, which depends on the number of parameters inthe experiment, was obtained from the following equation[30]:
a
¼Np1/4 (3)In this study, the independent variables studied were activation
temperature (A), impregnation ratio (B) and activation time (C).
These three variables with their respective ranges were selected
based on the literature and preliminary studies as given inTable 1.
The responses were determined using the optimal quadratic
model predictor Eq.(4)given as:
Yẳb0ỵ
Xn
iẳ1bixiỵ
Xn
iẳ1biixi
!2
ỵ Xn-1<sub>i</sub><sub>ẳ</sub><sub>1</sub>Xn<sub>j</sub><sub>ẳ</sub><sub>1</sub><sub>ỵ</sub><sub>1</sub>bijxixj
(4)
0where Y is the predicted response, bois the offset term, bithe
linear effect, biithe squared effect, bijthe interaction effect and xi, xj
are the coded values of the variables considered.
The quality of thefit of the polynomial model was expressed by
the correlation coefficient (R2). The significance and adequacy of the
used model was further explained using F-value (Fisher variation
ratio), probability value (Prob>F), and adequate precision (AP)[31].
2.4. Iodine number (IN)
Iodine number is a measure of micropore content (0e2 nm) by
adsorption of iodine from solution. The iodine number is defined as
the milligrams of iodine adsorbed by 1.0 g of carbon when the
iodine concentration of thefiltrate is 0.02 N. It was determined
according to the ASTM D4607-94 method[32].
2.5. Methylene blue index (MB index)
The methylene blue index is a measure of mesoporosity
(2e50 nm) present in activated carbon. Sorption equilibrium
was established for different methylene blue initial
concentra-tions between 20 and 500 mg/L for 12 h at room temperature.
Residual concentrations were determined by a
spectrophoto-metric method at the wavelength of maximum absorbance of
665 nm[33].
2.6. Dyes removal
Stock solutions of methyl orange, methyl violet and indigo
carmine at 500 mg/L were prepared by dissolving 0.5 g of each dye
in 1 L of distilled water. Sorption experiments were investigated in
a series of beakers containing 50 mL of dyes solutions at 500 mg/L
Table 1
Process factors and their levels.
Variables Code Unit Coded variable levels
a 1 0 1 ỵa
Activation temperature A <sub>C</sub> <sub>366</sub> <sub>400</sub> <sub>450</sub> <sub>500</sub> <sub>534</sub>
Impregnation ratio B g/g 0.66 1 1.5 2 2.34
</div>
<span class='text_page_counter'>(3)</span><div class='page_container' data-page=3>
and 50 mg of each activated carbon. The mixtures were stirred for
2 h without any pH adjustment. After each sorption experiment,
samples were centrifuged at 3400 rpm for 10 min and the dyes
concentration was determined using a UVevis spectrophotometer.
The adsorption capacities of the dyes at equilibrium were
defined as the amount of adsorbate per gram of adsorbent (in mg/g)
and were calculated using the following equation:
qẳCoCị
R (5)
where q is the adsorbed quantity (mg/g),Cois the initial dye
con-centration (mg/L),Cis the residual dye concentration (mg/L), andR
is the mass of activated carbon per liter of aqueous solution (g/L).
2.7. Surface and chemical characterization
Textural properties of optimized activated carbon were
observed by scanning electron microscopy (SEM) using TESCAN
VEGA3-EDAX equipped with an Energy-Dispersive X-Ray detector
(EDX). The functional groups present on the surface of the starting
material and AC was determined by the Fourier Transform Infrared
(FTIR) spectroscope (FTIR-2000, PerkinElmer) in a range of
4000e400 cm1. Crystallographic characterization was examined
by XRD measurements in the 2
q
range from 10 to 70 using aBruker-axs D2-phaser advance diffractometer operating at 30 kV
and 10 mA with CuK
a
. The acidic and basic functional groups on thesurface of ACs were determined quantitatively by the Boehm's
titration method[34]. The pH of the point of zero charge (pHpzc)
was determined according to the method described by Noh and
Schwarz[35].
3. Results and discussion
3.1. Experimental results
The experimental results obtained at the designed experimental
conditions according to the central composite design are presented
in Table S1. From this table, it could be seen that the activated
carbon sample activated at 500C for 145 min with an
impregna-tion ratio of 2 g/g gives the optimum of MB index (188.75 mg/g),
MO adsorption (116.84 mg/g) and MV adsorption (140.76 mg/g. The
greater iodine number of 794.58 mg/g is obtained for the activated
carbon prepared at 450C for 130 min with an impregnation ratio
of 2.34 g/g. Under these same conditions, the optimum for IC
adsorption (44.87 mg/g) is also acquired.
On the other hand, the regression analysis was performed tofit
the response functions with the experimental data.Table 2shows
the values of the regression coef<sub>fi</sub>cients obtained. According to this
table, the three studied factors present a positive effect on thefive
responses. The table also indicates that the targeted responses are
more influenced by activation temperature and impregnation ratio
than by activation time.
3.2. Analysis of variance (ANOVA)
The analysis of variance (ANOVA) was used to determine the
significance of the curvature in the responses at a confidence level
of 95%. After discarding the insignificant terms, the ANOVA data of
the coded quadratic models for thefive responses are presented in
supplements (Tables S2eS6). The effect of a factor is defined as the
change in response produced by a change in the level of the factor.
This is frequently called a main effect because it refers to the
pri-mary factors of interest in the experiment. The ANOVA results
showed that the equations adequately represent the actual
relationship between each response and the significant variables.
The F value implies that the models are significant and the values of
“Prob>F”less than 0.05 indicate that model terms are significant.
Especially larger F-value with the associated P value (smaller than
0.05, confidence interval) means that the experimental systems can
be modeled effectively with less error. Therefore, interaction effects
as adequate model terms can be used for modeling the
experi-mental system.
3.2.1. Iodine number
According to the ANOVA analysis for the iodine number, the
significant terms are the activation temperature (A), impregnation
ratio (B), activation time (C), the interaction between activation
temperature and impregnation ratio (AB), the interaction between
impregnation ratio and activation time (BC), the quadratic term of
activation temperature (A2) and the quadratic term of activation
time (C2) Eq.(6).
Y1ẳ703.26ỵ44.10 Aỵ56.46 B0.74 C1.75 ABỵ1.75
BC28.35 A220.94 C2 (6)
The activation temperature, the impregnation ratio and the
interaction between impregnation ratio and activation time
showed a positive effect on the iodine number. Although, the
activation time, the interaction between activation temperature
and impregnation ratio, the quadratic term of activation
tempera-ture and the quadratic term of activation time showed a negative
effect on the iodine number. Besides, the impregnation ratio has the
largest significant effect on the iodine number due to the high
F-value (99.05) followed by the activation temperature, the quadratic
term of activation temperature and the quadratic term of activation
with an F-value of 60.43, 26.61, and 14.52, respectively (Table S2).
Hence, it could be seen that the number of micropores are higher
with the impregnation ratio of 2.34 g/g in the studied domain. In
fact, at the high level of the significant model terms, the activation
reaction may take place rapidly producing a development of
porosity of the obtained activated carbons and an increase in the
microporosity.
3.2.2. Methylene blue index
The most significant effects for the methylene blue index are
activation temperature (A), impregnation ratio (B), activation time
(C), interaction between activation temperature and impregnation
ratio (AB) and the quadratic term of impregnation ratio (B2) Eq.(7).
Y2ẳ133.98ỵ13.17 Aỵ29.11 Bỵ4.97 Cỵ10.04 AB9.90 B2(7)
The activation temperature, impregnation ratio, activation time
and interaction between activation temperature and impregnation
ratio showed a positive effect on the methylene blue index
response. Although, the quadratic term of the impregnation ratio
Table 2
Values of model coefficients of thefive responses.
Main coefficients Y1 Y2 Y3 Y4 Y5
b0 710.80 143.79 100.28 120.79 29.97
b1 46.15 13.17 9.69 6.89 4.01
b2 55.08 29.11 16.57 14.66 10.46
b3 1.30 4.97 2.19 4.46 2.08
b12 1.75 10.04 0.63 4.71 3.40
b13 5.24 1.84 1.81 0.61 0.03
b23 5.24 2.93 0.16 2.27 0.30
b11 27.52 7.78 3.93 5.15 3.29
b22 12.71 11.09 6.15 6.01 2.98
</div>
<span class='text_page_counter'>(4)</span><div class='page_container' data-page=4>
presented a negative effect on the development of mesopores.
According toTable S3, the impregnation ratio has the most
signif-icant effect on the methylene blue index due to the higher F-value
(43.55). After that, follow the activation temperature, the quadratic
term of impregnation ratio and the interaction between activation
temperature and impregnation ratio with F-values of 8.92, 5.41 and
3.03, respectively.
3.2.3. Methyl orange and methyl violet removal
Based on the ANOVA data for methyl orange and methyl violet
removal responses, the most significant factors are activation
temperature (A), impregnation ratio (B) activation time (C),
inter-action between activation temperature and impregnation ratio
(AB), interaction between impregnation ratio and activation time
(BC) and quadratic term of impregnation ratio (B2) Eqs.(8) and (9).
Y3ẳ93.97ỵ9.69 Aỵ16.57 Bỵ2.18 Cỵ0.63 AB0.16 BC5.38
B2 (8)
Y4ẳ113.21ỵ9.89 Aỵ14.66 Bỵ4.46 Cỵ4.71 AB2.27 BC5.09
B2 (9)
The activation temperature, impregnation ratio, activation time
and interaction between activation temperature and impregnation
ratio showed a positive effect on the methyl orange and methyl
violet removal response. Although, the interaction between
impregnation ratio and activation time and the quadratic term of
impregnation ratio presented a negative effect. FromTables S4 and
S5, it could be seen that the impregnation ratio has the largest
ef-fect on the methyl orange and methyl violet removal with an
F-value of 53.15 and 26.10, respectively, followed by the activation
temperature and quadratic term of impregnation ratio for the MO
and MV removal.
3.2.4. Indigo carmine removal
The significant model terms for indigo carmine removal are the
activation temperature (A), impregnation ratio (B), activation time
(C), the interaction between activation temperature and
impreg-nation ratio (AB), the interaction between activation temperature
and activation time (AC) and the quadratic term of activation
temperature (A2) Eq.(10).
Y5ẳ27.67ỵ3.76 Aỵ10.63 Bỵ1.83 Cỵ2.95 AB0.39 AC3.22
A2 (10)
The activation temperature, impregnation ratio, activation time
and interaction between activation temperature and impregnation
ratio showed a positive effect on the indigo carmine removal
response. However, the interaction between activation
tempera-ture and activation time and the quadratic term of activation
temperature presented a negative effect on the indigo carmine
removal. According toTable S6, it could be seen that the
impreg-nation ratio has the most pronounced effect on the indigo carmine
removal based on the highest F-value of 60.03. In contrast, the
activation temperature, quadratic term of activation temperature
and interaction between activation temperature and impregnation
ratio have an F-value of 7.52, 5.94, and 2.72, respectively.
3.3. Response surface analysis
The mathematical models for the iodine number, MB index and
dyes removal were used to build response surfaces as well as to
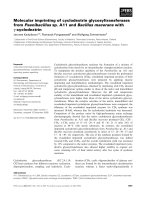
determine the optimal conditions of the process.Fig. 1present the
3D response surfaces plots for the significant interactions.
For the iodine number, the most signi<sub>fi</sub>cant interactions were
the impregnation ratio/activation temperature and the activation
time/impregnation ratio. The Fig. 1(a) indicates that the iodine
number increased with the increase of activation temperature and
impregnation ratio. Fig. 1(b) shows that the iodine number
increased with increase of the impregnation ratio and decrease of
activation time when the activation temperature isfixed at 500C.
For the MB index, the most significant interaction was the
impregnation ratio/activation temperature. FromFig. 1(c), it can be
observed that the MB index increased with the increase of the
activation temperature and the impregnation ratio. The maximal
MB index response was obtained at an activation time of 145 min.
In the removal of MV and MO dyes, the same significant
in-teractions are found, including the impregnation ratio/activation
temperature and the activation time/impregnation ratio. From
Fig. 1(d)e(f), it can be observed that the MV and MO removal
increased with increase of the activation temperature and
impregnation ratio. The maximal MV and MO removal responses
were obtained at an activation time of 145 min.Fig. 1(e)e(g), shows
that the MO and MV removal increased with increasing
impreg-nation ratio and decreasing activation time in case the activation
temperature isfixed at 500C.
For the removal of IC, the most significant interactions were the
impregnation ratio/activation temperature and the activation time/
activation temperature. From the 3D response surface plot as
shown inFig. 1(h), it was observed that the indigo carmine removal
increases with increase of the impregnation ratio and activation
temperature in case the activation time isfixed at 130 min.Fig. 1(i)
shows that for a decrease of the activation time and an increase of
the activation temperature, the IC removal response increased.
In general, the impregnation of the precursor allows the
development of the internal structure of the activated carbon by
the creation of new pores and the enlargement of existing pores. In
this context, several parameters including the activation time, the
activation temperature and the impregnation ratio play an
impor-tant role in the development of the porosity of activated carbons
and, consequently, the evolution of the adsorption performance. In
fact, during activation, the boric acid catalyzes the dehydration and
promotes the formation of aromatic structures during pyrolysis
[36]. In addition, the formation of an impenetrable glassy coating
on the solid surface from boric acid decomposition products
in-hibits the release of volatile substances, which also promotes the
formation of carbon[37,38]. Then, this vitreous coating prevents
the diffusion of oxygen and prevents the propagation of exothermic
combustion reactions[39].
3.4. Diagnostic model
Table S7summarizes the information of the proposed models of
statistic the actual and predict values for testing the significant effects
of the regression coefficients. Predicted values obtained were
compared with experimental values. These values for the models
nearly coincide, which indicates a correspondence between the
mathematical model and the experimental data. The correlations
between the theoretical and experimental responses, calculated by
the model, are satisfactory. Therefore, the R2<sub>values are in reasonable</sub>
agreement with those of the Radj2. In addition, the model F-value of
the iodine number, methylene blue index, methyl orange, methyl
violet and indigo carmine removal read as 28.21, 12.44, 13.06, 6.60 and
13.00 respectively. These values implicate that models are significant.
3.5. Normal probability plot of residuals
</div>
<span class='text_page_counter'>(5)</span><div class='page_container' data-page=5>
normal probability plot of the residuals. If the data points on the
plot fall fairly close to the straight line, the data are normally
distributed[40]. It appears that for the iodine number, methylene
blue index and dyes responses, the data points were fairly close to
the straight line, indicating that the experiments come from a
normally distributed population.
3.6. Optimization analysis
The optimum conditions for the three variables, activation
temperature, impregnation ratio and activation time were obtained
using numerical optimization features of Design-Expert 10.0.0. The
software searches for a combination of factors that simultaneously
satisfy the requirements placed on each of the response factors. The
goal was tofind the optimum process parameters that will produce
activated carbons with high iodine number, high dyes removal, as
well as high methylene blue index. From the experimental results,
the optimized activated carbon sample activated at 500 C for
145 min with an impregnation ratio of 2 g/g, under which a
maximum MB index of 188.75 mg/g, a MO and MV removal of
116.84 mg/g and 140.76 mg/g could be achieved, respectively. For
the maximum IN and removal of IC the optimal preparation
con-ditions were determined as: activation temperature of 450 C,
impregnation ratio of 2.34 g/g and activation time of 130 min.
Under this condition the maximum values of IN and the adsorption
capacity for IC were 794.58 mg/g and 44.87 mg/g, respectively. In
addition, it was observed that experimental values obtained were
in good agreement with the values predicted from the models, with
relatively small errors between the predicted and the experimental
values, which were only 0.01% for iodine number and MO removal
responses, 0.04% for IC removal, 0.15% for the MB index and 0.22%
for the MV removal responses.
3.7. Structural and textural properties of activated carbons
3.7.1. Morphology of ACs
</div>
<span class='text_page_counter'>(6)</span><div class='page_container' data-page=6>
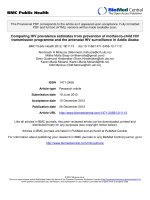
texture with irregular cavities distributed on the surfaceFig. 3(b).
Fig. 3(c) presents a smooth and featureless surface with very little
pores available on activated carbon prepared at 450C for 130 min
with an impregnation ratio of 2.34 g/g. The activated carbon
prepared at 500C for 115 min with an impregnation ratio of 2 g/g
shown inFig. 3(d) indicates a rough and heterogeneous surface
and contains a limited number of pores. These observations
indicate that the activation with boric acid at different conditions
produces an increase in surface area and pore volume in the inner
surface of the ACs.
</div>
<span class='text_page_counter'>(7)</span><div class='page_container' data-page=7>
3.7.2. Energy dispersive X-ray (EDX) analysis
The proximate analysis indicates thatT. transtaganastems is a
good alternative for producing activated carbon due to its high
content offixed carbon (27.85%) and volatile matter (39.45%) and
low ash (7.25%). Moreover, the energy dispersive X-ray analysis
(Table 3) showed that TTS contains 63.27% of carbon and 31.45% of
oxygen associated with some minerals such as potassium, nitrogen,
and calcium. After the impregnation of TTS with H3BO3, an increase
in the carbon content by 13.26% and a decrease in the oxygen
content by 13.72 for activated carbon prepared at 500 C for
145 min with an impregnation ratio of 2 g/g can be seen. For
acti-vated carbon prepared at 450C in 130 min with an impregnation
ratio of 2.34 g/g, there is an increase in the carbon content by 11.92%
and a decrease of the oxygen content by 12.63%. For activated
carbon prepared at 500C in 115 min with an impregnation ratio of
2 g/g, there is an increase in the carbon content by 8.42% and a
decrease in the oxygen content by 6.89%. This may be ascribed to
the oxygen removal and carbon enrichment, resulting from
loos-ened oxygen attached to the carbonaceous material during
chem-ical activation. The presence of carbon in significant quantity
provided the active surface for the attachments of the organic
pollutants to the surface of the activated carbons.
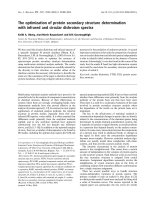
3.7.3. X ray diffraction
In order to determine the crystal structure of optimized
acti-vated carbons, X-ray diffraction analyzes were performed. Fig. 4
presents the XRD patterns of the studied activated carbons. This
figure shows generally an amorphous structure of all activated
carbons with similar profiles and broad band at 23. The simple
band at 23may be due to the disordered stacks of graphite layers
[41]. Activated carbons have interplanar distances of d002, higher
than those of graphite. These activated carbons are considered to be
in disorder and out of graphitization.
3.7.4. Boehm titration and pH of zero charge
Table 4presents the estimated chemical groups on the surface of
ACs and pHPZC. The pHPZCvalues were 6.62, 5.86 and 6.28, which
assign an acid character to the samples. While, acid groups are
greater than basic groups (1.4179, 1.4481 and 1.4432 meq/g
compared to 0.3665, 0.3549 and 0.3575 meq/g, respectively). This
acidity gave them greater exchange properties with the cationic
dyes than with the anionic dyes. Although, studied activated
car-bons have an important quantity of phenolic and lactonic groups in
comparison of the amount of carboxylic groups. Hence, the greater
adsorption performance of cationic and anionic dyes of these three
activated carbons optimized can be related to the availability of this
type of functional groups.
3.7.5. Infrared spectroscopy
The functional groups of activated carbons and precursor
ma-terial are presented inFig. 5. According to thisfigure, the surface
groups of the activated carbons were different from those of the
biomass. Some peaks have a low intensity or even disappeared in
the prepared ACs relative to the rawT. transtaganastems, as many
of the functional groups disappeared after the activation processes.
This result is due to the thermal degradation effect during the
activation processes which resulted in the destruction of some
intermolecular bondings. Concerning the FT-IR spectra of the
pre-cursor material (TTS), there are large band at 3700 and 3200 cm1
attributed to the stretching vibration of hydrogen bonds of the
hydroxyl group linked in cellulose, lignin, adsorbed water and to
NeH Stretching, respectively[42]. The bands at 3000e2800 cm1
are attributed to aliphatic CeH stretching vibrations of an aromatic
methoxyl group in methyl and methylene groups of side chains.
The small band at 1676 cm1 is assigned to OeH bending. The
spectra also indicate a band at 1615.95 cm1which is characteristic
of C]O stretching vibrations of ketones, aldehydes, lactones or
Fig. 3.SEM micrographs of: (a) precursor (TTS), (b) 500C/145 min/2 g/g, (c) 450C/130 min/2.34 g/g and (d) 500C/115 min/2 g/g.
Table 3
Percent atomic of: (a) precursor (TTS), (b) 500C/145 min/2 g/g, (c) 450C/130 min/
2.34 g/g and (d) 500C/115 min/2 g/g.
Element Atomic %
a b c d
C 63.27 76.53 75.19 71.69
O 31.45 17.73 18.82 22.56
Al 4.62 e e e
Na 0.2 e e 0.03
Cl 0.14 e e e
K 0.12 e e 0.02
</div>
<span class='text_page_counter'>(8)</span><div class='page_container' data-page=8>
carboxyl groups. The activated carbons present similar profiles with
different bands intensities. The band between 3200 and 3700 cm1
that correspond to OeH stretching vibrations of the hydroxyl
functional groups including hydrogen bonding, was of low intensity
in ACs. This reduction in the peak intensity corresponds to a
reduction in the hydrogen bonding which may be due to the
re-action between H3BO3and precursor[43]. The band appearing in
the spectrum between 1500 and 1700 cm1is attributed to
vibra-tions of the C<sub>]</sub>C bonds in the aromatic rings or of the groups C<sub>]</sub>O
of carboxylic acids, acetate groups (COOe), ketones, aldehydes or
lactones. The shoulder at 900e970 cm1is attributed to a chemical
ionized bonding PỵeO or to symmetric vibrations in the PeOeP
chains (polyphosphate). This band is an indication of the presence
of phosphorus-oxygen compounds in the samples. It appears that
activation of the samples impregnated with H3BO3 leads to
decomposition of phosphoric compounds. Also, the shoulder at
600e640 cm1could correspond to vibration elongation of PeOeC
(aliphatic), asymmetric elongation of PeOeC (aromatic), PeO
stretching in <sub>></sub>P<sub>]</sub>OOH, strain P<sub>e</sub>OH asymmetric stretching
PeOeP in polyphosphates in complex phosphate-carbon.
Fig. 4.XRD patterns of ACs-: (a) 500C/145 min/2 g/g, (b) 450C/130 min/2.34 g/g and (c) 500C/115 min/2 g/g.
Table 4
Chemical groups on the surface of the ACs and pHpzc.
Activated carbon Surface group (meq/g) pHPZC
Carboxylic Lactonic Phenolic Total acid Total basic
AC-500<sub>C/145 min/2 g/g</sub> <sub>0.4324</sub> <sub>0.4962</sub> <sub>0.4893</sub> <sub>1.4179</sub> <sub>0.3665</sub> <sub>6.62</sub>
AC-450<sub>C/130 min/2.34 g/g</sub> <sub>0.4310</sub> <sub>0.5049</sub> <sub>0.5122</sub> <sub>1.4481</sub> <sub>0.3549</sub> <sub>5.86</sub>
AC-500<sub>C/115 min/2 g/g</sub> <sub>0.4231</sub> <sub>0.5013</sub> <sub>0.5188</sub> <sub>1.4432</sub> <sub>0.3575</sub> <sub>6.28</sub>
</div>
<span class='text_page_counter'>(9)</span><div class='page_container' data-page=9>
3.7.6. Adsorption isotherm
The use of an experimental design allowed us to optimize the
preparation conditions and to evaluate the cationic and anionic
dyes removal onto prepared activated carbons. In fact, the sample
activated at 500C during 145 min with an impregnation ratio of
2 g/g was considered as optimized activated carbon for studying
the isotherm models of methylene blue, methyl violet, methyl
or-ange and indigo carmine adsorption. It was observed fromFig. 6
that the adsorption efficiency increases with the increase of the
initial concentration, indicating that the adsorption process is more
favorable at increasing concentration of dyes. The equilibrium
characteristics of this adsorption study were described using
Langmuir[44]and Freundlich[45]isotherm models.
Based on the result tabulated in supplements (Table S8), the
correlation coefficients of the Freundlich model are lower than the
values of the Langmuir model. While, the experimental equilibrium
data can be bestfitted with the Langmuir isotherm model. In fact, r2
values of 0.996, 0.993, 0.990 and 0.997 are found for MB, MO, MV
and IC adsorption, respectively. The results from the Freundlich
isotherm model show that the value for n is greater than unity,
which further supports the favorable adsorption of MB, MV, MO
and IC onto the activated carbon. Moreover, the maximum
adsorption capacities obtained with the application of the
Lang-muir isotherm model are 219.70, 118.10, 137.80 and 44.70 mg/g for
MB, MO, MV and IC adsorption, respectively. These capacities
as-sume monolayer adsorption processes for MB, MV, MO and IC that
are close to the observed adsorption capacities at equilibrium.
The maximum Langmuir adsorption capacities mentioned
above were compared to previous studies on various activated
carbons with different preparation conditions (Table S9). It could be
seen that the experimental data in the present study are higher
than those of the most often prepared activated carbons used in
cationic and anionic dyes adsorption in the literature.
4. Conclusion
This work has shown thatT. transtaganastems is a new good
alternative precursor for the preparation of activated carbons for
the elimination of cationic and anionic dyes. The optimization of
preparation conditions was investigated using the central
com-posite design with response surface methodology. Results
indi-cate that the activation temperature and the impregnation ratio
are the most important factors in the activation process. The
iodine number increases as the activation temperature and the
impregnation ratio increase. It was also clear that the in<sub>fl</sub>uence of
the activation time is more pronounced at higher temperature
and impregnation ratio. The adsorption of the dyes increases
when the impregnation ratio increases from 0.66 to 2 g/g.
How-ever, with an impregnation ratio of 2.34 there is a slight decrease
in the adsorption of MV and MO. In addition, with an activation
temperature of 366 C, the activated carbon indicates minor
adsorption capacities of the dyes also the iodine number and the
methylene blue index. The maximum adsorption capacities
ob-tained with the application of the Langmuir isotherm model are
219.70, 118.10, 137.80 and 44.70 mg/g for MB, MO, MV and IC,
respectively, for AC activated at 500C during 145 min with an
impregnation ratio of 2 g/g.
Conflict of interest
We have no conflict of interest to declare.
Appendix A. Supplementary data
Supplementary data to this article can be found online at
/>
</div>
<span class='text_page_counter'>(10)</span><div class='page_container' data-page=10>
References
[1] J.N. Halder, M.N. Islam, Water pollution and its impact on the human health,
J. Environ. Human 2 (2015) 36e46, />[2] M.L. Parisi, E. Fatarella, D. Spinelli, R. Pogni, R. Basosi, Environmental impact
assessment of an eco-efficient production for coloured textiles, J. Clean. Prod.
108 (2015) 514e524, />[3] D.S. Brookstein, Factors associated with textile pattern dermatitis caused by
contact allergy to dyes,finishes, foams, and preservatives, Dermatol. Clin. 27
(2009) 309e322, />
[4] M. El Ouardi, S. Qourzal, A. Assabbane, J. Douch, Adsorption studies of cationic
and anionic dyes on synthetic ball clay, J. Appl. Surf. Interface 1 (2017) 28e34.
[5] P.K. Sane, S. Tambat, S. Sontakke, P. Nemade, Visible light removal of reactive
dyes using CeO2synthesized by precipitation, J. Environ. Chem. Eng. 6 (2018)
4476e4489, />
[6] M.M. Hassan, C.M. Carr, A critical review on recent advancements of the
removal of reactive dyes from dyehouse effluent by ion-exchange adsorbents,
Chemosphere 209 (2018) 201e219, />j.chemosphere.2018.06.043.
[7] R. Li, B. Gao, K. Guo, Q. Yue, H. Zheng, Y. Wang, Effects of papermaking
sludge-based polymer on coagulation behavior in the disperse and reactive dyes
wastewater treatment, Bioresour. Technol. 240 (2017) 59e67, />10.1016/j.biortech.2017.02.088.
[8] S. Ren, D. Liu, Y. Chen, S. An, Y. Zhao, Y. Zhang, Anionic channel membrane
encircled by SO3H-polyamide 6 particles for removal of anionic dyes,
J. Membr. Sci. 570e571 (2019) 34e43.
[9] A. Tiya-Djowe, P.N. Lemougna, A. Emadak, M. Pitap-Mbowou, S. Laminsi,
U. Chinje-Melo, Taking advantage of iron contained in natural volcanic ash for
catalytic degradation of Rhodamine 6G, J. Appl. Surf. Interface 3 (2018) 10e16.
[10] A.R. Bagheri, M. Ghaedi, S. Hajati, A.M. Ghaedi, A. Goudarzi, A. Asfaram,
Random forest model for the ultrasonic-assisted removal of chrysoidine G by
copper sulfide nanoparticles loaded on activated carbon; response surface
methodology approach, RSC Adv. 5 (2015) 59335e59343, />10.1039/C5RA08399K.
[11] M. Dastkhoon, M. Ghaedi, A. Asfaram, M.H. Ahmadi Azqhandi, M.K. Purkait,
Simultaneous removal of dyes onto nanowires adsorbent use of ultrasound
assisted adsorption to clean waste water: chemometrics for modeling and
optimization, multicomponent adsorption and kinetic study, Chem. Eng. Res.
Des. 124 (2017) 222e237, />[12] E. Sharifpour, H.Z. Khafri, M. Ghaedi, A. Asfaram, R. Jannesar, Isotherms and
kinetic study of ultrasound-assisted adsorption of malachite green and Pb2ỵ
ions from aqueous samples by copper sulde nanorods loaded on activated
carbon: experimental design optimization, Ultrason. Sonochem. 40 (2018)
373e382, />
[13] E.A. Abdelrahman, Synthesis of zeolite nanostructures from waste aluminum
cans for efficient removal of malachite green dye from aqueous media, J. Mol.
Liq. 253 (2018) 72e82, />[14] A. Kausar, M. Iqbal, A. Javed, K. Aftab, Z.H. Nazli, H.N. Bhatti, S. Nouren, Dyes
adsorption using clay and modified clay: a review, J. Mol. Liq. 256 (2018)
395e407.
[15] A. Gouthaman, R.S. Azarudeen, A. Gnanaprakasam, V.M. Sivakumar,
M. Thirumarimurugan, Polymeric nanocomposites for the removal of Acid red
52 dye from aqueous solutions: synthesis, characterization, kinetic and
isotherm studies, Ecotoxicol. Environ. Saf. 160 (2018) 42e51, />10.1016/j.ecoenv.2018.05.011.
[16] A. Asfaram, M. Ghaedi, S. Agarwal, I. Tyagi, V.K. Gupta, Removal of basic dye
Auramine-O by ZnS: Cu nanoparticles loaded on activated carbon:
optimiza-tion of parameters using response surface methodology with central
com-posite design, RSC Adv. 5 (2015) 18438e18450.
[17] S. Rattanapan, J. Srikram, P. Kongsune, Adsorption of methyl orange on coffee
grounds activated carbon, Energy Procedia 138 (2017) 949e954, https://
doi.org/10.1016/j.egypro.2017.10.064.
[18] M. Farnane, A. Machrouhi, A. Elhalil, H. Tounsadi, M. Abdennouri, S. Qourzal,
N. Barka, Process optimization of potassium hydroxide activated carbon from
carob shell biomass and heavy metals removal ability using BoxeBehnken
design, Desalin. Water Treat. 133 (2018) 153e166, />dwt.2018.22977.
[19] H. Tounsadi, A. Khalidi, M. Abdennouri, N. Barka, Activated carbon from
Diplotaxis Harra biomass: optimization of preparation conditions and heavy
metal removal, J. Tai. Ins. Chem. Eng. 000 (2015) 1e11, />10.1016/j.jtice.2015.08.014.
[20] H. Tounsadi, A. Khalidi, A. Machrouhi, M. Farnane, R. Elmoubarki, A. Elhalil,
M.Sadiq, N. Barka, Highly efficient activated carbon from Glebionis coronaria
L. biomass: optimization of preparation conditions and heavy metals removal
using experimental design approach, J. Environ. Chem. Eng. S2213-3437 (16)
30380-30383. />
[21] M. Farnane, H. Tounsadi, A. Machrouhi, A. Elhalil, F.Z. Mahjoubi, M. Sadiq,
M. Abdennouri, S. Qourzal, N. Barka, Dye removal from aqueous solution by
raw maize corncob and H3PO4activated maize corncob, J. Water Reuse Desal.
8 (2017) 214e224, />
[22] A. Machrouhi, M. Farnane, A. Elhalil, R. Elmoubarki, M. Abdennouri, S. Qourzal,
H. Tounsadi, N. Barka, Effectiveness of beetroot seeds and H3PO4activated
beetroot seeds for the removal of dyes from aqueous solutions, J. Water Reuse
Desal. 8 (2017) 522e531, />
[23] C. Djilani, R. Zaghdoudi, F. Djazi, B. Bouchekima, A. Lallam, Ali Modarressi,
M. Rogalski, Adsorption of dyes on activated carbon prepared from apricot
stones and commercial activated carbon, J. Taiwan Inst. Chem. Eng. 000 (2015)
1e10, />
[24] M. Kwiatkowski, E. Broniek, An analysis of the porous structure of activated
carbons obtained from hazelnut shells by various physical and chemical
methods of activation, Colloids Surf. A 529 (2017) 443e453, />10.1016/j.colsurfa.2017.06.028.
[25] X.L. Su, J.R. Chen, G.P. Zheng, J.H. Yang, X.X. Guan, P. Liu, X.C. Zheng,
Three-dimensional porous activated carbon derived from loofah sponge biomass for
supercapacitor applications, Appl. Surf. Sci. 436 (2018) 327e336, https://
doi.org/10.1016/j.apsusc.2017.11.249.
[26] A.M. Abioye, F.N. Ani, Recent development in the production of activated
carbon electrodes from agricultural waste biomass for supercapacitors: a
re-view, Renew. Sustain. Energy Rev. 52 (2015) 1282e1293, />10.1016/j.rser.2015.07.129.
[27] V. Subramanian, C. Luo, A.M. Stephan, K.S. Nahm, T. Sabu, B. Wei,
Super-capacitors from activated carbon derived from bananafibers, J. Phys. Chem. C
111 (2007) 7527e7531, />
[28] R. Azargohar, A.K. Dalai, Production of activated carbon from Luscar char:
experimental and modelling studies, Micropor. Mesopor. Mater. 85 (2005)
219e225, />
[29] J.M. Salman, Optimization of preparation conditions for activated carbon from
palm oil fronds using response surface methodology on removal of pesticides
from aqueous solution, Arabian J. Chem. 7 (2014) 101e108, />10.1016/j.arabjc.2013.05.033.
[30] M.A. Ahmad, R. Alrozi, Optimization of preparation conditions for mangosteen
peel-based activated carbons for removal of brilliant blue R using response
surface methodology, Chem. Eng. J. 165 (2010) 883e890, />10.1016/j.cej.2010.10.049.
[31] R. Kumar, R. Singh, N. Kumar, K. Bishnoi, N.R. Bishnoi, Response surface
methodology approach for optimization of biosorption process for removal of
Cr(VI) Ni(II) and Zn(II) ions by immobilized bacterial biomass sp. Bacillus
brevis, Chem. Eng. J. 146 (2009) 401e407, />j.cej.2008.06.020.
[32] C. Elliott, T. Colby, H. Iticks, Activated carbon obliterans alter aspiration of
activated charcoal, Chest 96 (1989) 672e674.
[33] C.A. Nunes, M.C. Guerreiro, Estimation of surface area and pore volume of
activated carbons by methylene blue and iodine numbers, Quim. Nova 34
(2011) 472e476, />[34] H.P. Boehm, E. Diehl, W. Heck, R. Sappok, Surface oxides of carbon, Angew.
Chem. Int. Ed. 3 (1964) 669e677, />[35] J.S. Noh, J.A. Schwarz, Estimation of the point of zero charge of simple oxides
by mass titration, J. Colloid Interface Sci. 130 (1989) 157e164, />10.1016/0021-9797(89)90086-6.
[36] Q.W. Wang, J. Li, J.E. Winandy, Chemical mechanism offire retardance of boric
acid on wood, Wood Sci. Technol. 38 (2004) 375e389.
[37] B.K. Kandola, A.R. Horrocks, D. Price, G.V. Coleman, Flame-retardant
treat-ments of cellulose and their influence on the mechanism of cellulose
pyrol-ysis, J. Macromol. Sci. Polym. Rev. 36 (1996) 721e794, />10.1080/15321799608014859.
[38] C. Di Blasi, C. Branca, A. Galgano, Flame retarding of wood by impregnation with
boric acid-Pyrolysis products and char oxidation rates, Polym. Degrad. Stab. 92
(2007) 752e764, />[39] B.K. Kandola, A.R. Horrocks, D. Price, G.V. Coleman, J. Macromol. Sci. Rev.
Macromol. Chem. Phys. 36 (1996) 1967e1982.
[40] M.K.B. Gratuito, T. Panyathanmaporn, R.A. Chumnanklang, N.B. Sirinuntawittaya,
A. Dutta, Production of activated carbon from coconut shell: optimization using
response surface methodology, Bioresour. Technol. 99 (2008) 4887e4895,
/>
[41] K. Kinoshita, Carbon, Electrochemical and Physicochemical Properties, Wiley,
New York, 1988.
[42] M.R.H. Mas Haris, K. Sathasivam, The removal of methyl red from aqueous
solutions using banana pseudostem fibers, Am. J. Appl. Sci. 6 (2009)
1690e1700, />
[43] F. Suarez-Garcia, A. Martinez-Alonso, J.M.D. Tascon, Pyrolysis of apple pulp:
chemical activation with phosphoric acid, J. Anal. Appl. Pyrol. 63 (2002)
283e301, />
[44] I. Langmuir, The constitution and fundamental properties of solids and liquids.
Part I. Solids, J. Am. Chem. Soc. 38 (1916) 2221e2295.
</div>
<!--links-->
<a href=' /><a href=' /><a href=' /><a href=' /><a href=' /><a href=' /><a href=' /><a href=' /><a href=' /><a href=' /><a href=' /><a href=' /> Utilization of activated carbon for the removal of basic dyes in fixed-bed microcolumn
- 10
- 561
- 0


.push({});</script> </div> </div> </div> <div class="vf_link_relate px-2 my-2"> <h2 class="vf_doc_relate text-2xl font-bold my-4">Tài liệu liên quan</h2> <ul class="grid grid-cols-12 gap-2"> <li class="col-span-6 md:col-span-2"> <div class="card-doc " onclick="actionDocRelated(this)"> <a class="card-doc-img" href="https://text.123docz.net/document/560459-utilization-of-activated-carbon-for-the-removal-of-basic-dyes-in-fixed-bed-microcolumn.htm" title="Utilization of activated carbon for the removal of basic dyes in fixed-bed microcolumn"> <i class="icon i_type_doc i_type_doc2"></i> <img class="lazy" src="data:image/gif;base64,R0lGODlhAQABAIAAAP///wAAACH5BAEAAAAALAAAAAABAAEAAAICRAEAOw==" data-src="https://media.store123doc.com/images/document/13/pt/gh/medium_ghx1378372279.jpg" width="124" height="179" alt="Utilization of activated carbon for the removal of basic dyes in fixed-bed microcolumn" onerror="this.src=)