Real-Time Digital Signal Processing - Chapter 9: Practical DSP Applications in Communications
Bạn đang xem bản rút gọn của tài liệu. Xem và tải ngay bản đầy đủ của tài liệu tại đây (279.71 KB, 45 trang )
9
Practical DSP Applications in
Communications
There are many DSP applications that are used in our daily lives, some of which have
been introduced in previous chapters. DSP algorithms, such as random number gen-
eration, tone generation and detection, echo cancellation, channel equalization, noise
reduction, speech and image coding, and many others can be found in a variety of
communication systems. In this chapter, we will introduce some selected DSP applica-
tions in communications that played an important role in the realization of the systems.
9.1 Sinewave Generators and Applications
When designing algorithms for a sinewave (sine or cosine function) generation, several
characteristics should be considered. These issues include total harmonic distortion,
frequency and phase control, memory usage, execution time, and accuracy. The total
harmonic distortion (THD) determines the purity of a sinewave and is defined as
THD
spurious harmonic power
total waveform power
, 9:1:1
where the spurious harmonic power relates to the unwanted harmonic components of
the waveform. For example, a sinewave generator with a THD of 0.1 percent has a
distortion power level approximately 30 dB below the fundamental component. This is
the most important characteristic from the standpoint of performance. The other
characteristics are closely related to details of the implementation.
Polynomials can be used to express or approximate some trigonometric functions.
However, the sine or cosine function cannot be expressed as a finite number of additions
and multiplications. We must depend on approximation. Because polynomial approxi-
mations can be computed with multiplications and additions, they are ready to be
implemented on DSP devices. For example, the sine function can be approximated by
(3.8.1). The implementation of a sinewave generation using polynomial approximation
is given in Section 3.8.5. As discussed in Chapter 6, another approach of generating
sinusoidal signals is to design a filter H(z) whose impulse response h(n) is the desired
sinusoidal waveform. With an impulse function dn used as input, the IIR filter will
Real-Time Digital Signal Processing. Sen M Kuo, Bob H Lee
Copyright # 2001 John Wiley & Sons Ltd
ISBNs: 0-470-84137-0 (Hardback); 0-470-84534-1 (Electronic)
generate the desired impulse response (sinewave) at the output. In this section, we will
discuss the lookup-table method for generating sinewaves.
9.1.1 Lookup-Table Method
The lookup-table method or wavetable generator is probably the most flexible and
conceptually simple method for generating sinusoidal waveforms. The technique simply
involves the readout of a series of stored data values representing discrete samples of the
waveform to be generated. The data values can be obtained either by sampling the
appropriate analog waveform, or more commonly, by computing the desired values
using MATLAB or C programs. Enough samples are generated and stored to accurately
represent one complete period of the waveform. The periodic signal is then generated by
repeatedly cycling through the data memory locations using a circular pointer. This
technique is also used for generating computer music.
A sinewave table contains equally spaced sample values over one period of the
waveform. An N-point sinewave table can be computed by evaluating the function
xnsin
2pn
N
, n 0, 1, ..., N À 1: 9:1:2
These sample values must be represented in binary form. The accuracy of the sine
function is determined by the wordlength used to represent data and the table length.
The desired sinewave is generated by reading the stored values in the table at a constant
(sampling) rate of step D, wrapping around at the end of the table whenever the pointer
exceeds N À 1. The frequency of the generated sinewave depends on the sampling
period T, table length N, and the sinewave table address increment D:
f
D
NT
Hz: 9:1:3
For the designed sinewave table of length N, a sinewave of frequency f with sampling
rate f
s
can be generated by using the pointer address increment
D
Nf
f
s
, D
N
2
: 9:1:4
To generate L samples of sinewave xl, l 0, 1, ..., L À 1, we use a circular pointer k
such that
k m lD
mod N
, 9:1:5
where m determines the initial phase of sinewave. It is important to note that the step D
given in (9.1.4) may be a non-integer, thus (m lD) in (9.1.5) is a real number. That is, a
number consisting of an integer and a fractional part. When fractional values of D are
used, samples of points between table entries must be estimated using the table values.
400
PRACTICAL DSP APPLICATIONS IN COMMUNICATIONS
The easy solution is to round this non-integer index to the nearest integer. However, the
better but more complex solution is to interpolate the two adjacent samples.
The lookup-table method is subject to the constraints imposed by aliasing, requiring
at least two samples per period in the generated waveform. Two sources of error in the
lookup-table algorithm cause harmonic distortion:
1. An amplitude quantization error is introduced by representing the sinewave table
values with finite-precision numbers.
2. Time-quantization errors are introduced when points between table entries are
sampled, which increase with the address increment D.
The longer the table is, the less significant the second error will be. To reduce the
memory requirement for generating a high accuracy sinewave, we can take advantage of
waveform symmetry, which in effect results in a duplication of stored values. For
example, the values are repeated (regardless of sign change) four times every period.
Thus only a quarter of the memory is needed to represent the waveform. However, the
cost is a greater complexity of algorithm to keep track of which quadrant of the
waveform is to be generated and with the correct sign. The best compromise will be
determined by the available memory and computation power for a given application on
the target DSP hardware.
To decrease the harmonic distortion for a given table size N, an interpolation scheme
can be used to more accurately compute the values between table entries. Linear
interpolation is the simplest method for implementation. For linear interpolation, the
sine value for a point between successive table entries is assumed to lie on the straight
line between the two values. Suppose the integer part of the pointer is i 0 i < N and
the fractional part of the pointer is f 0 < f < 1, the sine value is computed as
xnsif Ási 1Àsi, 9:1:6
where si 1Àsi is the slope of the line segment between successive table entries i
and i 1.
Example 9.1: A cosine/sine function generator using table-lookup method with
1024 points cosine table can be implemented using the TMS320C55x assembly
code as follows:
; cos_sin.asm À Table lookup sinewave generator
; with 1024±point cosine table range(0Àp)
;
; Prototype: void cos_sin(int, int *, int *)
; Entry: arg0: T0 À a (alpha)
; arg1: AR0 À pointer to cosine
; arg2: AR1 À pointer to sine
.def _cos_sin
.ref tab_0_PI
.sect "cos_sin"
SINEWAVE GENERATORS AND APPLICATIONS
401
_cos_sin
mov T0, AC0 ; T0 a
sfts AC0, #11 ; Size of lookup table
mov #tab_0_PI, T0 ; Table based address
jj mov hi(AC0), AR2
mov AR2, AR3
abs AR2 ; cos(Àa) cos(a)
add #0x200, AR3 ; 90 degree offset for sine
and #0x7ff, AR3 ; Modulo 0x800 for 11±bit
sub #0x400, AR3 ; Offset 180 degree for sine
abs AR3 ; sin(Àa) sin(a)
jj mov *AR2(T0), *AR0 ; *AR0 cos(a)
mov *AR3(T0), *AR1 ; *AR1 sin(a)
ret
.end
In this example, we use a half table (0 3 p). Obviously, a sine (or cosine) function
generator using the complete table (0 3 2p) can be easily implemented using only a few
lines of assembly code, while a function generator using a quarter table (0 3 p=2) will
be more challenging to implement efficiently. The assembly program cos_sin.asm
used in this example is available in the software package.
9.1.2 Linear Chirp Signal
A linear chirp signal is a waveform whose instantaneous frequency increases linearly
with time between two specified frequencies. It is a broadband waveform with the lowest
possible peak to root-mean-square amplitude ratio in the desired frequency band. The
digital chirp waveform is expressed as
cnA sinfn, 9:1:7
where A is a constant amplitude and fn is a quadratic phase of the form
fn2p f
L
n
f
U
À f
L
2N À 1
n
2
a,0 n N À 1, 9:1:8
where N is the total number of points in a single chirp. In (9.1.8), a is an arbitrary
constant phase factor, f
L
and f
U
, are the normalized lower and upper band limits,
respectively, which are in the range 0 f 0:5. The waveform periodically repeats with
fn kNfn, k 1, 2, ... 9:1:9
The instantaneous normalized frequency is defined as
f nf
L
f
U
À f
L
N À 1
n,0 n N À 1: 9:1:10
402
PRACTICAL DSP APPLICATIONS IN COMMUNICATIONS
This expression shows that the instantaneous frequency goes from f 0f
L
at time
n 0tof N À 1f
U
at time n N À 1.
Because of the complexity of the linear chirp signal generator, it is more convenient
for real-time applications to generate such a sequence by a general-purpose computer
and store it in a lookup table. Then the lookup-table method introduced in Section 9.1.1
can be used to generate the desired signal.
An interesting application of chirp signal generator is generating sirens. The elec-
tronic sirens are often created by a small generator system inside the vehicle compartment.
This generator drives either a 60 or 100 Watt loudspeaker system present in the light bar
mounted on the vehicle roof or alternatively inside the vehicle radiator grill. The actual
siren characteristics (bandwidth and duration) vary slightly from manufacturers. The
wail type of siren sweeps between 800 Hz and 1700 Hz with a sweep period of approxi-
mately 4.92 seconds. The yelp siren has similar characteristics to the wail but with a
period of 0.32 seconds.
9.1.3 DTMF Tone Generator
A common application of sinewave generator is the all-digital touch-tone phone that
uses a dual-tone multi-frequency (DTMF) transmitter and receiver. DTMF also finds
widespread use in electronic mail systems and automated telephone servicing systems in
which the user can select options from a menu by sending DTMF signals from a
telephone.
Each key-press on the telephone keypad generates the sum of two tones expressed as
xncos2pf
L
nTcos2pf
H
nT, 9:1:11
where T is the sampling period and the two frequencies f
L
and f
H
uniquely define the
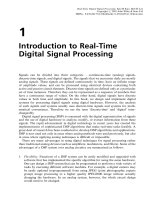
key that was pressed. Figure 9.1 shows the matrix of sinewave frequencies used to
encode the 16 DTMF symbols. The values of the eight frequencies have been chosen
carefully so that they do not interfere with speech.
The low-frequency group (697, 770, 852, and 941 Hz) selects the four rows frequencies
of the 4 Â 4 keypad, and the high-frequency group (1209, 1336, 1477, and 1633 Hz)
123A
456B
789C
*0#D
1209 1336 1477 1633 Hz
697 Hz
770 Hz
852 Hz
941 Hz
Figure 9.1 Matrix telephone keypad
SINEWAVE GENERATORS AND APPLICATIONS
403
selects the columns frequencies. A pair of sinusoidal signals with f
L
from the low-
frequency group and f
H
from the high-frequency group will represent a particular
key. For example, the digit `3' is represented by two sinewaves at frequencies 697 Hz
and 1477 Hz. The row frequencies are in the low-frequency range below 1 kHz, and the
column frequencies are in the high-frequency between 1 kHz and 2 kHz. The digits are
displayed as they appear on a telephone's 4 Â 4 matrix keypad, where the fourth column
is omitted on standard telephone sets.
The generation of dual tones can be implemented by using two sinewave generators
connected in parallel. Each sinewave generator can be realized using the polynomial
approximation technique introduced in Section 3.8.5, the recursive oscillator introduced
in Section 6.6.4, or the lookup-table method discussed in Section 9.1.1. Usually, DTMF
signals are interfaces to the analog world via a CODEC (coder/decoder) chip with an
8 kHz sampling rate.
The DTMF signal must meet timing requirements for duration and spacing of digit
tones. Digits are required to be transmitted at a rate of less than 10 per second. A
minimum spacing of 50 ms between tones is required, and the tones must be present for
a minimum of 40 ms. A tone-detection scheme used to implement a DTMF receiver
must have sufficient time resolution to verify correct digit timing. The issues of tone
detection will be discussed later in Section 9.3.
9.2 Noise Generators and Applications
Random numbers are useful in simulating noise and are used in many practical applica-
tions. Because we are using digital hardware to generate numbers, we cannot produce
perfect random numbers. However, it is possible to generate a sequence of numbers that
are unrelated to each other. Such numbers are called pseudo-random numbers (PN
sequence).
Two basic techniques can be used for pseudo-random number generation. The
lookup-table method uses a set of stored random samples, and the other is based on
random number generation algorithms. Both techniques obtain a pseudo-random
sequence that repeats itself after a finite period, and therefore is not truly random at
all time. The number of stored samples determines the length of a sequence generated by
the lookup-table method. The random number generation algorithm by computation is
determined by the register size. In this section, two random number generation algo-
rithms will be introduced.
9.2.1 Linear Congruential Sequence Generator
The linear congruential method is probably the most widely used random number
generator. It requires a single multiplication, addition, and modulo division. Thus
it is simple to implement on DSP chips. The linear congruential algorithm can be
expressed as
xnaxn À 1b
mod M
, 9:2:1
404
PRACTICAL DSP APPLICATIONS IN COMMUNICATIONS
where the modulo operation (mod) returns the remainder after division by M. The
constants a, b,andM are chosen to produce both a long period and good statistical
characteristics of the sequences. These constants can be chosen as
a 4K 1, 9:2:2
where K is an odd number such that a is less than M, and
M 2
L
9:2:3
is a power of 2, and b can be any odd number. Equations (9.2.2) and (9.2.3) guarantee
that the period of the sequence in (9.2.1) is of full-length M.
A good choice of parameters are M 2
20
10 48 576, a 45111 2045, and
x012 357. Since a random number routine usually produces samples between 0 and
1, we can normalize the nth random sample as
rn
xn1
M 1
9:2:4
so that the random samples are greater than 0 and less than 1. Note that the random
numbers r(n) can be generated by performing Equations (9.2.1) and (9.2.4) in real time.
A C function (uran.c in the software package) that implements this random number
generator is listed in Table 9.1.
Example 9.2: Most of the fixed-point DSP processors are 16-bit. The following
TMS320C55x assembly code implements an M 2
16
65 536 random number
generator.
Table 9.1 C program for generating linear congruential sequence
/*************************************************************
* URAN À This function generates pseudo-random numbers *
*************************************************************/
static long n (long)12357; // Seed x(0) 12357
float uran()
{
float ran; // Random noise r(n)
n (long)2045*n1L; // x(n) 2045*x(nÀ1)1
n À (n/1048576L)*1048576L; // x(n) x(n) À INT [x(n)/
// 1048576]*1048576
ran (float)(n1L)/(float)1048577; // r(n) FLOAT [x(n)1]/
// 1048577
return(ran); // Return r(n) to the main
} // function
NOISE GENERATORS AND APPLICATIONS
405
; rand16_gen.asm À 16±bit zero-mean random number generator
;
; Prototype: int rand16_gen(int *)
;
; Entry: arg0 À AR0 pointer to seed value
; Return: T0 À random number
C1 .equ 0x6255
C2 .equ 0x3619
.def _rand16_gen
.sect "rand_gen"
_rand16_gen
mov #C1, T0
mpym *AR0, T0, AC0 ; seed (C1*seedC2)
add #C2, AC0
and #0xffff, AC0 ; seed % 0x8000
mov AC0, *AR0
sub #0x4000, AC0 ; Zero-mean random number
mov AC0, T0
ret
.end
The assembly program rand16_gen.asm used for this example is available in the
software package.
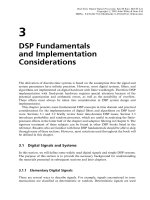
9.2.2 Pseudo-Random Binary Sequence Generator
A shift register with feedback from specific bits can also generate a repetitive pseudo-
random sequence. A schematic of the 16-bit generator is shown in Figure 9.2, where the
functional circle labeled `XOR' performs the exclusive-OR function of its two binary
inputs. The sequence itself is determined by the position of the feedback bits on the shift
register. In Figure 9.2, x
1
is the output of b
0
XOR with b
2
, x
2
is the output of b
11
XOR
with b
15
, and x is the output of x
1
XOR with x
2
.
An output from the sequence generator is the entire 16-bit word. After the random
number is generated, every bit in the register is shifted left 1 bit (b
15
is lost), and then x is
shift to b
0
to generate the next random number. A shift register length of 16 bits can
b
15
b
14
b
13
b
12
b
11
b
10
b
9
b
8
b
7
b
6
b
5
b
4
b
3
b
2
b
1
b
0
x
1
x
2
x
XOR
XOR
XOR
Figure 9.2 A 16-bit pseudo random number generator
406
PRACTICAL DSP APPLICATIONS IN COMMUNICATIONS
readily be accommodated by a single word on the many 16-bit DSP devices. Thus
memory usage is minimum. It is important to recognize, however, that sequential words
formed by this process will be correlated. The maximum sequence length before repeti-
tion is
L 2
M
À 1, 9:2:5
where M is the number of bits of the shift register.
Example 9.3: The PN sequence generator given in Table 9.2 uses many Boolean
operations. The C program requires at least 11 operations to complete the com-
putation. The following TMS320C55x assembly program computes the same PN
sequence in 11 cycles:
; pn_gen.asm À 16-bit zero-mean PN sequence generator
;
; Prototype: int pn_gen(int *)
;
; Entry: arg0 À AR0 pointer to the shift register
; Return: T0 À random number
BIT15 .equ 0x8000 ; b15
BIT11 .equ 0x0800 ; b11
Table 9.2 C program for generating PN sequence
/*************************************************************
* PN Sequence generator *
*************************************************************/
static int shift_reg;
int pn_sequence(int *sreg)
{
int b2, b11, b15;
int x1, x2; /* x2 also used for x */
b15 *sreg ) 15;
b11 *sreg ) 11;
x2 b15^b11; /* First XOR bit15 and bit11 */
b2 *sreg ) 2;
x1 *sreg ^b2; /* Second XOR bit2 and bit0 */
x2 x1^x2; /* Final XOR of x1 and x2 */
x2 & 1;
*sreg *sreg ( 1;
*sreg *sreg j x2; /* Update the shift register */
x2 *sregÀ0x4000; /* Zero-mean random number */
return x2;
}
NOISE GENERATORS AND APPLICATIONS
407
BIT2 .equ 0x0004 ; b2
BIT0 .equ 0x0001 ; b0
.def _pn_gen
.sect "rand_gen"
_pn_gen
mov *AR0, AC0 ; Get register value
bfxtr #(BIT15jBIT2), AC0, T0 ; Get b15 and b2
bfxtr #(BIT11jBIT0), AC0, T1 ; Get b11 and b0
sfts AC0, #1
jj xor T0, T1 ; XOR all 4 bits
mov T1, T0
sfts T1, #À1
xor T0, T1 ; Final XOR
and #1, T1
or T1, AC0
mov AC0, *AR0 ; Update register
sub #0x4000, AC0, T0 ; Zero-mean random number
jj ret
.end
The C program pn_sequence.c and the TMS320C55x assembly program
pn_gen.asm for this example are available in the software package.
9.2.3 Comfort Noise in Communication Systems
In voice-communication systems, the complete suppression of a signal using residual
echo suppressor (will be discussed later in Section 9.4) has an adverse subjective effect.
This problem can be solved by adding a low-level comfort noise, when the signal is
suppressed by a center clipper. As illustrated in Figure 9.3, the output of residual echo
suppressor is expressed as
yn
avn, jxnj
xn, jxnj >,
9:2:6
where v(n) is an internally generated zero-mean pseudo-random noise and x(n) is the
input applied to the center clipper with the clipping threshold b.
x(n)
v(n)
y(n)
Center
clipper
a
+
+
Σ
Noise power
estimator
Noise
generator
Figure 9.3 Injection of comfort noise with active center clipper
408
PRACTICAL DSP APPLICATIONS IN COMMUNICATIONS
The power of the comfort noise should match the background noise when neither
talker is active. Therefore the algorithm shown in Figure 9.3 is the process of estimating
the power of the background noise in x(n) and generating the comfort noise of the same
power to replace signals suppressed by the center clipper.
9.2.4 Off-Line System Modeling
As discussed in Section 8.5, several applications require knowledge of the transfer
function H(z) of an unknown system. Assuming that the characteristics of the system
are time-invariant, off-line modeling can be used to estimate H(z) during an initial
training stage. White noise is an ideal broadband training signal in system identification
because it has a constant spectral density at all frequencies. A repeated linear chirp signal
introduced in Section 9.1.2 can also be used because it has the lowest peak factor with the
most concentrated power distribution over the required frequency range. When such a
waveform is used for system identification, the required measurement time can be quite
short relative to the time required for repetitive measurements using other waveforms.
The block diagram of the off-line system modeling is shown in Figure 9.4, where
uncorrelated random noise x(n) is internally generated by the DSP system. Detailed
noise generation methods are given in Section 9.2. As illustrated in Figure 9.4, the
random noise is used as the input to an unknown system H(z) and an adaptive filter
^
Hz. The off-line system modeling procedure is summarized as follows:
1. Generate the random noise x(n). In the acoustic echo canceler (will be discussed in
Section 9.5), x(n) is converted to an analog signal, amplified, and then used to drive
a loudspeaker.
2. Obtain the desired signal d(n). In the acoustic echo canceler, d(n) is the digital signal
picked up by a microphone.
3. Apply an adaptive algorithm as follows:
3. a. Compute the filter output
yn
X
LÀ1
l0
^
h
l
nxn À l, 9:2:7
3. a. where
^
h
l
n is the lth coefficient of the adaptive filter
^
Hz at time n.
3. b. Compute the error signal
endnÀyn: 9:2:8
3. c. Update the filter coefficients using the LMS algorithm
^
h
l
n 1
^
h
l
nmxn À len, l 0, 1, ..., L À 1: 9:2:9
NOISE GENERATORS AND APPLICATIONS
409
x(n) y(n)
d(n)
+
−
LMS
algorithm
Unknown
System, H(z)
e(n)
ˆ
H(z)
Random
noise
generator
Σ
Figure 9.4 Off-line modeling of an unknown system using adaptive filter
4. Go to step 1 for the next iteration until the adaptive filter
^
Hz converges to the
optimum solution. That is, the power of e(n) is minimized.
After convergence of the algorithm, the adaptation is stopped and coefficients
^
h
l
, l 0, 1, ..., L À 1 are fixed. It is important to note that an averaging technique
can be used to obtain better results. If the algorithm converges at time n N, the
coefficients are averaged over the next M samples as
^
h
l
1
M
X
NMÀ1
nN
^
h
l
n, l 0, 1, ..., L À 1: 9:2:10
9.3 DTMF Tone Detection
This section introduces detection methods for DTMF tones used in the communication
networks. The correct detection of a digit requires both a valid tone pair and the correct
timing intervals. DTMF signaling is used both to set up a call and to control features
such as call forwarding and teleconferencing calling. In some applications, it is neces-
sary to detect DTMF signaling in the presence of speech, so it is important that the
speech waveform is not interpreted as valid signaling tones.
9.3.1 Specifications
The implementation of a DTMF receiver involves the detection of the signaling tones,
validation of a correct tone pair, and the timing to determine that a digit is present for
the correct amount of time and with the correct spacing between tones. In addition, it is
necessary to perform additional tests to improve the performance of the decoder in the
presence of speech. A DSP implementation is useful in applications in which the
digitized signal is available and several channels need to be processed such as in a
private branch exchange.
410
PRACTICAL DSP APPLICATIONS IN COMMUNICATIONS
DTMF receivers are required to detect frequencies with a tolerance of Æ1:5 percent as
valid tones. Tones that are offset by Æ3:5 percent or greater must not be detected. This
requirement is necessary to prevent the detector from falsely detecting speech and other
signals as valid DTMF digits. The receiver is required to work with a worst-case signal-
to-noise ratio of 15 dB and with a dynamic range of 26 dB.
Another requirement of the receiver is the ability to detect DTMF signals when two
tones are received at different levels. The high-frequency tone may be received at a lower
level than the low-frequency tone due to the magnitude response of the communication
channel. This level difference is called twist, and the situation described above is called a
forward (or standard) twist. Reverse twist occurs when the low-frequency tone is
received at a lower level than the high-frequency tone. The receiver must operate with
a maximum of 8 dB normal twist and 4 dB reverse twist. A final requirement for the
receiver is that it operates in the presence of speech without incorrectly identifying the
speech signal as valid DTMF tones. This is referred to as talk-off performance.
9.3.2 Goertzel Algorithm
The principle of DTMF detection is to examine the energy of the received signal at the
DTMF frequencies (defined in Figure 9.1) to determine whether a valid DTMF tone
pair has been received. The detection algorithm can be a DFT implementation using an
FFT algorithm or a filter-bank implementation. An FFT can be used to calculate the
energies of N evenly spaced frequencies. To achieve the frequency resolution required to
detect the eight DTMF frequencies within Æ1:5 percent frequency deviation, a 256-
point FFT is needed for an 8 kHz sample rate. For the relatively small number of tones
to be detected, the filter-bank implementation is more efficient.
Since only eight frequencies are of interest, it is more efficient to use the DFT directly
to compute
Xk
X
NÀ1
n0
xnW
kn
N
9:3:1
for eight different values of k that correspond to the DTMF frequencies defined in
Figure 9.1. The DFT coefficients can be more efficiently calculated by using the Goertzel
algorithm, which can be interpreted as a matched filter for each frequency k as illustrated
in Figure 9.5. In this figure, x(n) is the input signal of the system, H
k
z is the transfer
function of the filter at kth frequency bin, and X(k) is the corresponding filter output.
x(n)
H
0
(z)
H
k
(z)
H
N−1
(z)
X(0)
X(k)
X(N−1)
Figure 9.5 Flow graph of Goertzel filters
DTMF TONE DETECTION
411
From (7.1.4), we have
W
ÀkN
N
e
j2p=NkN
e
j2pk
1: 9:3:2
Multiplying the right-hand side of (9.3.1) by W
ÀkN
N
, we have
XkW
ÀkN
N
X
NÀ1
n0
xnW
kn
N
X
NÀ1
n0
xnW
ÀkNÀn
N
: 9:3:3
Define the sequence
y
k
n
X
NÀ1
m0
xmW
ÀknÀm
N
, 9:3:4
this equation can be interpreted as a convolution of the finite-duration sequence x(n),
0 n N À 1, with the sequence W
Àkn
N
un.
Consequently, y
k
n can be viewed as the output of a filter with impulse response
W
Àkn
N
un. That is, the filter with impulse response
h
k
nW
Àkn
N
un9:3:5
due to the finite-length input x(n). Thus Equation (9.3.4) can be expressed as
y
k
nxnÃW
Àkn
N
un: 9:3:6
From (9.3.3) and (9.3.4), and the fact that xn0 for n < 0 and n ! N, we show that
Xky
k
nj
nNÀ1
: 9:3:7
That is, X(k) is the output of filter H
k
z at time n N À 1.
Taking the z-transform of (9.3.6) at both sides, we obtain
Y
k
zXz
1
1 À W
Àk
N
z
À1
: 9:3:8
The transfer function of the kth Goertzel filter is defined as
H
k
z
Y
k
z
Xz
1
1 À W
Àk
N
z
À1
, k 0, 1, ..., N À 1: 9:3:9
This filter has a pole on the unit circle at the frequency !
k
2pk=N. Thus the entire
DFT can be computed by filtering the block of input data using a parallel bank of N
filters defined by (9.3.9), where each filter has a pole at the corresponding frequency of
the DFT. Since the Goertzel algorithm computes N DFT coefficients, the parameter N
412
PRACTICAL DSP APPLICATIONS IN COMMUNICATIONS
must be chosen to make sure that X(k) is close to the DTMF frequencies f
k
. This can be
accomplished by choosing N such that
f
k
f
s
k
N
, 9:3:10
where the sampling frequency f
s
8 kHz is used for most of telecommunication
systems.
A signal-flow diagram of transfer function H
k
z is depicted in Figure 9.6. Since the
coefficients W
Àk
N
are complex valued, the computation of each new value of y
k
n using
Figure 9.6 requires four multiplications and additions. All the intermediary values
y
k
0, y
k
1, ..., y
k
N À 1 must be computed in order to obtain the final output
y
k
N À 1Xk. Therefore the computational algorithm shown in Figure 9.6 requires
4N complex multiplications and additions to compute X(k) for each frequency index k.
The complex multiplications and additions can be avoided by combining the pair of
filters that have complex-conjugated poles. By multiplying both the numerator and the
denominator of H
k
z in (9.3.9) by the factor (1 À W
k
N
z
À1
), we have
H
k
z
1 À W
k
N
z
À1
1 À W
Àk
N
z
À1
1 À W
k
N
z
À1
1 À e
j2pk=N
z
À1
1 À 2cos 2pk=Nz
À1
z
À2
: 9:3:11
The signal-flow graph of the transfer function defined by (9.3.11) is shown in Figure
9.7 using the direct-form II realization. The recursive part of the filter is on the left-hand
side of the delay elements, and the non-recursive part is on the right-hand side. Since the
−k
W
N
x(n) y
k
(n)
H
k
(z)
z
−1
Figure 9.6 Flow graph of recursive computation of Xk
2cos(2pf
k
/f
s
)
−e
−j2pf
k
/
f
s
−1
w
k
(n−1)
w
k
(n−2)
w
k
(n)x(n) y
k
(n)
H
k
(z)
z
−1
z
−1
Figure 9.7 Detailed signal-flow diagram of Goertzel algorithm
DTMF TONE DETECTION
413
output y
k
n is required only at time N À 1, we just need to compute the non-recursive
part of the filter at the N À 1th iteration. The recursive part of algorithm can be
expressed as
w
k
nxn2cos2pf
k
=f
s
w
k
n À 1Àw
k
n À 2: 9:3:12
The non-recursive calculation of y
k
N À 1 is expressed as
Xky
k
N À 1w
k
N À 1Àe
Àj2pf
k
=f
s
w
k
N À 2: 9:3:13
A further simplification of the algorithm is made by realizing that only the magnitude
squared of X(k) is needed for tone detection. From (9.3.13), the squared magnitude of
X(k) is computed as
jXkj
2
w
2
k
N À 1À2 cos2pf
k
=f
s
w
k
N À 1w
k
N À 2w
2
k
N À 2: 9:3:14
Therefore the complex arithmetic given in (9.3.13) is eliminated and (9.3.14) requires
only one coefficient, 2cos2pf
k
=f
s
, for each jXkj
2
to be evaluated. Since there are eight
possible tones to be detected, we need eight filters described by (9.3.12) and (9.3.14).
Each filter is tuned to one of the eight frequencies defined in Figure 9.1. Note that
Equation (9.3.12) is computed for n 0, 1, ..., N À 1, but Equation (9.3.14) is com-
puted only once at time n N À 1.
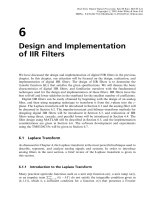
9.3.3 Implementation Considerations
The flow chart of DTMF tone detection algorithm is illustrated in Figure 9.8. At
the beginning of each frame of length N, the state variables xn, w
k
n, w
k
n À 1,
w
k
n À 2, and y
k
n for each of the eight Goertzel filters and the energy are set to 0. For
each sample, the recursive part of each filter defined in (9.3.12) is executed. At the end of
each frame, i.e., n N À 1, the squared magnitude jXkj
2
for each DTMF frequency
is computed based on the (9.3.14). The following six tests are performed to determine if
a valid DTMF digit has been detected.
Magnitude test
According to the International Telecommunication Union (ITU), previously the
International Telegraph and Telephone Consultative Committee (CCITT), standard,
the maximum signal level transmit to the public network shall not exceed À9 dBm
(=À 1 dBm) (See Appendix A.6 for the definition of dBm). This leaves an average
voice range of À35 dBm for a very weak long distance call, to À10 dBm for a local
call. Generally, the DTMF receiver would be expected to operate at an average range
of À29 dBm to 1 dBm. The 1 dBm is an extreme, but could happen. Thus the largest
magnitude in each band must be greater than a threshold of À29 dBm, otherwise
the DTMF signal should not be decoded. For this magnitude test, the squared
414
PRACTICAL DSP APPLICATIONS IN COMMUNICATIONS
Initialization
Get 8 kHz
input sample
Compute the
recursive part
of the Goertzel
filter for the 8
frequencies
n = N−1?
Compute the
non-recursive part
of the Goertzel
filter for the 8
frequencies
Yes
No
Magnitude >
threshold ?
Twist normal
?
Does frequency
offset pass ?
Total energy
test pass ?
2nd harmonic
signal too strong
?
Output digit
N
N
N
N
Y
Y
N
Y
Y
Y
Y
N
N
Y
D(m) = D(m−2)?
D(m) = D(m−1)?
Figure 9.8 Flow chart for the DTMF tone detector
magnitude jXkj
2
defined in (9.3.14) for each DTMF frequency is computed. The
largest magnitude in each group is obtained.
Twist test
Because of the frequency response of a telephone system, the tones may be attenuated
according to the system's gains at the tonal frequencies. Consequently, we do not expect
the high- and low-frequency tones to have exactly the same amplitude at the receiver,
even though they were transmitted at the same strength. Twist is the difference, in
decibels, between the low-frequency tone level and the high-frequency tone level. For-
ward twist exists when the high-frequency tone level is less than the low-frequency tone
level. Generally, the DTMF digits are generated with some forward twist to compensate
for greater losses at higher frequency within a long telephone cable. Different adminis-
trations recommend different amounts of allowable twist for a DTMF receiver. For
DTMF TONE DETECTION
415
example, Australia allows 10 dB, Japan allows only 5 dB, and AT&T recommends not
more than 4 dB of forward twist or 8 dB of reverse twist.
Frequency offset test
This test is performed to prevent some broadband noises from being detected as
effective tones. If the effective DTMF tones are present, the power levels at those two
frequencies should be much higher than the power levels at the other frequencies. To
perform this test, the largest magnitude in each group is compared to the magnitudes of
other frequencies in that group. The difference must be greater than a predetermined
threshold in each group.
Tone-to-total energy test
Similar to the frequency-offset test, the goal of this test is to reject some broad noises
(such as speech) and further improve the robustness of the receiver. To perform this test,
three different constants, c1, c2, and c3, are used. The energy of the detected tone in the
low-frequency group is weighted by c1, the energy of the detected tone in the high-
frequency group is weighted by c2, and the sum of the two energies is weighted by c3.
Each of these terms must be greater than the summation of the energy of eight filter
outputs. For this test, the total energy is computed as
E
X
8
k1
jXkj
2
: 9:3:15
Second harmonic test
The objective of this test is to reject speech that has harmonics close to f
k
so that they
might be detected as DTMF tones. Since DTMF tones are pure sinusoids, they contain
very little second harmonic energy. Speech, on the other hand, contains a significant
amount of second harmonic energy. To test the level of second harmonic, the decoder
must evaluate the second harmonic frequencies of all eight DTMF tones. These second
harmonic frequencies (1394 Hz, 1540 Hz, 1704 Hz, 1882 Hz, 2418 Hz, 2672 Hz, 2954 Hz,
and 3266 Hz) also can be detected using the Goertzel algorithm.
Digit decoder
Finally, if all five tests are passed, the tone pair is decoded as an integer between 1 and
16. Thus the digit decoder is implemented as
DmC 4R À 1, 9:3:16
416
PRACTICAL DSP APPLICATIONS IN COMMUNICATIONS