Quantitative aspects of ruminant digestion and metabolism - Phần 5
Bạn đang xem bản rút gọn của tài liệu. Xem và tải ngay bản đầy đủ của tài liệu tại đây (345.17 KB, 50 trang )
6
Volatile Fatty Acid Production
J. France
1
and J. Dijkstra
2
1
Centre for Nutrition Modelling, Department of Animal & Poultry Science,
University of Guelph, Guelph, Ontario N1G 2W1, Canada;
2
Animal
Nutrition Group, Wageningen Institute of Animal Sciences, Wageningen
University, PO Box 338, 6700 AH Wageningen, The Netherlands
Introduction
Volatile fatty acids (VFAs), principally acetate, propionate and butyrate but also
lesser amounts of valerate, caproate, isobutyrate, isovalerate, 2-methylbutyrate
and traces of various higher acids, are produced in the rumen as end-products
of microbial fermentation. During the fermentation process energy is con-
served in the form of adenosine triphosphate and subsequently utilized for the
maintenance and growth of the microbial population. As far as the microbes
are concerned the VFAs are waste products but to the host animal they
represent the major source of absorbed energy and with most diets account
for approximately 80% of the energy disappearing in the rumen (the remainder
being lost as heat and methane) and for 50–70% of the digestible energy intake
in sheep and cows at approximately maintenance, the range being 40–65% in
lactating cows (Sutton, 1972, 1979, 1985; Thomas and Clapperton, 1972).
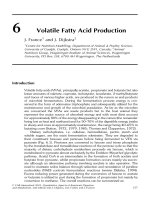
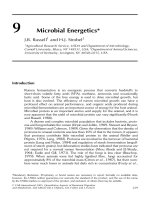
Dietary carbohydrates, i.e. cellulose, hemicellulose, pectin, starch and
soluble sugars, are the main fermentation substrates. They are degraded to
their constituent hexoses and pentoses before being fermented to VFA via
pyruvate (Fig. 6.1). Pentoses are converted to hexose and triose phosphate
by the transketolase and transaldolase reactions of the pentose cycle so that the
majority of dietary carbohydrate metabolism proceeds via hexose, which is
metabolized to pyruvate almost exclusively by the Embden–Meyerhof glycolytic
pathway. Acetyl CoA is an intermediate in the formation of both acetate and
butyrate from pyruvate, whilst propionate formation occurs mainly via succin-
ate although an alternative pathway involving acrylate is also operative. The
need to maintain redox balance through reduction and reoxidation of pyridine
nucleotides (NAD) controls fermentation reactions (review Dijkstra, 1994).
Excess reducing power generated during the conversion of hexose to acetate
or butyrate is utilized in part during the formation of propionate but mainly by
conversion to methane. The overall reactions can be summarized as:
ß CAB Internatioal 2005. Quantitative Aspects of Ruminant Digestion
and Metabolism, 2nd edition (eds J. Dijkstra, J.M. Forbes and J. France)
157
hexose ! 2 pyruvate þ 4H
pyruvate þ H
2
O ! acetate þ CO
2
þ 2H
2 pyruvate ! butyrate þ2CO
2
pyruvate þ 4H ! propionate þ H
2
O
CO
2
þ 8H ! methane þ 2H
2
O
In addition to dietary carbohydrates, dietary lipids and proteins also give rise
to VFAs in the rumen. The contribution from lipids is very small as lipids
normally represent a small proportion of the diet and only the carbohydrate
moiety, i.e. glycerol and galactose arising from lipid hydrolysis, and not the long-
chain fatty acids, are fermented. Dietary proteins on the other hand may be a
significant source of VFA when diets having a high rumen-degradable-protein
content are fed. The proteins are hydrolysed to amino acids, which are deami-
nated before conversion to VFA. Of particular importance in this respect is the
formation of isobutyric, isovaleric and 2-methylbutyric acids from valine, leucine
and isoleucine, respectively, as these branched-chain VFAs are essential growth
factors for certain of the rumen bacterial species (Cotta and Hespell, 1986).
The majority of the VFAs produced in the rumen are lost by absorption
across the rumen wall, although a proportion (10–20% in sheep and up to 35%
in dairy cattle) pass to the omasum and abomasum and are absorbed from these
organs (Weston and Hogan, 1968; Dijkstra et al., 1993). Absorption across
the rumen wall is by simple diffusion of the undissociated acids (Stevens, 1970;
Dijkstra et al., 1993). It is a concentration-dependent process and therefore
Pyruvate
Acetyl CoA
Cellulose
Starch
Soluble sugars
Pectin
Pentoses
Hemicellulose
Hexoses
Pentose
cycle
Embden−Meyerhoff
pathway
Formate
Methane Acetate Butyrate Propionate
Succinate
pathway
pathway
Acrylate
CO
2
+ H
2
Fig. 6.1. A schematic representation of the major pathways of carbohydrate metabolism in the
rumen.
158 J. France and J. Dijkstra
(of the three major VFAs) usually higher for acetate than for propionate and
lowest for butyrate, but per unit of concentration the absorption rates of the
three acids are quite similar, although at low pH VFA with a higher carbon
chain have a higher fractional absorption rate due to their greater lipid solubility
(Dijkstra et al., 1993; Lopez et al., 2003). As the pK
a
values of the acids are
lower than the pH of rumen contents, they exist largely in the anionic form.
A fall in rumen pH is associated with an increase in the proportion in the
undissociated form and therefore in the rate of absorption. During passage
across the rumen wall the VFAs are metabolized to varying extents so that the
amounts entering the bloodstream are less than the quantities absorbed from
the rumen (Weigland et al., 1972; Bergman, 1975; Weekes and Webster,
1975). However, recent results in which VFA absorption from the temporarily
isolated and washed rumen was compared with the portal VFA absorption
indicate that the rumen wall does not metabolize large amounts of acetate,
propionate and isobutyrate absorbed from the rumen, though the extensive
metabolism of butyric acid during absorption was confirmed (Kristensen et al.,
2000).
The concentration of VFA in the rumen at any given time reflects the
balance between the rate of production and rate of loss. Immediately after
feeding, production exceeds loss and the concentration increases, but subse-
quently the situation is reversed and the concentration falls. The total VFA
concentration may fall as low as 30 mM or be in excess of 200 mM but is
normally between 70 and 130 mM. The relative concentrations of the individ-
ual acids, commonly referred to as the fermentation pattern, is a reliable index
of the relative production rates of the acids when forage diets are given but
would appear less reliable with concentrate diets (Leng and Brett, 1966; Esdale
et al., 1968; Sharp et al., 1982; Sutton, 1985). The fermentation pattern is
determined by the composition of the microbial population, which in turn is
largely determined by the basal diet, particularly the type of dietary carbohy-
drate, and by the rate of depolymerization of available substrate (review by
Dijkstra, 1994). High-fibre forage diets encourage the growth of acetate-
producing bacterial species and the acetate:propionate:butyrate molar propor-
tions would typically be in the region 70:20:10, whereas starch-rich concen-
trate diets favour the development of propionate-producing bacterial species
and are associated with an increase in the proportion of propionate at the
expense of acetate, although acetate is almost always the most abundant of the
acids. Under certain conditions, concentrate diets may encourage the develop-
ment of a large protozoal population and this is accompanied by an increase in
butyrate rather than propionate (Williams and Coleman, 1997). If levels of
substrate available for fermentation are high, either from increased intake or
increased rates of depolymerization, a shift in fermentation pattern from acetic
acid to propionic acid occurs to dispose of excess reducing power (Dijkstra,
1994). In addition to the type of dietary carbohydrate, other factors such as the
physical form of the diet, level of intake, frequency of feeding and the use of
chemical additives may also affect the fermentation pattern (Ørskov, 1981;
Thomas and Rook, 1981; Nagaraja et al., 1997). Some examples of the
fermentation pattern, VFA concentration and production rate in animals
Volatile Fatty Acid Production 159
receiving different diets are shown in Table 6.1. More detailed reviews of the
various aspects of VFA production and metabolism are given by Bergman
(1990) and Dijkstra (1994).
Within the host animal’s tissues absorbed acetate and butyrate are used
primarily as energy sources through oxidation via the citric acid cycle. Acetate
is also the principal substrate for lipogenesis, whilst propionate is used largely
for gluconeogenesis and with most diets is the major source of glucose, since
net absorption of glucose from the intestinal tract is usually small. The balance
between the supply of the glucogenic propionate relative to that of the
non-glucogenic acetate and butyrate influences the efficiency with which the
VFAs are used for productive purposes (Ørskov, 1975; MacRae and Lobley,
1982; Sutton, 1985). Thus, not only the total supply of VFA but also the molar
proportions are important determinants of feed utilization by ruminants and as
such a number of methods have been used to estimate the rates of individual
and total VFA production in and removal from the rumen. These may be
conveniently divided into two groups:
1. Those methods not employing isotopic tracers (e.g. Barcroft et al., 1944;
Hungate et al., 1960; Bath et al., 1962).
2. Those employing tracers and based on the application of compartmental
analysis to interpret isotope dilution data (e.g. Bergman et al., 1965; Weller
et al., 1967; Morant et al., 1978; Armentano and Young, 1983).
Non-tracer Methods of VFA Production Measurement
A variety of non-tracer methods of measurement were used in early attempts to
quantify VFA production in the rumen, and these are comprehensively
reviewed by Warner (1964) and Hungate (1966). They include: the zero-time
in vitro method, perturbation of the steady state, portal–arterial difference and
methane production. Due to interconversions between individual VFA, particu-
larly between acetate and butyrate, the net production rates of the acids (i.e. the
amounts lost by absorption and passage) are less than the total production rates
(Bergman et al., 1965). In this and subsequent sections of the chapter, the
term production is synonymous with net production unless total production is
specified.
Zero-time in vitro method
A sample of rumen contents is taken and subsamples incubated in vitro under
anaerobic conditions. The rate of production of individual or total VFAs is
calculated from the increments in acid concentration obtained by incubating
the subsamples for different periods and extrapolating back to zero time to give
the rate of VFA production per unit volume at the time the sample was
removed. Equations for performing the calculation are given by Whitelaw
et al. (1970). If the rumen volume is known, total ruminal production can
160 J. France and J. Dijkstra
Table 6.1. VFA concentration, molar proportions and production rates in the rumen of sheep, steers and cows given various diets.
Animal
species Diet
Intake
(kg/day)
Total VFA
concentration
(mmol/l)
Acetate
(molar %)
Propionate
(molar %)
Butyrate
(molar %)
VFA
production
(mol/day) Reference
Sheep Dried grass 0.89
a
106 68 19 13 5.8 Bergman et al. (1965)
Dried grass 0.73
b
87 68 21 11 4.08 Weston and Hogan
(1968)
Dried forage oats 0.78
b
100 68 21 11 4.90 Weston and Hogan
(1968)
Dried clovers 0.97
b
118 71 19 10 6.32 Weston and Hogan
(1971)
Lucerne silage 0.87
c
85 72 22 6 4.50 Siddons et al. (1984)
Lucerne chaff 0.8
c
131 73 18 9 4.97 Leng and Brett (1966)
Maize:lucerne chaff (2:1) 0.6
c
113 63 24 13 3.61 Leng and Brett (1966)
Maize:lucerne chaff (1:1) 0.6
c
73 65 21 14 3.11 Leng and Brett (1966)
Steers Lucerne hay:concentrate
(4:1)
7.99
a
103 73 18 9 50.1 Siciliano-Jones and
Murphy (1989)
Lucerne hay:lucerne
pellets:concentrate (1:3:1)
8.29
a
100 72 18 10 42.4 Siciliano-Jones and
Murphy (1989)
Concentrate:lucerne hay
(4:1)
8.56
a
108 67 22 12 54.1 Siciliano-Jones and
Murphy (1989)
Concentrate:lucerne
hay:lucerne pellets (16:1:3)
8.94
a
118 63 26 12 42.3 Siciliano-Jones and
Murphy (1989)
Maize silage:concentrate
(1:1)
5.19
a
123 55 34 11 14.3 Rogers and Davis
(1982a)
Concentrate:maize
silage (3:1)
7.7
a
125 57 31 12 48.3 Rogers and Davis
(1982b)
Lucerne hay:maize
silage:concentrate (3.6:1:1)
9.0
a
92 72 17 11 33.3 Rogers and Davis
(1982b)
continued
VolatileFattyAcidProduction161
Table 6.1. continued.
Animal
species Diet
Intake
(kg/day)
Total VFA
concentration
(mmol/l)
Acetate
(molar %)
Propionate
(molar %)
Butyrate
(molar %)
VFA
production
(mol/day) Reference
Whole maize:other (5.25:1) 6.22
a
145 49 34 17 51.4 Sharp et al. (1982)
Ground maize:other (5.25:1) 6.22
a
141 41 49 10 42.0 Sharp et al. (1982)
Dairy cows Lucerne hay:grain (1:1.3) 19.1
c
109 67 21 12 37.52 Davis (1967)
Lucerne hay:grain (1:6.6) 17.27
c
121 49 40 11 44.58 Davis (1967)
Maize silage 3.5
a
83 64 19 17 30.9 Esdale et al. (1968)
Lucerne hay 3.9
a
77 73 17 10 26.7 Esdale et al. (1968)
Ryegrass
hay:concentrate (6:4)
12.9
a
85 68 19 13 79.8 Sutton et al. (2003)
Ryegrass
hay:concentrate (1:9)
12.7
a
89 52 38 9 90.0 Sutton et al. (2003)
a
Dry matter.
b
Organic matter.
c
Not specified.
162J.FranceandJ.Dijkstra
then be calculated. As with other in vitro techniques, it is important that the
sample taken for incubation is representative of whole-rumen contents rather
than just the solid or liquid fraction (Hungate et al., 1960). However, the VFA
concentrations and molar proportions in in vitro systems often do not resem-
ble those in vivo (Mansfield et al., 1995; Ziemer et al., 2000). Whitelaw et al.
(1970), in comparing published experiments, show that the rate of VFA
production determined by this method is about 50% lower than the rate
obtained using isotope dilution procedures. They attribute the discrepancy to
a reduction in the activity of microorganisms brought about by their removal
from the rumen.
Perturbation of the steady state
The rate of total production of an acid (or net production of total VFA) in the
rumen in steady state can be calculated from the change in its ruminal concen-
tration when the acid is infused. Let P (mmol/h) be its rate of production, U
(mmol/h) its rate of disappearance and C (mmol/ml) its concentration in the
basal steady state. Assuming disappearance is proportional to acid pool size,
the balance equation may be written as:
P ¼ U ¼ kCV (6:1)
where k (per h) is a constant of proportionality and V (ml) the ruminal volume.
Let the basal steady state be perturbed by infusion of a solution of the acid at a
constant rate I (mmol/h) such that a new steady state is reached. If the acid
infusion does not alter the basal fermentation, the balance equation in the new
steady state is:
P þ I ¼ U
0
¼ kC
0
V
0
(6:2)
where U
0
, C
0
and V
0
denote acid utilization, acid concentration and ruminal
volume, respectively, in the new steady state. Subtraction of Eq. (6.1) from
Eq. (6.2) yields an expression for the constant of proportionality:
k ¼ I=(C
0
V
0
À CV)(6:3)
Substituting for k in Eq. (6.1) gives the rate of production:
P ¼ I=[C
0
V
0
=(CV) À 1] (6:4)
The steady-state volumes V and V
0
can be determined using one of the methods,
based on digesta markers and intraruminal sampling, described in France et al.
(1991a). This approach of raising the steady-state level was used by Bath et al.
(1962) though they assumed a constant ruminal volume and expressed the acid
concentration relative to that of the other acids. Martin et al. (2001) adopted the
perturbation of steady-state method with some modifications. They infused VFA
Volatile Fatty Acid Production 163
into the rumen at five levels and estimated VFA production using a regression
approach. They observed that the VFA production rate obtained with the
regression approach was about two-thirds of that obtained with the isotope
dilution technique. This difference may be explained to an extent by the use of
1-
13
C propionate because of the labile nature of the carboxyl-C. A critical
assumption in the perturbation of steady-state method is that the rate parameter
k is not altered by the acid infusion. However, a change in VFA concentration
and other modifications that result from the acid infusion, including a change in
pH, affect the fractional absorption rate of VFA (Dijkstra et al., 1993) and
consequently k values may differ.
Portal–arterial difference in VFA concentration
The difference between VFA concentration in venous blood draining the rumen
and that in arterial blood provides a measure of the amount entering the blood
from the rumen, if the rate of blood flow is known. Vessels normally sampled
are the portal vein and the carotid artery. This method was used by Barcroft
et al. (1944) to demonstrate that acids from the rumen fermentation are
absorbed and utilized by the host. Metabolism of VFA in the rumen wall,
however, precludes accurate estimation of ruminal VFA production. Bergman
(1975) estimated that in sheep receiving a forage diet, approximately 90% of
the butyrate, 50% of the propionate and 30% of the acetate produced in the
rumen did not appear in the portal blood. These values were generally in good
agreement with in vitro data on the loss of VFA transported across the rumen
epithelium (review Re
´
mond et al., 1995). However, Kristensen et al. (2000)
observed considerably higher recovery rates of acetate and propionate in the
temporarily isolated rumen of sheep. To explain the differences, Kristensen
et al. (2000) suggested substantial microbial utilization of VFA. Also, measure-
ments of blood flow show considerable variability (Dobson, 1984).
Methane production
Methane production is an index of rumen fermentation, which has been used to
obtain indirect estimates of VFA production. Total methane production can be
measured in intact, non-fistulated animals using indirect calorimetry (McLean
and Tobin, 1987) or the polytunnel method (Lockyer and Jarvis, 1995).
Calorimetry and the polytunnel, however, overestimate the ruminal contribu-
tion; Murray et al. (1976), for example, showed that the production of
methane in the rumen of sheep fed lucerne chaff accounted for 87% of the
total production. Alternatively, ruminal methane production can be measured
with fistulated animals using isotope dilution techniques (Murray et al., 1976,
1978; France et al., 1993). Also, non-isotopic tracer techniques have been
developed to measure ruminal methane production in free-moving, intact
animals, such as the sulphur hexafluoride (SF
6
) method (Johnson et al.,
1994). The value obtained for methane production is then multiplied by the
164 J. France and J. Dijkstra
ratio of individual or total VFA produced to methane produced. This ratio may
either be determined in vitro using rumen samples, or calculated stoichiome-
trically (Murray et al., 1978), provided the VFA proportions are known. The
method relies on a close relationship between VFA and methane produced,
based on the need to maintain redox balance in the rumen. However, a number
of other factors, including the uptake of hydrogen for biohydrogenation of
unsaturated long-chain fatty acids and the uptake or release of hydrogen for
microbial protein synthesis, may impair this relationship (Mills et al., 2001).
Tracer Methods of VFA Production Measurement
The tracer methods developed in this section are described for radioactive iso-
topes, though they are equally valid for stable isotopes (see end of section, page
171). For measurement of VFA production by radioactive isotopic tracer tech-
niques, Bruce et al. (1987) recommended the use of 1 or 2-
14
C acetate, 2-
14
C
propionate and1-
14
C butyrate. 2-3
3
H butyrate may also be used (Leng and Brett,
1966), but 2-
3
H acetate is unsatisfactory (Leng and Leonard, 1965).
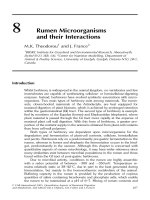
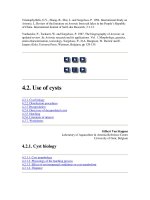
Single-pool scheme
A relatively simple approach, which assumes steady-state conditions as im-
posed by continuous feeding, was proposed by Weller et al. (1967), whereby
total VFA is considered to behave as a homogeneous pool and therefore can be
represented as a single-pool model (Fig. 6.2). The isotopic form of any one of
the individual VFAs or a mixture of the VFAs is administered into the rumen by
continuous infusion at a constant rate, I (mCi=h), and the plateau specific
activity of the total VFA, s (mCi=mmol), is subsequently determined from the
isotope concentration (mCi=ml) and total VFA concentration (mmol/ml) in
rumen liquid. The rate:state equations, based on mass conservation principles,
for this steady-state scheme are:
dQ
dt
¼ F
vo
À F
ov
(6:5)
dq
dt
¼ I À sF
ov
(6:6)
VFA, Q
F
vo
F
ov
(a)
q
I
sF
ov
(b)
Fig. 6.2. Single-compartment model for estimating
VFA production: (a) tracee and (b) tracer. The scheme
assumes no re-entry of label into the rumen. Q, total
VFA; q, quantity of tracer; F
vo
, rate of de novo VFA
production; F
ov
, rate of VFA removal; s, plateau
specific activity of total VFA; and I, infusion rate.
Volatile Fatty Acid Production 165
where Q (mmol) denotes total VFA, q (mCi) the quantity of tracer, F
vo
(mmol/h)
the rate of production de novo (i.e. entry into the pool) and F
ov
(mmol/h) the
rate of removal. The g carbon can equally well be used instead of the mmol as
the unit of mass. On solving Eqs (6.5) and (6.6), the rate of VFA production
becomes:
F
vo
¼ I=s (6:7)
The production rate of the individual VFA is then obtained from their respective
concentrations in the rumen liquid by assuming that production is proportional
to concentration, e.g.
Rate of acetate production ¼ F
vo
C
a
=C
v
(6:8)
where C
a
and C
v
(both mmol/ml) are the concentrations of acetate and total
VFA, respectively.
Assuming isotope concentration and total VFA concentrations are meas-
ured in a number of samples, then the rate of VFA production may be
calculated from Eq. (6.7) using either the mean specific activity or the specific
activity of a pooled sample or, alternatively, by multiplying the infusion rate by
the mean reciprocal specific activity. Although with steady-state conditions all
three procedures should give the same result, Morant et al. (1978) found in
simulation studies with non-steady-state conditions that estimates obtained
using the latter procedure were closer to the true production rates and recom-
mended its use in preference to the other two. (Note: Eq. (4) in Morant et al.
(1978) should read M
R
¼ (I
R
=n)
P
n
i¼1
M
i
=I
i
:)
Weller’s method can be adapted for single-dose injection of tracer, rather
than continuous infusion. Equation (6.6) reduces to:
dq
dt
¼ÀsF
ov
(6:9)
where s is now the instantaneous specific activity. Integration of Eq. (6.9) with
respect to time between time zero and infinity gives:
ÀD ¼ÀAF
ov
(6:10)
where D (mCi) is the dose injected at time zero and A ¼
Ð
1
0
sdt
ÀÁ
denotes the
area under the VFA specific activity–time curve. As the rate of removal equals
that of production in steady state, then:
F
vo
¼ D=A (6:11)
i.e. the rate of VFA production equals dose over area under the specific
activity–time curve.
When the system is not in steady state (i.e. with animals that are not
continuously fed), the VFA pool size, Q, and the production rate will vary
166 J. France and J. Dijkstra
with time. Under these conditions, the instantaneous production rate of the
total VFA, F
vo
, if it behaves as a single homogeneous pool and the tracer is
administered by continuous infusion, is given by:
F
vo
¼ (I=s) þ sQ
d(1=s)
dt
(6:12)
Equation (6.12) is derived using the rate:state equations for Weller’s method
in non-steady-state (i.e. from Eqs. (6.5) and (6.6) not equated to zero) and
eliminating the flow F
ov
. It applies from the instant of commencement of
infusion.
The instantaneous production rate may be determined by varying the
rate of isotope infusion in synchrony with the rate of VFA production so that
the specific activity remains constant, and therefore, the differential term in
Eq. (6.12) is equal to zero. Gray et al. (1966) used this method to measure
VFA production in sheep fed twice daily but, since it is dependent on prior
knowledge of the rate of VFA production, it is unlikely to be of general
applicability.
An alternative approach, proposed by Morant et al. (1978), is to infuse the
isotope at a constant rate, and monitor the variable liquid volume of the rumen
and its isotope and total VFA concentrations (thus permitting determinations
of total VFA pool size Q and its specific activity s at time t). Variable volume can
be determined using one of the methods described in France et al. (1991a).
The differential term in Eq. (6.12) is given by the slope of the curve of
inverse specific activity against time. A way of determining this slope is to fit
a polynomial of the form:
f(t) ¼
X
n
i¼0
a
i
t
i
(6:13)
where the a
i
denotes constant coefficients, to the serial values of inverse
specific activity, and then find the derivative f
0
by differentiating analytically.
The values of F
vo
, the rate of VFA production, at the times of ruminal sampling
(any time after the start of infusion) can be found by substituting the appropriate
instantaneous values for s, Q and d(1/s)/dt (¼ f
0
) into Eq. (6.12). The rates of
production of the individual VFA may be obtained by partitioning F
vo
according
to their instantaneous molar proportions in rumen liquid as in Eq. (6.8). This
non-steady-state approach also applies if the isotope is given as a single-dose
injection, but with Eq. (6.12) simplifying to:
F
vo
¼ sQ
d(1=s)
dt
(6:14)
In non-steady-state, it may not be necessary to monitor changes in rumen
volume. Sutton et al. (2003), in dairy cattle fed diets with high (90%) or
moderate (60%) concentrate levels (air dry basis) twice daily, observed a mean
Volatile Fatty Acid Production 167
increase in rumen liquid digesta after feeding of 19% and 21%, respectively.
Such differences in rumen volume resulted in only minor differences in esti-
mates of net production rates of VFA obtained by continuous infusion of
acetate, propionate and butyrate in a three-pool scheme (next section, this
page). This suggests that, in practice, attempts to make accurate measurements
of diurnal changes in rumen volume may not be necessary.
Three-pool scheme
Weller’s method has the advantages that only one infusion (or single injection)
experiment needs to be undertaken and the specific activities of the individual
VFAs do not have to be determined. However, it is dependent on the produc-
tion rate of the acids being proportionally the same as their concentration in
rumen liquid and this may not always be so (Sutton, 1985).
An alternative method for estimating VFA production rates in steady state,
which is not dependent on the proportionality between VFA production and
concentration and also provides a more detailed description of VFA metabol-
ism in the rumen (thus permitting total rather than just net production to be
estimated), is to use interchanging compartmental models to interpret isotopic
tracer data. The models may be complete – i.e. exchange between all pools
(plus the external environment) included – or incomplete (i.e. exchange be-
tween some pools excluded). Tracer is administered into each pool in turn and
on each occasion the specific activity of all pools is determined. A unique
solution to the model is obtained by deriving a series of n simultaneous equa-
tions (where n is the number of flows included in the model) to describe the
movement of tracer and tracee between pools.
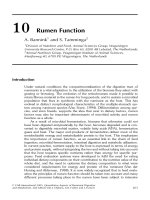
Consider the fully interchanging three-pool model for acetate, propionate
and butyrate (Fig. 6.3). This scheme was proposed by Bergman et al. (1965)
using sheep but with no interconversion between propionate and butyrate
(i.e. F
bp
¼ F
pb
¼ 0). Under steady-state conditions, the isotopic form of each
VFA in turn is continuously infused into the rumen at a constant rate and for
each infusion the plateau specific activity (mCi=g carbon) of acetate (s
a
), propi-
onate (s
p
) and butyrate (s
b
) is determined. Since the system is in steady state, the
rate:state equations are as follows. The movement of tracee acetate, Q
a
(g
carbon), is described by:
dQ
a
dt
¼ F
ao
þ F
ap
þ F
ab
À F
oa
À F
pa
À F
ba
¼ 0(6:15)
Following the infusion of labelled acetate, I
a
(mCi=h), the movement of label
through the acetate pool, q
a
(mCi), is described by:
dq
a
dt
¼ I
a
þ s
p
F
ap
þ s
b
F
ab
À s
a
(F
oa
þ F
pa
þ F
ba
) ¼ 0, (6:16)
through the propionate pool, q
p
,by:
168 J. France and J. Dijkstra
dq
p
dt
¼ s
a
F
pa
þ s
b
F
pb
À s
p
(F
op
þ F
ap
þ F
bp
) ¼ 0(6:17)
and through the butyrate pool, q
b
, by:
dq
b
dt
¼ s
a
F
ba
þ s
p
F
bp
À s
b
(F
ob
þ F
ab
þ F
pb
) ¼ 0(6:18)
Similar equations may be derived to describe the movement of tracee propi-
onate and butyrate and the movement of label when labelled propionate and
butyrate are infused into the rumen. The resulting 12 simultaneous linear
equations may be solved using a simple computational procedure (France
et al., 1987).
The method can also be adapted for single-dose injection of tracer. The
system is now in non-isotopic steady state so the rate:state equations for
labelled material are non-zero. In the three-pool scheme, movement of label
through the acetate pool following injection at time zero of a single dose of
labelled acetate, D
a
(mCi), is given by:
dq
a
dt
¼ s
p
F
ap
þ s
b
F
ab
À s
a
(F
oa
þ F
pa
þ F
ba
)(6:19)
through the propionate pool by:
dq
p
dt
¼ s
a
F
pa
þ s
b
F
pb
À s
p
(F
op
þ F
ap
þ F
bp
)(6:20)
and through the butyrate pool by:
Butyrate
Butyrate
Propionate
Propionate
Acetate
Acetate
F
ao
F
ba
F
ap
F
bo
F
pb
F
bp
F
op
F
po
F
ob
F
pa
F
ab
F
oa
I
a
(a)
(b)
Fig. 6.3. Fully interchanging
three-compartment model for
acetate, propionate and butyrate
production: (a) tracee and (b) tracer.
The scheme assumes no re-entry of
label into the rumen.
Volatile Fatty Acid Production 169
dq
b
dt
¼ s
a
F
ba
þ s
p
F
bp
À s
b
(F
ob
þ F
ab
þ F
pb
)(6:21)
The s terms now refer to instantaneous specific activities. Integrating these
three equations with respect to time between the limits zero and infinity yields:
ÀD
a
¼ A
p
F
op
þ A
b
F
ab
À A
a
(F
oa
þ F
pa
þ F
ba
)(6:22)
0 ¼ A
a
F
pa
þ A
b
F
pb
À A
p
(F
op
þ F
ap
þ F
bp
)(6:23)
0 ¼ A
a
F
ba
þ A
p
F
bp
À A
b
(F
ob
þ F
ab
þ F
pb
)(6:24)
where A
a
, A
p
and A
b
are the areas under the acetate, propionate and butyrate
specific activity–time curves, respectively (i.e. A
a
¼
Ð
1
0
s
a
dt, etc.). Eqs (6.22)–
(6.24) can be derived for the movement of label when labelled propionate and
butyrate are injected into the rumen. The system of equations for single dose is
therefore the same as for constant infusion, but with dose and area replacing
infusion rate and plateau specific activity, respectively.
The method can also be extended to the non-steady-state. Under
non-steady-state conditions and constant infusion, movements of tracee and
label in the three-pool model are described by the same set of 12 equations as
represented in Eqs (6.15)–(6.18), but with the derivatives not now equated to
zero. Instantaneous values of the derivatives may be determined in a similar way
as for the single-pool model, by monitoring the variable liquid volume of the
rumen and its tracee and isotopic concentrations of acetate, propionate and
butyrate. An expression for each derivative term in the equation set is obtained
by fitting a polynomial (Eq. (6.13)) to serial data on isotope/tracee pool size and
differentiating analytically. Instantaneous values of the flows can then be found
by solving the 12 equations using a similar computational procedure to that
described in France et al. (1987). This approach also works if isotope admin-
istration is by single injection rather than constant infusion, but in this case the
three infusion rates represented in the equation set (e.g. I
a
in Eq. (6.16))
become zero. However, it does not work if isotope is administered by single
continuous infusion and the infusion rate varied, as in Gray et al. (1966). This is
only applicable to a one-pool scheme because a single infusion cannot gener-
ally stabilize the specific activity of more than one pool. The single-pool model
(Fig. 6.2) can be derived from the three-pool representation (Fig. 6.3) by
assuming that the external flows F
oa
, F
op
and F
ob
are directly proportional to
their respective concentrations in the rumen (France et al., 1991b). The
mathematical analysis presented for the three-pool scheme can be extended
to any number of pools.
There appear to be no reports of the application of fully interconverting
three-pool schemes in dairy cattle, except for that of Sutton et al. (2003). In
sheep, Bergman et al. (1965), the first authors to propose the three-pool
scheme, excluded the propionate:butyrate C exchange as being insignificant.
Annison et al. (1974) and Lebzien et al. (1981) obtained results for only two
labelled VFAs in dairy cattle. Other authors have used variations of the three-
pool scheme (Esdale et al., 1968; Armentano and Young, 1983) or a four-pool
170 J. France and J. Dijkstra
model (Wiltrout and Satter, 1972; Sharp et al., 1982) with cattle, but in all cases
some interconversions were omitted. Generally, a large amount of C exchange
between acetate and butyrate is reported. However, whilst several authors
observed very little exchange between propionate and butyrate (Bergman
et al., 1965; Annison et al., 1974; Sharp et al., 1982), Sutton et al. (2003)
reported 10–13% of propionate C to be derived from butyrate, whereas 2–4%
of butyrate C was derived from propionate. This argues against omitting the
propionate:butyrate C exchange from three-pool schemes.
The tracer methods described in this chapter employ radioactive isotopes
such as 1-
14
C acetate. Stable isotopes such as 1-
13
C acetate could be used
equally well, though they have to be administered in larger amounts in order to
bring ruminal enrichments up to detectable levels, and hence their use is more
costly. The models presented, together with the associated mathematical for-
mulae (Eqs (6.5)–(6.24)), remain the same for stable isotopes, though minor re-
definition of the entities used in the models is needed. These are presented in
Table 6.2.
Conclusions
The fermentation pattern and total supply of VFA are major determinants of
feed utilization by the ruminant. Many attempts have therefore been made to
estimate the rates of individual and total VFA production in and removal from
the rumen. Originally, non-tracer methods such as the zero-time in vitro and
the perturbation of steady-state methods were employed. These have now
been superseded by tracer methods utilizing compartmental analysis to inter-
pret isotope dilution data. The tracer-based attempts generally adopt either a
single-pool scheme (total VFA) or a three-pool scheme (acetate, propionate
and butyrate), and normally steady-state conditions are assumed and label is
continuously administered by constant infusion. The assumption of ruminal
steady state particularly is rather restrictive in that it is only likely to apply to
Table 6.2. Re-definition of entities in the two- and three-pool models for estimating VFA
production when using stable isotopes.
C
i
(mmol/l) Concentration of VFA i in rumen liquid
D
i
(mmol) Pulsed dose of labelled VFA i administered into primary pool at
time zero
F
ij
(mmol/h) Total flow (labelled plus unlabelled) from pool i to pool j, F
io
denotes an external flow into pool i and F
oj
a flow from pool j out
of the system
I
i
(mmol/h) Constant rate of continuous infusion of labelled VFA i into primary pool
Q
i
(mmol) Total quantity (labelled plus unlabelled) of VFA i in rumen liquid
q
i
(mmol) Quantity of labelled VFA i in rumen liquid
s
i
Enrichment of pool i (¼q
i
=Q
i
): mmol labelled VFA i /(mmol total VFA i )
Volatile Fatty Acid Production 171
frequently fed animals. The methods, however, can be adapted for non-steady-
state conditions and for single injection of label, and extended to any number of
pools.
References
Annison, E.F., Bickerstaffe, R. and Linzell, J.L. (1974) Glucose and fatty acid metabol-
ism in cows producing milk of low fat content. Journal of Agricultural Science,
Cambridge 82, 87–95.
Armentano, L.E. and Young, J.W. (1983) Production and metabolism of volatile fatty
acids, glucose and CO
2
in steers and the effects of monensin on volatile fatty acid
kinetics. Journal of Nutrition 113, 1265–1277.
Barcroft, J., McAnally, R.A. and Phillipson, A.T. (1944) Absorption of volatile acids
from the alimentary tract of sheep and other animals. Journal of Experimental
Biology 20, 120–129.
Bath, I.H., Balch, C.C. and Rook, A.J.F. (1962) A technique for the estimation of the
ruminal production of volatile fatty acids in the cow. Proceedings of the Nutrition
Society 21, ix–x.
Bergman, E.N. (1975) Production and utilisation of metabolites by the alimentary tract
as measured in portal and hepatic blood. In: McDonald, I.W. and Warner, A.C.I.
(eds) Digestion and Metabolism in the Ruminant. University of New England
Publishing Unit, Armidale, New South Wales, pp. 292–305.
Bergman, E.N. (1990) Energy contribution of VFA from the gastrointestinal tract in
various species. Physiological Reviews 70, 567–590.
Bergman, E.N., Reid, R.S., Murray, M.G., Brockway, J.M. and Whitelaw, F.G. (1965)
Interconversions and production of volatile fatty acids in the sheep rumen. Bio-
chemical Journal 97, 53–58.
Bruce, L.A., Lobley, G.E. and MacRae, J.C. (1987) Measurement of volatile fatty acid
production rates in sheep given roughage. Research in Veterinary Science 42,
47–52.
Cotta, M.A. and Hespell, R.B. (1986) Protein and amino acid metabolism of rumen
bacteria. In: Milligan, L.P., Grovum, W.L. and Dobson, A. (eds) Control of Diges-
tion and Metabolism in Ruminants. Prentice-Hall, Englewood Cliffs, New Jersey,
pp. 122–136.
Davis, C.L. (1967) Acetate production in the rumen of cows fed either control or low-
fiber, high-grain diets. Journal of Dairy Science 50, 1621–1625.
Dijkstra, J. (1994) Production and absorption of volatile fatty acids in the rumen.
Livestock Production Science 39, 61–69.
Dijkstra, J., Boer, H., van Bruchem, J., Bruining, M. and Tamminga, S. (1993)
Absorption of VFA from the rumen of lactating dairy cows as influenced by VFA
concentration, pH and rumen liquid volume. British Journal of Nutrition 69,
385–396.
Dobson, A. (1984) Blood flow and absorption from the rumen. Quarterly Journal of
Experimental Physiology 69, 599–606.
Esdale, W.J., Broderick, G.A. and Satter, L.D. (1968) Measurement of ruminal volatile
fatty acid production from alfalfa hay or corn silage rations using a continuous
infusion isotope dilution technique. Journal of Dairy Science 51, 1823–1830.
France, J., Gill, M., Dhanoa, M.S. and Siddons, R.C. (1987) On solving the fully
interchanging N-compartment model in steady-state tracer kinetic studies with
172 J. France and J. Dijkstra
reference to VFA absorption from the rumen. Journal of Theoretical Biology
125, 193–211.
France, J., Siddons, R.C., Dhanoa, M.S. and Thornley, J.H.M. (1991a) A unifying
mathematical analysis of methods to estimate rumen volume using digesta markers
and intraruminal sampling. Journal of Theoretical Biology 150, 145–155.
France, J., Siddons, R.C. and Dhanoa, M.S. (1991b) Adaptation of compartmental
schemes for interpreting isotope dilution data on volatile fatty acid metabolism in
the rumen to the non-steady state and for single-dose injection. Journal of Theor-
etical Biology 153, 247–254.
France, J., Beever, D.E. and Siddons, R.C. (1993) Compartmental schemes for esti-
mating methanogenesis in ruminants from isotope dilution data. Journal of The-
oretical Biology 164, 207–218.
Gray, F.V., Weller, R.A., Pilgrim, A.F. and Jones, G.B. (1966) The rate of production
of volatile fatty acids in the rumen. III. Measurement of production in vivo by
two isotope dilution procedures. Australian Journal of Agricultural Research
17, 69–80.
Hungate, R.E. (1966) The Rumen and its Microbes. Academic Press, New York.
Hungate, R.E., Phillips, G.D., Hungate, D.P. and MacGregor, A. (1960) A comparison
of the rumen fermentation in European and Zebu cattle. Journal of Agricultural
Science, Cambridge 54, 196–201.
Johnson, K.A., Huyler, M., Westberg, H., Lamb, B. and Zimmerman, P. (1994)
Measurement of methane emissions from ruminant livestock using a SF
6
tracer
technique. Environmental Science and Technology 28, 359–362.
Kristensen, N.B., Ga
¨
bel, G., Pierzynowski, S.G. and Danfaer, A. (2000) Portal recovery
of short-chain fatty acids infused into the temporarily-isolated and washed reticulo-
rumen of sheep. British Journal of Nutrition 84, 477–482.
Lebzien, P., Rohr, K. and Oslage, H.J. (1981) Untersuchungen u
¨
ber die Abha
¨
ngigheit
der Fettsa
¨
ureproduktion im Pansen von der Rationszusammensetzung. Archiv fu¨r
Tiererna¨hrung 31, 685–696.
Leng, R.A. and Brett, D.J. (1966) Simultaneous measurements of the rates of produc-
tion of acetic, propionic and butyric acids in the rumen of sheep on different diets
and the correlation between production rates and concentrations of these acids in
the rumen. British Journal of Nutrition 20, 541–552.
Leng, R.A. and Leonard, G.J. (1965) Losses of methyl tritium from
3
H acetate in rumen
fluid. Nature (London) 207, 760–761.
Lockyer, D.R. and Jarvis, S.C. (1995) The measurement of methane losses from
grazing livestock. Environmental Pollution 90, 383–390.
Lopez, S., Hovell, F.D.DeB., Dijkstra, J. and France, J. (2003) Effects of volatile fatty
acids supply on their absorption and on water kinetics in the rumen of sheep
sustained by intragastric infusions. Journal of Animal Science 81, 2609–2616.
MacRae, J.C. and Lobley, G.E. (1982) Some factors which influence thermal energy
losses during the metabolism of ruminants. Livestock Production Science 9,
447–456.
Mansfield, H.R., Endres, M.I. and Stern, M.D. (1995) Comparison of microbial fermen-
tation in the rumen of dairy cows and dual flow continuous culture. Animal Feed
Science and Technology 55, 47–66.
Martin, C., Kristensen, N.B. and Huhtanen, P. (2001) Comparison of non-tracer and
tracer methods for determination of volatile fatty acid production rate in the rumen
of sheep fed on two levels of intake. British Journal of Nutrition 86, 331–340.
McLean, J.A. and Tobin, G. (1987) Animal and Human Calorimetry. Cambridge
University Press, Cambridge.
Volatile Fatty Acid Production 173
Mills, J.A.N., Dijkstra, J., Bannink, A., Cammell, S.B., Kebreab, E. and France,
J. (2001) A mechanistic model of whole-tract digestion and methanogenesis in
the lactating dairy cow: model development, evaluation and application. Journal of
Animal Science 79, 1584–1597.
Morant, S.V., Ridley, J.L. and Sutton, J.D. (1978) A model for the estimation of volatile
fatty acid production in the rumen in non-steady-state conditions. British Journal
of Nutrition 39, 451–462.
Murray, R.M., Bryant, A.M. and Leng, R.A. (1976) Rates of production of methane in
the rumen and large intestine of sheep. British Journal of Nutrition 36, 1–14.
Murray, R.M., Bryant, A.M. and Leng, R.A. (1978) Methane production in the
rumen and lower gut of sheep given lucerne chaff. British Journal of Nutrition
39, 337–345.
Nagaraja, T.G., Newbold, C.J., Van Nevel, C.J. and Demeyer, D.I. (1997) Manipulation
of rumen fermentation. In: Hobson, P.N. and Stewart, C.S. (eds) The Rumen
Microbial Ecosystem, 2nd edn. Blackie Academic and Professional, London,
pp. 387–443.
Ørskov, E.R. (1975) Manipulation of rumen fermentation for maximum food utilisation.
World Review of Nutrition and Dietetics 22, 152–182.
Ørskov, E.R. (1981) Recent advances in the understanding of cereal processing for
ruminants. In: Haresign, W. and Cole, D.J.A. (eds) Recent Developments in
Ruminant Nutrition. Butterworths, London, pp. 258–267.
Re
´
mond, D., Ortigues, I. and Jouany, J.P. (1995) Energy substrates for the rumen
epithelium. Proceedings of the Nutrition Society 54, 95–105.
Rogers, J.A. and Davis, C.J. (1982a) Rumen volatile fatty acid production and nutrient
utilisation in steers fed a diet supplemented with sodium bicarbonate and monensin.
Journal of Dairy Science 65, 944–952.
Rogers, J.A. and Davis, C.J. (1982b) Effects of intraruminal infusions of mineral salts on
volatile fatty acid production in steers fed high-grain and high-roughage diets.
Journal of Dairy Science 65, 953–962.
Sharp, W.M., Johnson, R.R. and Owens, F.N. (1982) Ruminal VFA production with
steers fed whole or ground corn grain. Journal of Animal Science 55, 1505–
1514.
Siciliano-Jones, J. and Murphy, M.R. (1989) Production of volatile fatty acids in the
rumen and caecum-colon of steers as affected by forage:concentrate and forage
physical form. Journal of Dairy Science 72, 485–492.
Siddons, R.C., Arricastres, C., Gale, D.L. and Beever, D.E. (1984) The effect of
formaldehyde or glutaraldehyde application to lucerne before ensiling on silage
fermentation and silage N digestion in sheep. British Journal of Nutrition 52,
391–401.
Stevens, C.E. (1970) Fatty acid transport through the rumen epithelium. In: Phillipson,
A.T. (ed.) Physiology of Digestion and Metabolism in the Ruminant. Oriel Press,
Newcastle-upon-Tyne, UK, pp. 101–112.
Sutton, J.D. (1972) In vivo measurement of energy supply and protein synthesis in the
rumen. In: Tracer Studies on Non-Protein Nitrogen for Ruminants. International
Atomic Energy Agency, Vienna, Italy, pp. 35–42.
Sutton, J.D. (1979) Carbohydrate fermentation in the rumen – variations on a theme.
Proceedings of the Nutrition Society 38, 275–281.
Sutton, J.D. (1985) Digestion and absorption of energy substrates in the lactating cow.
Journal of Dairy Science 68, 3376–3393.
Sutton, J.D., Dhanoa, M.S., Morant, S.V., France, J., Napper, D.J. and Schuller, E.
(2003) Rates of production of acetate, propionate and butyrate in the rumen of
174 J. France and J. Dijkstra
lactating dairy cows given normal and low-roughage diets. Journal of Dairy
Science 86, 3620–3633.
Thomas, P.C. and Clapperton, J.L. (1972) Significance to the host of changes in
fermentation activity. Proceedings of the Nutrition Society 31, 165–177.
Thomas, P.C. and Rook, A.J.F. (1981) Manipulation of rumen fermentation. In: Hare-
sign, W. and Cole, D.J.A. (eds) Recent Developments in Ruminant Nutrition.
Butterworths, London, pp.157–183.
Warner, A.C.I. (1964) Production of volatile fatty acids in the rumen: methods of
measurement. Nutrition Abstracts and Reviews 34, 339–352.
Weekes, T.E.C. and Webster, A.J.F. (1975) Metabolism of propionate in the tissues of
the sheep gut. British Journal of Nutrition 33, 425–438.
Weigland, E., Young, J.W. and McGilliard, A.D. (1972) Extent of propionate metabol-
ism during absorption from the bovine ruminoreticulum. Biochemical Journal
126, 201–209.
Weller, R.A., Gray, F.V., Pilgrim, A.F. and Jones, G.B. (1967) The rates of production
of volatile fatty acids in the rumen. IV. Individual and total volatile fatty acids.
Australian Journal of Agricultural Research 18, 107–118.
Weston, R.J. and Hogan, J.P. (1968) The digestion of pasture plants by sheep. I.
Ruminal production of volatile fatty acids by sheep offered diets of ryegrass and
forage oats. Australian Journal of Agricultural Research 19, 419–432.
Weston, R.J. and Hogan, J.P. (1971) The digestion of pasture plants by sheep. V.
Studies with subterranean and berseem clovers. Australian Journal of Agricul-
tural Research 22, 139–157.
Whitelaw, F.G., Hyldgaard-Jensen, J., Reid, R.S. and Kay, M.G. (1970) Volatile fatty
acid production in the rumen of cattle given an all-concentrate diet. British Journal
of Nutrition 24, 179–195.
Williams, A.G. and Coleman, G.S. (1997) The rumen protozoa. In: Hobson, P.N. and
Stewart, C.S. (eds) The Rumen Microbial Ecosystem, 2nd edn. Blackie Academic
and Professional, London, pp. 73–138.
Wiltrout, D.W. and Satter, L.D. (1972) Contribution of propionate to glucose synthesis
in the lactating and non-lactating cow. Journal of Dairy Science 55, 307–317.
Ziemer, C.J., Sharp, R., Stern, M.D., Cotta, M.A., Whitehead, T.R. and Stahl, D.A.
(2000) Comparison of microbial populations in model and natural rumens using
16S ribosomal RNA-targeted probes. Environmental Microbiology 2, 632–643.
Volatile Fatty Acid Production 175
This page intentionally left blank