Regulatory changes and long run relationships of the EMU sovereign debt markets implications for future policy framework
Bạn đang xem bản rút gọn của tài liệu. Xem và tải ngay bản đầy đủ của tài liệu tại đây (1.88 MB, 14 trang )
International Review of Law and Economics 63 (2020) 105907
Contents lists available at ScienceDirect
International Review of Law and Economics
Regulatory changes and long-run relationships of the EMU sovereign
debt markets: Implications for future policy framework
Erdinc Akyildirim a,b,g , Shaen Corbet c,h , Duc Khuong Nguyen d,e,∗ , Ahmet Sensoy f
a
Department of Banking and Finance, University of Zurich, Zurich, Switzerland
Department of Mathematics, ETH, Zurich, Switzerland
DCU Business School, Dublin City University, Dublin 9, Ireland
d
IPAG Business School, Paris, France
e
International School, Vietnam National University, Hanoi, Viet Nam
f
Faculty of Business Administration, Bilkent University, Ankara, 06800, Turkey
g
Center for Financial Application and Research, Bo˘gazic¸i University, Istanbul, Turkey
h
School of Accounting, Finance and Economics, University of Waikato, New Zealand
b
c
a r t i c l e
i n f o
Article history:
Received 11 July 2019
Received in revised form 4 December 2019
Accepted 31 March 2020
Available online 23 May 2020
JEL classification:
C58
F36
G01
G18
Keywords:
DCC-MIDAS
European Union
Sovereign bonds
Regulation
Financial crisis
a b s t r a c t
We estimate the time-varying long-run correlations of European sovereign bond markets to identify
specific effects that are attributed to changing European regulatory and political dynamics over the last
twenty years. Our empirical results from using the DCC-MIDAS methodology indicate that regulatory
changes in Europe have created significant and negative impact on the long-run correlations within the
month where the regulation is decided to be taken into action. This impact still remains in the following
months and robust with respect to the trend component of the long-run correlations. A direct implication
is that the more regulations the EU attempts to put in place, the lower the long-run convergence process of
sovereign bond markets is. We then analyse the structural shifts in the long-run correlation dynamics with
penalized contrasts methodology and try to find out the reasons of these severe changes. Accordingly,
some of the structural shifts overlap with the dates of a limited number of regulatory changes, in addition
to the major global economic and political events.
© 2020 Elsevier Inc. All rights reserved.
1. Introduction
The European Union has witnessed substantial structural, regulatory and political changes in the past twenty years since the
introduction of the euro. Much research has focused on the development of a broad convergence in the yields of European bonds
after the development of a strong monetary union (Codogno et al.,
2003; Kim et al., 2006; Christiansen, 2007). This is particularly
important due to the broad diversification effects that existed
through the creation of such a cohort of sovereign states, each offering quite unique strengths and skills to the union, with the smallest
countries seeking added economic security through diversification,
shared skills, experiences, financing sources, and the reinforced
∗ Corresponding author at: IPAG Business School, 184 Boulevard Saint-Germain,
75006 Paris, France.
E-mail address: (D.K. Nguyen).
/>0144-8188/© 2020 Elsevier Inc. All rights reserved.
bargaining strength that was provided through such a large number of countries when negotiating international trade agreements.
However, these countries also incorporated broad structural issues
towards the European Monetary Union (EMU), manifesting in what
can only be described as one of the worst sovereign debt crises taking place in countries such as Greece, Ireland, Portugal, Italy, Cyprus
and Spain. Among these countries, both Greece and Ireland necessitated third-party financial support and intervention due to the
deep-rooted nature of their sovereign banking crises.1 The development of the EMU has also withdrawn both monetary and many
1
Specifically focusing on the Irish economic collapse, Corbet (2016) discusses
the broad regulatory deficiency that existed in Ireland during the generation of the
‘Celtic Tiger,’ a period synonymous with the rapid expansion of the Irish economy,
where the actions of its regulators and policy makers undoubtedly generated not
only a catalyst to financial ruin, but also an incubator to strengthen its severity. Banks
were found to be firmly leveraged towards the Irish property market and the role
of leverage in financial markets created mispricing, to which the basic principles of
2
E. Akyildirim, S. Corbet, D.K. Nguyen et al. / International Review of Law and Economics 63 (2020) 105907
fiscal policy options as tools through which the crisis can be mitigated and alleviated. This was evident in the economic collapse
of the countries denoted as ‘PIIGS’ as monetary policy had to be
tailored to the needs of the EMU rather than the needs of specific
nations.
The regulatory responses made by the European Union have
been quite strong in the post-crisis era. Following the outbreak
of the financial crisis, European regulatory reforms have focused
on four key areas: (1) the strengthening of financial supervision;
(2) the creation of tools to support bank recovery and resolution;
(3) the creation of a more effective deposit protection system; and
(4) the creation of an improved regulatory framework for banks,
insurance companies, securities markets and other sectors. We
must focus on analysing as to how these reforms have made the
financial system more stable and resilient and as to whether they
have influenced the perceptions of bond traders as measured by the
yields of sovereign debt. Such regulatory restructuring necessitates
re-evaluation of the many ways in which European corporations
interact, particularly cross-border entities that are part of the same
institution. Such reforms introduced after the crisis also need to
be monitored to check whether they are delivering intended outcomes and to assess whether the new rules have any unintended
consequences. Appendix A provides a detailed overview of the key
completed reforms that have been introduced along with the rationale supporting their introduction.
Some of the earliest commissioned and now completed financial reforms include those related to the risk-based prudential and
solvency rules for insurers (Solvency II), AIFMD, CRD III, the establishment of the European Supervisory Authority, deposit guarantee
schemes, derivative reform through EMIR, the creation of the Single Euro Payments Area (SEPA), MIFID, and a wide range of market
abuse and transparency reforms among others.2 The European
Commission developed such reforms through the establishment of
a number of policy advising expert groups,3 representing consultative bodies set up by the Commission to provide advices in relation
to the preparation of legislative acts and policy initiatives usually
composed of experts appointed by EU governments.
As far as the sovereign debt crisis is concerned, a common wisdom is that the regulatory changes affect the dynamics of sovereign
risks and the ways the sovereign bond markets co-move over time.
In this paper, we give a close look to this issue by considering a broad
range of the European regulatory reforms as potential sources of
changing time-varying bond market behaviour. We also devote
our attention to some of the many significant political events that
have occurred during the past twenty years in Europe as political
developments in the European Union, which have been particularly
extraordinary in more recent times, play a pivotal role on regulations. Corbet and Larkin (2018) briefly review these political shifts
the efficient market hypothesis (EMH) failed. This miscalculation of risk was severe
and destructive for the real economy.
2
We must note that there are a wide-range of actions that have been established
but have not yet been completed. These include a number of structural reforms on
banks, the creation of the European deposit insurance scheme (EDIS), rules on capital
requirements, the development of a EU framework on covered bonds, addressing
risks related to NPLs, insurance companies and sovereign bond-backed securities,
and the strengthening of bank recovery and resolution (BRRD) among others. A
summary of these development can be found in Appendix B.
3
The key financial regulation groups established in accordance with Declaration 39 on Article 290 of the Lisbon Treaty include the expert groups on Banking,
Payments and Insurance; Sustainable Finance; Corporate Bond Market Liquidity;
Cross-border redress in financial services; Derivatives and Market Infrastructures
Member States; European Crowdfunding Stakeholders Forum; European Post Trade
Forum; the European Securities Committee; the Expert Group on barriers to free
movement of capital; intra-EU cross border investment environment; the evaluation of the IAS Regulation; Retail Financial Services; Mortgage Credit; the Group of
representatives of financial services employees (UNI Europa); the Payment Systems;
and the Securities Law Directive Member States Working Group.
and show that the latter have developed within the widespread
financial crises and been exacerbated in some states by the dramatic influx of illegal immigration. As a result, Europe finds itself
at a crossroads inspired by political spectrum shifts to the left and
the right, with fear, uncertainty fuelling nationalist revolt across a
host of European nations. Such political shifts have also manifested
in the nationalist-based decision-making resulting in the growth
of right-based decisions such as the Brexit or the Italian budgetary
issues witnessed in recent years. Much evidence has been provided
that contagion effects exists in such political decision-making (Mei
and Guo, 2004; Rajsingh, 2016). It is thus opportune to identify as
to whether such political developments are a source of instability
for time-varying sovereign debt instability, with further emphasis
on the presence of contagion effects.
One of the key data through which we can identify both the
severity and contagion effects of crises is through sovereign bond
yields. Our research shifts attention to the long-run relationship
of sovereign bond markets, instead of their divergence since the
rapid development of both the European regulatory and political
environments. In particular, our methodological choice focuses on
the inherent time variations in such structural destabilizations, i.e.,
as to whether European sovereign bond markets experience longterm structural destabilization in the aftermath of changes in the
regulatory and political environments. This builds on the work of
Colacito et al. (2011) who introduced the DCC-MIDAS methodology
to analyse the long-run correlation components between financial
time series. According to our perspective, while political instability
has quite strong theoretical grounding for producing influence on
sovereign bond markets, it is very important to further understand
as to whether financial markets themselves were in agreement
with the European Central Bank’s views that its regulatory actions
were in fact fostering the resilient and sustainable development of
Europe’s financial landscape. Within this context, such regulatory
intervention might be observed as beneficial to financial stability,
but could also be detrimental to sectoral and regional profitability,
growth and development.
According to our analysis, we contribute to the literature by
showing that the regulatory changes in Europe have significant and
negative impact on the long-run correlations of the sovereign bond
markets of the major eurozone countries. These correlations also
change drastically within the month where the regulation is implemented and this change is preserved within the following months,
showing that effects of regulatory changes in the EU are not transitory and do sustain on the correlation dynamics of these sovereign
bond markets. We check whether this finding is distorted by the
trend components of the long-run correlations or not, and reveal
that the results are robust. A direct implication and one of the main
contributions of the paper is the finding that the more regulations
the EU attempts to put in place, the lower the long-run convergence
process of sovereign bond markets is. Next and as a robustness
check, we focus on detecting potential structural shifts in the longrun correlations and examining whether they are associated with
regulatory changes. By applying the penalized contrasts methodology of Lavielle (2005) to detect the change points, we show that the
structural shifts in the long-run correlations occur around the times
when major regulatory changes or important political events take
place (such as the critical stages of the Brexit process), supporting
our view that both political uncertainties and regulatory actions are
drivers of the long-run relationship between the sovereign bonds
of major eurozone member countries.
The rest of the paper is organized as follows. Section 2 presents
a concise review of the literature based on sovereign bond dynamics, structural changes in European regulatory dynamics and the
influence of broad political events on financial markets. We provide a brief review of the DCC-MIDAS methodology in Section 3.
Section 4 reports the data that we use and the corresponding empir-
E. Akyildirim, S. Corbet, D.K. Nguyen et al. / International Review of Law and Economics 63 (2020) 105907
3
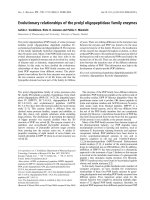
Fig. 1. Fully and partially implemented regulatory changes in Europe, 2006–2018. Note: The above data represents all proposals of financial reform that are finalizedimplemented or being planned by the European Commission. Data available at .
ical results. Section 5 provides some discussions and concluding
remarks.
2. Literature review
The European response to the international financial crises has
generated a broad range of both anticipated and unanticipated
consequences for multiple sovereign states across a range of both
economic and political environments. Within this section, we provide a thorough overview of the key dynamics that have been
observed within European sovereign debt markets, which further
suggests the key identified drivers of instability sourced within economic and political drivers of bond market volatility and contagion.
Kim et al. (2006) were among the first researchers that empirically investigate the influence of the EMU on time variations
in inter-stock-bond market integration/segmentation dynamics to
find that real economic integration and the reduction of currencymarket risk supported financial integration, but in fact generated
a flight-to-safety effect due to broad fears about the future of the
EMU. Christiansen (2007) echoed such evidence of EMU integration in the period after the introduction of the euro with the key
driver identified to be that of interest rates. Corbet (2014) found
that European sovereign downgrades are found to be associated
with an increase in equity returns and cause significant increases in
the cost of insuring debt through CDS and the yield of government
debt. In a recent study, Sensoy et al. (2019) uncovered a high degree
of sovereign debt market integration between the EMU members
over the period preceding the recent financial crises, while segmentation is found afterwards. However, the Fed’s tapering policy
announcement in 2013 generated an impact towards an integration
of these markets again.
Bessembinder et al. (2006) found that changes in market designs
through regulations can have first-order effects on trade execution costs on bonds even for sophisticated institutional investors.
Heathcote and Perri (2002) found that the financial autarky model
can generate volatility in the terms of trade when constructing a two-country, two-good model, to account for observed
cross-country output, consumption, investment and employment
correlations. Such a result identified that international capital flows
are exceptionally important for the international business cycle.
The creation of the EMU would have greatly increased this effect.
The severity of the 2008–2009 global financial crisis and the
European sovereign debt crisis that followed was widely observed
as a critical point in the sharp changes in regulatory dynamics
that followed in Europe. This is obvious in Fig. 1 which presents
evidence of the timeline of introduction of regulatory changes
in Europe, while further considering the announcement of regulatory changes that have not been implemented yet. Mohl and
Sondermann (2013) found that statements about restructuring,
bailout and the involvement of the European Financial Stability
Facility (EFSF) have impacted bond spreads of countries in the
periphery over Germany, indicating that the more different euro
area governments issued statements at the same time, the more
bond spreads have increased. Furthermore, the authors find that
statements from politicians from AAA-rated countries seemed to
have a particularly strong impact on spreads. Lierse and Seelkopf
(2016) found that in the context of financial market pressures
in the form of rising bond yields, European governments raised
their taxes, especially in the more regressive field of indirect taxes,
suggesting that capitalist democracies have little political room
to maneuver and to conduct redistributive politics at times of
high fiscal stress. Katsikas (2011) found that the EU’s decisions
to adopt the standards produced by the International Accounting
Standards Board (IASB), and to establish a new, differentiated European accounting regulatory mechanism, were driven by its desire
to bolster European influence.
De Grauwe et al. (2017) found evidence that a significant part of
the surge in the sovereign bond spreads of the peripheral Eurozone
countries was determined from a broad disconnection from underlying fundamentals and particularly from a country’s debt position.
This was found to be more likely to be associated with market
sentiments and liquidity concerns. But long-term political changes
have also manifested in the incredible economic events that had
taken place in countries such as Cyprus and Italy (Michaelides,
2014; Deeg, 2005). Benediktsdottir et al. (2011) found that Icelandic authorities as a matter of policy encouraged the creation
4
E. Akyildirim, S. Corbet, D.K. Nguyen et al. / International Review of Law and Economics 63 (2020) 105907
of an international banking centre, involving the privatization and
deregulation of the banking system, rules and regulations being
relaxed and the neglect of financial supervision. This inevitably
reduced sovereign financial diversification.
Mugge (2011) found that three key results were evident after the
EU had taken a role in global financial governance. First, the EU has
stabilized, rather than challenged. Second, the EU continues to be
one of two central nodes in GFG, which essentially still is a transatlantic affair, confounding expectations that Europe would find itself
in a much more dispersed web of links with other regulatory powers around the world. Third, given its special institutional character,
there are signs that a prominent EU may transform governance, but
it still remains unclear how pronounced these dynamics will be.
Corbet and Larkin (2017) found that European countries with
more local banking networks in the form of credit unions, public banks or savings banks, generate greater levels of volatility
when compared to that of their commercial counterparts, particularly in countries with more monopolistic sectors. Further, the
announcements of the European Banking Authority generate significant volatility effects for the European banking sector at large, with
particular emphasis on stress testing results, but also announcements based on recapitalization, regulation and transparency. The
results indicate that uniformity of regulation may in fact be hindering and restricting the growth of some domestic and more
peripheral and locally designed banking sectors in the form of rules
designed for commercial banking operations.
Regarding our methodology, several studies have used the DCCMIDAS technique to investigate the interactions between EMU
markets. The DCC-MIDAS mainly differs from standard GARCHfamily models as it allows a baseline variance to vary slowly
throughout the time period analysed. Virk and Javed (2017) focused
specifically on European stock markets between 1990 and 2013
using DCC-MIDAS to identify evidence of substantial divergence
from Greek risk during the European financial crisis period. In particular, cross-country joint relationships of conditional variance
and return correlations are found to be typically positive. Boffelli
et al. (2016) focused on both the high and low frequency correlations in European government bonds via DCC-MIDAS while
considering their economic drivers. They find strong links between
spreads’ volatility and worsening macroeconomic fundamentals.
Accordingly, relative spreads move together in presence of similar macroeconomic fundamentals; yet the increasing correlation
in spreads during the burst of the sovereign debt crisis cannot be
entirely ascribed to macroeconomic factors but rather to changes
in market liquidity. Nitoi and Pochea (2019) analysed the comovements and contagion in 24 European Union stock markets
from 2004 to 2016 using the DCC-MIDAS methodology and employ
a gravity-type regression to investigate the determinants of longterm correlations. They obtained mixed findings for long-term
correlations’ drivers in contagion times, revealing a pure contagion
that is not explained by fundamentals and a wake-up call in terms
of cross-border bank flows.
r t ∼i.i.d. N( , Ht )
(1)
Ht = Dt Rt Dt
where
is the vector of unconditional means, Ht is the conditional covariance matrix and Dt is a diagonal matrix with standard
deviations on the diagonal, and
Rt = Et−1 [
t
=
Dt−1 (rt
t]
t
−
(2)
)
The model above is estimated in two consecutive steps: (i) the
conditional volatilities in Dt are estimated, and (ii) the conditional
correlation matrix Rt is obtained.
3.1. GARCH-MIDAS estimation
We start with the work of Engle et al. (2013) who propose to separate volatility dynamics into short- and long-term components.
This structure uses a mean-reverting unit daily GARCH process similar to Engle and Rangel (2008), and a MIDAS polynomial which
applies to lower frequency variables.
We denote the short- and long-run variance components for
bond i by gi and mi respectively. We keep long-run component mi
constant across the days of the low frequency period. Nvi denotes
the number of days that we hold mi fixed. The two letters t and
denote time-scales. In particular, gi,t moves daily whereas mi, only
once every Nvi days.
We assume that for each bond i, univariate daily yield changes
follow the GARCH-MIDAS process with two variance components:
ri,t =
i
+
mi, × gi,t
i,t
where t = ( − 1)Nvi + 1, . . ., Nvi
(3)
The short-run variance component of returns follows a simple
mean-reverting unit GARCH(1,1) process:
gi,t = (1 − ˛i − ˇi ) + ˛i
(ri,t−1 −
mi,
i)
2
+ ˇi gi,t−1
(4)
with ˛i > 0, ˇi ≥ 0 and ˛i + ˇi < 1 for stationarity. The short-run
component gi,t accounts for daily fluctuations that are assumed
short-lived, i.e., it relates to day-to-day concerns.
The low frequency component mi, is a weighted sum of Kvi lags
of realized variances (RV) over a long horizon:
Kvi
ϕl (ωvi )RV i,
mi, = mi + Âi
−l
(5)
l=1
where mi and Âi are free parameters to be estimated with mi > 0
and 0 ≤ Âi < 1 to guarantee a covariance stationary process. The
mi, is a trend component and relates to the effects of future
expected global/macro-economic variables on volatility.
While setting Nvi equal to the number of trading days within
a month, the realized variances involve Nvi daily non-overlapping
squared returns as follows:
Nvi
3. Methodology
As stated in the introduction section, the major goal of this paper
is to examine the impact of regulatory changes on the structural
interdependencies of EMU sovereign bond markets as well as to
discuss its implications for the future of regulations. We empirically
proxy the structural interdependencies of these markets by their
long-run dynamic yield correlations which will be obtained by the
DCC-MIDAS methodology (Colacito et al., 2011).
Consider a set of n sovereign bonds and let the vector of daily
changes in their yields be denoted by rt = [r1,t , . . ., rn,t ] obeying
the following process:
(ri,t )2
RV i, =
(6)
t=( −1)Nvi +1
As a weighting function, we use a beta function with decay
parameter ωvi :
ϕl (ωvi ) =
(1 −
i
l ωv −1
)
Kvi
i
ωv −1
Kvi
(1 − ji )
j=1
Kv
(7)
where the weight attached to past realized variances will depend
on two parameters ωvi and Kvi . For all ωv > 1, the weighting scheme
E. Akyildirim, S. Corbet, D.K. Nguyen et al. / International Review of Law and Economics 63 (2020) 105907
guarantees a decaying pattern, where the rate of decay is determined by the size of ωv . Large (small) values of ωv generate a rapidly
(slowly) decaying pattern. By construction, ϕl (ωv ) are non-negative
and sum to one.
3.2. DCC-MIDAS
In this step, we calculate the correlations based on the volatility
adjusted (standardized) residuals i,t obtained in Section 3.1:
qij,t = ¯ ij, (1 − a − b) + a
i,t−1 j,t−1
+ bqij,t−1
ij
Kc
¯ ij, =
ϕl (ωc )cij,
l=1
−l
(8)
ij
Nc
ij
k=( −1)Nc +1
cij, =
i,k j,k
ij
ij
Nc
2
ij
k=( −1)Nc +1 i,k
Nc
2
ij
k=( −1)Nc +1 j,k
where a and b are the driving parameters of the correlation process with a, b > 0 and a + b < 1 for stationarity; and the weighting
scheme ϕl (ωc ) for correlations is similar to that one used in Eq.
(7). As in the GARCH-MIDAS equation, the long-run (slowly moving) correlation ¯ ij, does not vary at daily frequency t but at a
ij
lower frequency , and it is a weighted sum of Kc lags of realized
ij
correlations (i.e., Kc are span lengths of historical correlations),
ij
ij
calculated on Nc daily non-overlapping returns (i.e., Nc are the
lag lengths). Whereas, the daily conditional correlations between
sovereign bonds i and j can easily be calculated by using time varying covariances qij,t as shown by Engle (2002), i.e.,
ij,t
qij,t
=
qii,t
(9)
qjj,t
This two-component structure allows us to observe the short ( )
and long ( ¯ ) run dynamics of the correlations. The parameters of
the DCC-MIDAS are estimated by maximizing the following quasilikelihood function
T
QL
(n log(2 ) + 2 log |Dt | + r t Dt−2 rt )
=−
t=1
T
−
(10)
(log |Rt | +
−1
t Rt
t
+
t)
t=1
The first sum in Eq. (10) contains the data and the variance
parameters (coming from GARCH-MIDAS estimation) while the
second sum is based on volatility adjusted residuals and the correlation parameters.
4. Data and results
4.1. Sample data
We use daily 10-year benchmark sovereign bond yields for
a sample of eleven countries in our analysis.4 Sample countries are the major and also the earliest eurozone members;
Austria, Belgium, Finland, France, Germany, Greece, Italy, Ireland,
Netherlands, Portugal, and Spain. The data is obtained from Thomson Reuters Datastream and it covers a time period from January
4, 1999 (the introduction of euro) until May 28, 2019, which
4
All the analysis in this work is performed by MATLAB.
5
specifically includes the various phases of financial linkages in the
European sovereign bond markets over the last 20 years.
Fig. 2 shows the changes in sovereign bond yields of the selected
countries over the sample period. We observe a clear convergence
of yields with the introduction of euro where this convergence
keeps its pattern until the beginning of the European sovereign debt
crisis in 2009. In particular, with a sharp increase in its sovereign
bond yield, Greece demonstrates phases of divergence from the
rest. In the following period, a similar divergence is also observed
between the yields of the countries that struggle with debt (Ireland,
Italy, Portugal and Spain) and those that are viewed as safe haven
(France and Germany), suggesting a period of flight-to-quality by
investors in these markets.
Table 1 presents the descriptive statistics of the daily changes
(taken as the difference in yields in consecutive days), as well as the
stationarity test results. We can see that all yields have a negative
daily average change showing that cost of borrowing has decreased
for all the sample countries in our study period. Greece has the
lowest daily average (−0.0007) as expected due to the sustained
periods of high yields, especially during the 2011–2012 sovereign
bond crisis phase. For the same reason, it also has the highest yield
increase (3.947) in a single day.
The unconditional volatility of the Greek sovereign bond yields
(0.54), measured by standard deviations, is almost four times of
Portugal (0.15), the country having the next highest bond yield
volatility. Yield change distributions are skewed to the right except
for the Greece, Italy, Ireland and Spain. Also, all yield changes
exhibit excess kurtosis (fat tails), with Greece having an outstanding value of 660. Clearly, skewness and kurtosis coefficients indicate
that return series are far from normally distributed. This departure
from normality is confirmed by the Jarque–Bera test statistics that
rejects normality at the 1% level for all series.5
Table 1 also presents the unit root test result for the stationarity of our daily change series (unit root tests contain a constant).
Augmented Dickey–Fuller (ADF) test rejects the null hypothesis of
unit root for all the series under consideration at the 1% significance
level, indicating that all the daily yield change series are stationary.
4.2. Dynamics of short- and long-run correlations
The top panel of Table 2 displays the estimation results for the
conditional yield change variances where the values in the parentheses below are the standard errors of the estimated coefficient.
Accordingly, most of the parameters are significant at the 1% level.
The sums of ˛ and ˇ vary within the range limited by 0.77 and
0.999 from below and above respectively, therefore satisfying the
stationarity boundary ˛ + ˇ < 1.
The decay parameter ωv is substantially larger than 1 for majority of the bonds, indicating that weight of the lags decreases rapidly
when calculating realized variances. On the other hand, this parameter is almost 1 for Austria, France and Germany, implying a flat
weighting function for these countries. Estimation results for the
MIDAS correlations are provided in the lower panel. The decay
parameter ωc implies a moderate level of decreasing weighting
function. The a and b parameters are both highly significant, and
their sum of 0.995 which is very close to 1, suggesting a long-run
correlation with a highly persistent structure.
In our work, there are 11 countries under consideration, which
makes the bilateral analysis impractical since we would have to
analyse 55 different correlation structures. Instead, we proceed as
follows. For each day, we take the equally weighted average of the
daily yield changes of the sample sovereign bonds. This time series
5
In the tables throughout this paper, *, ** and *** denote significance at the 10%,
5% and 1% levels respectively.
6
E. Akyildirim, S. Corbet, D.K. Nguyen et al. / International Review of Law and Economics 63 (2020) 105907
Fig. 2. European Sovereign Bond Yields from 1999 to 201.
Table 1
Summary statistics and results of unit root tests for the first differences in EMU sovereign bond yields.
Austria
Belgium
Finland
France
Germany
Greece
Italy
Ireland
Netherlands
Portugal
Spain
Bechmark
Mean
Max
Min
Std. Dev.
Kurtosis
Skewness
Jarque–Bera
ADF
−0.0017
−0.0016
−0.0017
−0.0016
−0.0017
−0.0007
−0.0009
−0.0016
−0.0017
−0.0015
−0.0014
−0.0015
0.3010
0.3710
0.3240
0.2470
0.2120
3.9470
0.5790
0.9230
0.1840
2.0760
0.6000
0.3960
−0.2660
−0.4290
−0.3700
−0.2160
−0.2940
−19.9140
−0.8110
−1.1730
−0.2650
−1.6800
−0.9050
−1.8195
0.0454
0.0484
0.0487
0.0436
0.0444
0.5408
0.0713
0.0957
0.0420
0.1468
0.0737
0.0662
7.7688
10.4977
8.3430
5.6112
5.2394
660.7464
15.2995
32.0463
5.0150
55.8528
19.6703
210.4513
0.5289
0.2231
0.0045
0.1473
0.0806
−17.6632
−0.1183
−0.0354
0.1613
1.3621
−0.6428
−7.4571
2829.4***
6689.9***
3385.3***
818.9***
597.8***
5 × 10⁸∗∗∗
17,945.6***
1 × 10⁶∗∗∗
493.8***
3 × 10⁶∗∗∗
33,150***
5,129,733.2***
−52.1***
−45.7***
−58.2***
−51.4***
−51.7***
−51.8***
−47.8***
−46.4***
−51.7***
−48.5***
−47.0***
−49.5***
Notes: Asymptotic critical values for the ADF test are −3.43, −2.86 and −2.57 for 1%, 5% and 10% significance levels respectively. We use the standard acronyms in the column
tables for the country name abbreviations. In the last column, Benchmark refers to the cross-sectional equally-weighted daily yield changes of all sample sovereign bonds.
is called the benchmark. For each sample country, we analyse the
relationship between the country itself and the aggregate market
(benchmark series). This step reduces our analysis to only 11 correlation structures and it also helps us focus on the interaction with
the overall market.
The long- and short-run correlation components between individual sovereign bond yields and the aggregate market yield are
presented in Fig. 3. The different behaviours of the two components
actually show how useful DCC-MIDAS models can be in understanding the structural changes in the dependencies between the
sample sovereign bond yields. For example, DCC takes minimum
and maximum values of −0.16 and 0.87 respectively for Germany,
giving us a range greater than 1. On the other hand, DCC-MIDAS is
confined to the interval (0.36, 0.76) for the same country. Table 3
presents the descriptive statistics of the DCC and the DCC-MIDAS
for all sample countries. The stability of the latter is observed easily when we compare the standard deviations. In many cases, the
unconditional volatility of the DCC is around twice of the DCCMIDAS, and in some extreme cases such as Ireland, this ratio can
reach up to almost 4. The volatile movement of the short-term
correlation component is also reflected in the mean correlation values. Without an exception, DCC mean stays below the DCC-MIDAS
E. Akyildirim, S. Corbet, D.K. Nguyen et al. / International Review of Law and Economics 63 (2020) 105907
7
Table 2
GARCH-MIDAS and DCC-MIDAS parameter estimates.
GARCH-MIDAS
Austria
Belgium
Finland
France
Germany
Greece
Italy
Ireland
Netherlands
Portugal
Spain
Benchmark
˛
ˇ
Â
ωv
m
−0.00042
(0.00053)
−0.00104
(0.00061)
−0.00098
(0.00059)
−0.00090
(0.00057)
−0.00089
(0.00056)
−0.00109
(0.00085)
−0.00080
(0.00069)
0.00100
(0.00037)
−0.00103
(0.00057)
−0.00112
(0.00073)
−0.00105
(0.00064)
0.05459
(0.00407)
0.09923
(0.01062)
0.03926
(0.00448)
0.03093
(0.00286)
0.02760
(0.00246)
0.30082
(0.00639)
0.09311
(0.00616)
0.05000
(0.00097)
0.04033
(0.00825)
0.12967
(0.00825)
0.09353
(0.00732)
0.93997
(0.00425)
0.67660
(0.0384)
0.92611
(0.01276)
0.96232
(0.00377)
0.96889
(0.00296)
0.68167
(0.00743)
0.83452
(0.01403)
0.90000
(0.00265)
0.84779
(0.04685)
0.78231
(0.01213)
0.83146
(0.01522)
0.25437
(0.03238)
0.18999
(0.00572)
0.19108
(0.00907)
0.15435
(0.03879)
0.00080
(12.652)
0.50988
(0.04422)
0.20769
(0.00609)
0.10000
(0.00167)
0.20352
(0.00612)
0.22783
(0.00388)
0.20322
(0.0066)
1.00100
(0.02891)
27.08200
(2.8765)
9.49880
(2.69)
1.06400
(0.33794)
1.00100
(3125.9)
27.27800
(1.4753)
13.72400
(1.7153)
5.00000
(0.39328)
22.58900
(4.2865)
16.69100
(1.4614)
12.69700
(1.8036)
0.00000
(171.44)
0.02242
(0.00141)
0.02127
(0.0025)
0.02865
(0.00781)
0.04180
(0.00976)
0.06422
(0.00737)
0.02215
(0.00257)
0.01000
(0.0003)
0.01632
(0.00192)
0.02022
(0.00236)
0.02248
(0.00237)
−0.00120
(0.00049)
0.15900
(0.00789)
0.72046
(0.01945)
0.24749
(0.0034)
24.39200
(2.3384)
0.00756
(0.00251)
DCC-MIDAS
a
b
ωc
Parameter values
0.01519
(0.00018)
0.97979
(0.00026)
1.54720
(0.02881)
Notes: The top panel reports the estimates of the GARCH-MIDAS coefficients for the sovereign bonds. The bottom panel reports the estimates of the DCC-MIDAS parameters.
Standard error of the coefficient estimates are given in the parenthesis. The number of MIDAS lags is 20 for the GARCH process and 120 for the DCC process.
Fig. 3. Long-run vs short-run dynamic correlations. Note: The figure shows the dynamic correlations between individual sovereign bond yields and the aggregate EMU
sovereign bond market yield.
mean, indicating of a potential underestimation of the contemporaneous relationship between the sample sovereign bond markets.
Furthermore, according to the ADF test results applied to the DCC,
there is no trend in short-term correlations for any of the countries,
whereas the same test reveals the existence of a negative significant trend in 7 countries. To the extent that in this paper, our focus
is the impact of regulatory changes on the structural interdepen-
dencies (not the momentarily effects), it is clear that DCC-MIDAS is
the right tool for us to consider from now on.
For each country, Fig. 4 displays the long-run dynamic correlations between individual sovereign bond yields and the aggregate
sovereign bond market yield. The shaded areas refer to the calendar
months of the regulatory changes. This figure suggests that there
might be a significant relation between the regulatory actions and
8
E. Akyildirim, S. Corbet, D.K. Nguyen et al. / International Review of Law and Economics 63 (2020) 105907
Table 3
Summary statistics and results of unit root tests for long-run (DCC-MIDAS) and short-run (DCC) correlations.
Mean
Max
Min
Std. Dev.
Kurtosis
Skewness
Jarque–Bera
ADF
DCC-MIDAS
DCC
DCC-MIDAS
DCC
DCC-MIDAS
DCC
DCC-MIDAS
DCC
DCC-MIDAS
DCC
DCC-MIDAS
DCC
DCC-MIDAS
DCC
DCC-MIDAS
DCC
Austria
Belgium
Finland
France
Germany
Greece
Italy
Ireland
Neth.
Portugal
Spain
0.6092
0.5504
0.8099
0.8940
0.4738
0.0444
0.1157
0.1986
1.8077
2.2968
0.6661
−0.4605
379.0
159.2
−4.5***
−0.8
0.6497
0.6392
0.7416
0.8903
0.5726
0.1522
0.0552
0.1754
1.5565
2.8694
0.3680
−0.7767
311.3
288.2
−1.3
−0.4
0.5770
0.5189
0.8262
0.8407
0.4193
−0.0498
0.1377
0.2151
1.9011
2.2100
0.6852
−0.6628
365.9
282.4
−4.6***
−0.7
0.6130
0.5910
0.7652
0.8977
0.5096
0.0631
0.0885
0.2091
1.7593
2.2570
0.5469
−0.5686
324.4
218.8
−2.2
−0.5
0.5163
0.4657
0.7519
0.8744
0.3626
−0.1622
0.1373
0.2534
1.7981
2.1657
0.6698
−0.3246
384.1
132.5
−3.8***
−0.9
0.6834
0.6438
0.7379
0.9585
0.5379
0.1851
0.0494
0.1543
3.5112
2.8780
−1.3404
−0.4877
883.3
114.6
−3.7***
−0.9
0.6870
0.6812
0.7353
0.8594
0.6146
0.1268
0.0367
0.1403
1.9023
5.3385
−0.4542
−1.5320
240.8
1761.9
−1.2
−0.6
0.6529
0.65079
0.71563
0.86351
0.58660
0.16640
0.03957
0.14950
1.71638
4.31826
−0.0098
−1.3623
195.4
1086.4
−0.8
−0.4
0.6049
0.5334
0.8504
0.9098
0.4499
−0.0524
0.1462
0.2403
1.7735
2.2322
0.6805
−0.3954
398.1
144.1
−4.8***
−0.8
0.6860
0.6686
0.7523
0.8870
0.6427
0.2290
0.0363
0.1249
1.811
4.8323
0.6690
−1.1331
379.7
1007.2
−2.7*
−0.5
0.7356
0.7040
0.8347
0.9047
0.6841
0.1674
0.0584
0.1333
1.6801
6.4371
0.7098
−1.6825
445.6
2743.8
−4.2***
−0.3
Notes: Asymptotic critical values for the ADF test are −3.43, −2.86 and −2.57 for 1%, 5% and 10% significance levels respectively.
Fig. 4. Long-run dynamic correlations with applied regulatory changes. Note: The dynamic correlations above are between individual sovereign bond yields and the aggregate
EMU sovereign bond market yield. The shaded areas denote the months of the regulatory changes.
the long-run dependencies. To officially test this, we start with the
following simple model:
¯t = c0 + c1 Dt1m +
(11)
t
Dt1m
is a dummy variIn Eq. (11), ¯t is the DCC-MIDAS and the
able that takes one in the calendar month that the regulatory action
is taken, and otherwise zero. We call this type 1 model and it basically shows us whether there is a significant relationship between
the regulatory actions and the long-run correlations among bond
yields within the month of actions. Table 4 displays the estimation
results. All countries except Ireland generate significant results. We
further check whether this significant impact is transitory or not,
so we estimate the same model type but change the dummy variable Dt1m to Dt2m where the new dummy variable takes one in not
only the calendar month of the regulatory action but also in the
following calendar month. Table 4 shows that all dummy variables
are significant, with however the opposite sign compared to the
estimation results when we use Dt1m . This presents an interesting
case and might be an indicator of the investors’ overreaction to the
regulatory changes within a short time frame.
One might argue that the significant impact of the regulatory
changes might arise due to the trend in the long-run correlations.
Indeed, it might actually be the case since some of the long-run
correlations have been found to be non-stationary as displayed in
Table 3. To control for the trend effect, we estimate the model in
the following equation:
¯t = c0 + c1 Dt1m + c2 t 1m +
t
(12)
We call the model in Eq. (12) type 2 and it basically shows us
whether there is a significant relationship between the regulatory
actions and the long-run correlations among bond yields within
the month of actions when we control for the trend in the correlations. According to Table 4, trend term coefficients are found to
E. Akyildirim, S. Corbet, D.K. Nguyen et al. / International Review of Law and Economics 63 (2020) 105907
9
Table 4
Impact of regulatory changes in the long-run dynamic correlations.
Country
Model
Dt1m
Dt2m
t 1m × 104
t 2m × 104
Austria
1
2
1
2
1
2
1
2
1
2
1
2
1
2
1
2
1
2
1
2
1
2
0.045***
−0.025***
0.019***
−0.010***
0.045***
−0.036***
0.020***
−0.026***
0.049***
−0.032***
0.040***
0.014***
−0.014***
−0.020***
−0.002
−0.017***
0.061***
−0.030***
0.015***
−0.007***
0.028***
−0.009***
−0.089***
0.017***
−0.037***
0.006**
−0.103***
0.018***
−0.054***
0.015***
−0.105***
0.017***
−0.049***
−0.008***
0.010***
0.019***
−0.011***
0.009***
−0.119***
0.016***
−0.026***
0.008***
−0.049***
0.007***
–
−1.229***
–
−0.500***
–
−1.405***
–
−0.806***
–
−1.417***
–
−0.444***
–
−0.113***
–
−0.248***
–
−1.567***
–
−0.385***
–
−0.642***
–
−1.205***
–
−0.490***
–
−1.367***
–
−0.779***
–
−1.383***
–
−0.458***
–
−0.099***
–
−0.231***
–
−1.536***
–
−0.381***
–
−0.634***
Belgium
Finland
France
Germany
Greece
Italy
Ireland
Netherlands
Portugal
Spain
Notes: In this table, Model 1 and Model 2 represent the regressions without and with the trend variable, respectively. Dt1m refers to the coefficient of the dummy variable that
takes the value one in the calendar month that the regulatory action is taken, and otherwise zero. Similarly, Dt2m refers to the coefficient of the dummy variable that takes
the value one in the calendar month that the regulatory action is taken and also the following calendar month, otherwise zero. t 1m (t 2m ) refers to the trend coefficient when
we estimate the Model 2.
Table 5
This table shows the dates of the long-run correlation shifts for each sovereign bond detected by Lavielle’s penalized contrasts methodology with allowance for different
number of maximum break points.
Austria
Greece
Italy
Ireland
Netherlands
Portugal
Spain
(a) Panel A: Maximum number of allowed break points is three
14/02/2012
15/02/2011
05/07/2011
05/07/2011
08/06/2010
18/12/2012
25/09/2012
25/09/2012
20/11/2012
30/08/2011
20/11/2012
25/07/2017
17/10/2017
02/05/2017
17/10/2017
Belgium
Finland
France
Germany
06/05/2014
13/12/2016
17/10/2017
22/11/2011
17/11/2015
13/03/2012
15/11/2016
28/09/2010
20/12/2011
18/12/2012
23/11/2010
10/04/2012
14/11/2017
28/09/2010
20/12/2011
25/09/2012
(b) Panel B: Maximum number of allowed break points is six
08/06/2010
30/08/2011
08/06/2010
03/08/2010
08/05/2012
05/07/2011
05/07/2011
05/07/2011
08/05/2012
15/01/2013
08/05/2012
10/04/2012
15/01/2013
05/05/2015
12/02/2013
18/12/2012
10/02/2015
13/12/2016
19/09/2017
10/01/2017
10/01/2017
12/12/2017
06/03/2018
08/06/2010
15/02/2011
30/08/2011
05/06/2012
12/02/2013
17/10/2017
05/06/2012
11/03/2014
31/05/2016
07/02/2017
17/10/2017
16/10/2018
31/08/2010
22/11/2011
08/05/2012
29/07/2014
17/11/2015
18/10/2016
11/05/2010
20/12/2011
03/07/2012
29/07/2014
07/02/2017
03/08/2010
02/08/2011
08/05/2012
15/01/2013
10/02/2015
19/09/2017
28/09/2010
20/12/2011
10/04/2012
28/08/2012
30/06/2015
14/11/2017
31/08/2010
05/07/2011
20/12/2011
10/04/2012
28/08/2012
12/02/2013
(c) Panel C: Maximum number of allowed break points is nine
17/02/2009
08/06/2010
08/06/2010
08/06/2010
05/07/2011
15/02/2011
15/02/2011
21/12/2010
20/12/2011
02/08/2011
02/08/2011
02/08/2011
08/05/2012
13/03/2012
14/02/2012
10/04/2012
15/01/2013
25/09/2012
03/07/2012
20/11/2012
05/05/2015
12/02/2013
15/01/2013
09/04/2013
13/12/2016
10/03/2015
15/11/2016
10/02/2015
12/12/2017
13/12/2016
22/08/2017
18/10/2016
06/02/2018
29/05/2018
17/10/2017
08/06/2010
15/02/2011
02/08/2011
14/02/2012
03/07/2012
12/02/2013
10/03/2015
13/12/2016
12/12/2017
05/06/2012
22/10/2013
08/04/2014
12/01/2016
20/09/2016
07/02/2017
19/09/2017
01/05/2018
05/02/2019
03/08/2010
07/06/2011
20/12/2011
10/04/2012
25/09/2012
06/05/2014
18/11/2014
15/12/2015
18/10/2016
13/04/2010
27/09/2011
17/01/2012
05/06/2012
18/12/2012
01/07/2014
23/08/2016
07/03/2017
06/02/2018
08/06/2010
18/01/2011
02/08/2011
14/02/2012
31/07/2012
12/02/2013
10/02/2015
07/02/2017
06/02/2018
28/10/2008
31/08/2010
12/04/2011
20/12/2011
10/04/2012
28/08/2012
30/06/2015
14/11/2017
28/10/2008
03/08/2010
15/02/2011
30/08/2011
20/12/2011
10/04/2012
28/08/2012
12/02/2013
14/11/2017
Note: This table demonstrates the shift dates in long-run correlations when we allow for maximum number of breaks equal to 3, 6 and 9. In the analysis, we cover all possible
break structures when maximum number of breaks runs through 2 to 10.
be significantly negative, yet the dummy coefficients are also still
significant.
As in the previous case, we try to see if the significant impact
is transitory or not, therefore replace the Dt1m with Dt2m in the
type 2 model. Accordingly, the new dummy coefficients preserve
their significance as displayed in Table 4 and the interesting case
of switching signs is still there. All in all, our analysis shows that
regulatory changes have significant and negative impact on the
long-run relationship of sovereign bond yields of the sample countries and this significance is robust with respect to the trend in
the correlations. Hence, the more the regulations the EU attempts
to put in place over the long run, the lower the convergence process.
4.3. Detecting structural shifts in the long-run correlations
We now run a robustness check of the results in the previous
section by detecting the structural shifts in the long-run correlations and investigating whether these shifts are associated with
the regulatory changes the European Union has undertaken over
our study period. To do so, we apply the state of the art penalized
contrasts methodology by Lavielle (2005) to the correlation series
to detect the change points. The details of the methodology are provided in Appendix C. We provide the maximum potential number
of change points as an input and receive the dates of changes as the
output. Table 5 demonstrates the change (or break) point dates for
each country’s sovereign bond yield correlations when we allow
10
E. Akyildirim, S. Corbet, D.K. Nguyen et al. / International Review of Law and Economics 63 (2020) 105907
Table 6
Important events that potentially created shifts in the long-run correlations
Shift date
Event
Source
08/06/2010
/> />
20/12/2011
Broad fears about European financial
contagion and the announcement of a tax
on UK banks and a deposit guarantee
schemes for bank failures
New Greek bailout tranche and a sharp
escalation of the Greek crisis
Regulation shifts/announcement
14/02/2012
First major broad EU credit ratings cut
10/04/2012
08/05/2012
Cypriot financial problems escalate sharply
European austerity measures are reported
to be broadly damaging numerous
European real economies
Start of the Brexit process and major
regulatory developments (Insurance,
BRRD, PRIPS, IMD, UCITS)
05/07/2011 02/08/2011 30/08/2011
03/07/2012
25/09/2012
20/11/2012
Basel III regulations and rules on high
frequency trading
New EU data protection regulation
18/12/2012
15/01/2013
10/03/2015
EU ODR regulation
EU credit rating agencies regulation
Beginning of EU quantitative easing
07/02/2017
EU securitization problem due to Brexit
/> />Eurozone-zombies-follow-Mario-Draghis-cheap-money.html
/> /> />Europe-austerity-crisis-Q-and-A.html
/> /> MEMO-12-516 en.htm?locale=en
/> /> MEMO-12-994 en.htm
MEMO-13-13 en.htm
/> />
Note: The first column represents the long-run correlation shift dates that are common for at least five sample countries. The second column provides the events that might
be associated with these shifts and the sources of these events are provided in the third column.
for the number of maximum break points as 3 (Panel A), 6 (Panel
B) and 9 (Panel C).
In our extended analysis, we allow for the maximum number of
break points to run from 2 to 10, and then select the dates that are
common for at least 5 sample countries. Table 6 provides the break
dates with the potential reasons causing the shifts. It is clear that
the break dates mostly fall into the years 2011 and 2012, when
the European sovereign debt crisis reached its peak with various
regulations being put into place to control the situation. When we
take a detailed look at the potential sources, we see a variety of
regulatory actions taken by the European Commission and the Basel
Committee. In addition to those, major economical events such as
the fear of contagion in Europe, Greek bailout programme, credit
rating cuts in the EU and the quantitative easing in the eurozone
stand out as potential sources. Finally, we see that political events,
in particular various stages of the Brexit process, also seem to have
a significant impact on shaping the long-run correlations between
the core eurozone countries’ sovereign bond markets.
To sum up, long-run correlations between the EMU sovereign
bond markets are characterized by occasional structural shifts
which mostly took place during the times of regulatory changes
in order to deal with the sovereign debt crisis or important economic and political events (e.g., credit rating downgrades in Europe
and the Brexit). This finding strengthens the argument that both
political and economic uncertainties as well as the key regulatory actions are drivers of the long-run relationship between the
sovereign bonds of major eurozone member countries.
5. Discussion and conclusion
This research identifies and examines the impact of European
regulatory changes on the structural interdependencies of EMU
sovereign bond markets as well as to discuss its implications for
the future of regulations. To complete this task, we utilize the DCCMIDAS methodology which allows for baseline correlation levels
to vary slowly throughout the period under investigation. One of
the key issues identified during the process of European integration
was based on the fact that broad regulation, with particular emphasis on its uniformity, might actually be hindering broad growth of
some domestic and more peripheral and locally-designed markets.
Our selected countries include not only core European states such
as France, Germany, Austria, Belgium and the Netherlands, but also
the more problematic and peripheral states referred to as the PIIGS;
i.e., Portugal, Italy, Ireland, Greece and Spain.
The empirical results obtained from using the DCC-MIDAS
framework show that regulatory changes have significant impacts
on the long-run relationship among sovereign bond yields of the
sample countries and this significance is robust with respect to the
trend in the correlations. The methodological selection is validated
when documenting the differing behaviour of both the long- and
short-term correlation components between individual sovereign
bond yields. As to the exceptional nature of the influence of the
financial crises and sovereign debt crises that affected Ireland,
Greece, Spain, Portugal and Italy, we find substantial evidence of
significant effects of regulatory announcements during the period
analysed.
Our analysis also examines the structural shifts in the
long-run correlations with respect to regulatory change announcements (both the regulatory announcements that have been both
announced and fully implemented and those that are currently
being implemented and have not yet reached conclusion). It was
broadly assumed that market responses to regulatory change
announcements would be substantial at the point that such information of large structural changes being announced. This turns
out to be the case, with sharp responses in the DCC-MIDAS framework observed during key events such as the provision of financial
support for Greece. The detailed analysis of the results shows
that European bond markets were sharply influenced through the
implementation of key regulations undertaken by the European
Commission and the Basel Committee, such as BRRD, PRIPS, IMD,
UCITS, Basel III, data protection regulation, EU ODR regulation, and
the regulation of EU credit ratings agencies. These substantial shifts
E. Akyildirim, S. Corbet, D.K. Nguyen et al. / International Review of Law and Economics 63 (2020) 105907
in long-run correlations mainly occur during key periods of financial market stress in 2012 (e.g., the first phase of European sovereign
credit ratings cut and the escalation of the Cypriot financial crisis)
and during the decision to provide European quantitative easing.
The announcement of Brexit and key dates related to its subsequent
escalation also trigger shifts in correlations. Another key result is
the sharp divergence in bond performance for Greek bond markets
when compared to other European markets during the most severe
episodes in 2011.
We contribute to the literature by showing that the regulatory changes in Europe have significant and negative impact on
the long-run correlations of the sovereign bond markets of the
major eurozone countries. Moreover, the more the regulations
the EU attempts to put in place over the long run, the lower
the convergence process. Overall, our findings suggest that, when
considering to implement new regulations, the EU policymakers
should carefully pay attention to the potential uniquenesses of different member countries in order to preserve financial stability and
to advance the convergence to the eurozone single market. The reason is that the international regulatory principles are more likely
11
applicable for entities or activities of international relevance. For
example, the cost of complying with the EU prudential regulation,
which is contained in the Capital Requirements Directive (CRD)
and Capital Requirements Regulation (CRR), disproportionally differs between small-sized and large-sized firms.6 Future research
can focus on figuring out whether the regulations analysed in this
study (or a specific subset of them) have a homogeneous effect on
the EMU sovereign bond markets and if so, why.
Authors’ contribution
Erdinc Akyildirim: conceptualization, software, formal analysis;
Shaen Corbet: conceptualization, writing – review & editing, visualization; Duc Khuong Nguyen: conceptualization, methodology,
supervision, writing – review & editing; Ahmet Sensoy: conceptualization, methodology, supervision, and writing-original draft.
Appendix A. Financial reforms that are put in action
Appendix A: Financial reforms implemented by the European
Commission after the European financial crisis.
Date
Action name
Brief description
Jul-07
Risk-based prudential and solvency
rules for insurers (‘Solvency II’)
Credit Rating Agencies
The Solvency II regime introduces for the first time a harmonized, sound and robust prudential
framework for insurance firms in the EU.
Because there were weaknesses in the existing EU rules on credit ratings that have been
highlighted both by the financial crisis and the euro debt crisis, structural improvements were
made to regulation.
AIFMD was identified as a key part of the European Commission’s drive to lay the regulatory
foundations for a secure financial system that supports and stimulates the real economy.
This proposal would require banks to hold capital for credit related losses short of an instrument’s
default, taking into account medium-term price movements in view of an impaired market
liquidity for such instruments
The ESRB will provide an early warning of system-wide risks that may be building up and, where
necessary, issue recommendations for action to deal with these risks.
The Commission proposed new funding requirements for schemes will ensure that DGS will be
able to fulfil their obligations towards depositors, and faster access to deposits after a bank failure
will stabilize the confidence of depositors and ensure financial stability.
The main objective of the revision of the Directive is to correct this unintended consequence of the
current rules.
EMIR provides a mechanism for recognising CCPs and trade repositories based outside of the EU.
Once recognized, EU and non-EU counterparties may use a non EU-based CCP to meet their
clearing obligations and a non EU-based trade repository to report their transactions to.
The EU adopted a regulation which increases transparency by requiring the flagging of short sales,
so that regulators know which transactions are short; gives national regulators powers to
temporarily restrict or ban short selling of any financial instrument; and requires central
counter-parties providing clearing services to ensure that there are adequate arrangements in
place for buy-in of shares as well as fines for settlement failure
The regulation (EC) No. 924/2009 on charges for cross-border payments in euro was also adopted
in the context of SEPA. It requires banks to apply the same charges for domestic and cross-border
electronic payment transactions in euro.
Under the new regulation: (1) ‘qualifying infrastructure investments’ will form a distinct asset
category and will benefit from an appropriate, lower risk calibration; and (2) investments in
European Long-Term Investment Funds (ELTIFs) and equities traded on multilateral trading
facilities (MTFs) will also benefit from lower capital charges
The key objectives are to: (1) Facilitate cross-border access to official business information by
defining a common minimum set of up-to-date company information to be available to third
parties in all EU languages; (2) Develop a framework for cross-border cooperation between
business registers; and (3) Ensure that business registers provide up-to-date information on the
status of their companies to the business registers of companies’ foreign branches all across
Europe.
The mortgage credit directive is a step towards an EU-wide mortgage credit market with a high
level of consumer protection.
The regulation establishes the prudential requirements that institutions need to respect. It sets out
the rules for calculating capital requirements and reporting and general obligations for liquidity
requirements
Nov-08
Apr-09
Jul-09
Sep-09
Jul-10
Aug-10
Sep-10
Hedge Funds and Private Equity
(‘AIFMD’)
Remuneration and prudential
requirements for banks (‘CRD III’)
Establishment of the European
Supervisory Authorities
Deposit Guarantee Schemes
Strengthened supervision of
financial conglomerates
Derivatives (‘EMIR’)
Sep-10
Short-selling and Credit Default
Swaps
Dec-10
Creation of the Single Euro
Payments Area (‘SEPA’)
Jan-11
New European supervisory
framework for insurers (‘Omnibus
II’)
Feb-11
Interconnection of business
registers
Mar-11
Responsible lending (mortgage
credit)
Single Rule Book of prudential
requirements, remuneration and
improved transparency (‘CRD
IV/CRR’)
Enhanced framework for securities
markets (‘MIFID/R’)
Jul-11
Oct-11
MiFID is the markets in financial instruments directive (Directive 2004/39/EC). In force from 31
January 2007 to 2 January 2018, it is a cornerstone of the EU’s regulation of financial markets.
6
See
/>%3A52016SC0377R%2801%29 for details.
12
E. Akyildirim, S. Corbet, D.K. Nguyen et al. / International Review of Law and Economics 63 (2020) 105907
Oct-11
Enhanced framework to prevent
market abuse (‘MAD/R’)
Oct-11
Simplification of accounting
Oct-11
Enhanced transparency rules
Nov-11
Enhanced framework for audit
sector
Dec-11
Creation of European Venture
Capital Funds
Dec-11
Creation of European Social
Entrepreneurship Funds
Central Securities Depositories
Mar-12
Jun-12
Prevention, management and
resolution of bank crises (‘BRRD’)
Jul-12
Improved investor information for
complex financial products
(‘PRIPS’)
Strengthened rules on the sale of
insurance products (‘IMD’)
Safer rules for retail investment
funds (‘UCITS’)
Jul-12
Jul-12
Sep-12
Single Supervisory Mechanism
Feb-13
Strengthened regime on
anti-money laundering
Apr-13
Non-financial reporting for
companies
May-13
Access to basic bank
account/transparency of
fees/switching of bank accounts
Creation of European long-term
investment funds
Jun-13
Jul-13
Single Resolution Mechanism
Jul-13
Revised rules for innovative
payment services
Regulation of Financial
Benchmarks
Sep-13
Sep-13
Shadow banking, including Money
Market Funds
Jan-14
Shadow banking: increasing the
transparency of securities
financing transactions
Mar-14
Long-term financing of the
European economy/Revised rules
for occupational pension funds
(‘IORP’)
Nov-15
New rules on prospectuses
Sep-15
New rules on securitization
Jul-16
Amended rules on European
Venture Capital Funds
The new rules strengthened and replaced the original market abuse directive (MAD). Adopted in
2003, the MAD introduced a framework to harmonize core concepts and rules on market abuse
and strengthen cooperation between regulators.
As part of the Responsible Business package (see IP/11/1238), the Directive will reduce the
administrative burden for small companies.
The revised Directive will also provide for more harmonization concerning the rules of notification
of major holdings in particular by requiring aggregation of holdings of financial instruments with
holdings of shares for the purpose of calculation of the thresholds that trigger the notification
requirement.
These rules help to foster diversity in the audit markets and enhance investors’ trust in the
financial information of companies, which in turn improves the conditions for cross-border
investment and economic growth in the EU.
To protect investors, the EU has adopted a regulation introducing a key information document
(KID), a simple document giving investors key facts in a clear and understandable manner. A KID is
required for products including: (1) all types of investment funds; (2) insurance-based
investments; (3) retail structured products; and (4) private pensions.
The European social entrepreneurship funds (EuSEF) regulation covers alternative investment
schemes that focus on social enterprises.
The aim of the proposal is to ensure that both CCPs and national authorities in the EU have the
means to act decisively in a crisis scenario.
The EU’s bank resolution rules ensure that the banks’ shareholders and creditors pay their share of
the costs through a “bail-in” mechanism. If that is still not sufficient, the national resolution funds
set up under the BRRD can provide the resources needed to ensure that a bank can continue
operating while it is being restructured.
The EU has adopted a regulation on PRIIPs, which obliges those who produce or sell investment
products to provide investors with key information documents (KIDs).
The sale of insurance products in the EU is regulated by the insurance distribution directive (IDD)
adopted in 2016.
The amendments to the UCITS Directive (2009/65/EC) (UCITS V) focus on three areas: (1)
clarification of the UCITS depositary’s functions; (2) the introduction of rules on remuneration
policies that must be applied to key members of the UCITS managerial staff; and (3)
harmonization of the minimum administrative sanctions.
The ECB and the national supervisors work closely together to check that banks comply with the
EU banking rules and tackle problems early on.
The Commission’s proposals update and improve the EU’s existing 3rd AMLD and the Funds
Transfers Regulation respectively with the aim of further strengthening the EU’s defences against
money laundering and terrorist financing.
This Directive amends Directive 2013/34/EU. The objective is to increase EU companies’
transparency and performance on environmental and social matters and, therefore, to contribute
effectively to long-term economic growth and employment.
The directive on payment accounts gives people in the EU the right to a basic payment account
regardless of a person’s place of residence or financial situation. The directive also improves the
transparency of bank account fees and makes it easier to switch banks.
The European long-term investment funds (ELTIF) regulation covers funds that focus on investing
in various types of alternative asset classes such as infrastructure, small and medium sized
enterprises and real assets.
The mission of the SRB is: (1) ensuring the orderly resolution of failing banks with minimum
impact on the real economy and the public finances of banking union countries; and (2) managing
the single resolution fund.
The EU adopted a new directive on payment services (PSD 2) to improve the existing rules and
take new digital payment services into account.
Under the new rules: (1) ensuring that benchmark administrators are subject to prior
authorization and on-going supervision depending on the type of benchmark; (2) improving their
governance and requiring greater transparency of how a benchmark is produced; and (3) ensuring
the appropriate supervision of critical benchmarks.
One of the actions recommended by the communication was a proposal for money market funds
(MMFs), which are mutual funds that invest in short-term debt such as money market
instruments issued by banks, governments or corporations.
The European Commission adopted a regulation on the transparency of securities financing
transactions (SFTR). These rules add transparency, reporting and disclosure conditions for
institutions engaged in SFTs, making it easier to monitor and assess the risks involved in these
transactions.
The new rules aim to: (1) ensure that occupational pensions are sound and better protect pension
scheme members and beneficiaries; (2) better inform members and beneficiaries about their
entitlements; (3) remove obstacles faced by occupational pension funds operating across borders;
and (4) encourage occupational pension funds to invest long-term in economic activities that
enhance growth, environment and employment
The regulation aims to: (1) make it easier and cheaper for smaller companies to access capital; (2)
introduce simplification and flexibility for all types of issuers; and (3) improve prospectuses for
investors by introducing a retail investor-friendly summary of key information
The new EU rules on the identification of the STS criteria and the capital treatment of
securitization exposures of banks take into account the conclusions of the EBA report.
The European venture capital funds (EuVECA) regulation covers a subcategory of alternative
investment schemes that focus on start-ups and early stage companies.
Note: The above data represents all proposals of financial reforms that are finalized and implemented by the European Commission. In
many cases, all countries are allowed an adaptation period before full compliance. Data available at .
E. Akyildirim, S. Corbet, D.K. Nguyen et al. / International Review of Law and Economics 63 (2020) 105907
13
Appendix B. Financial reforms presented but not yet adopted
Appendix B: Financial reforms presented by the Euorpean Commission but not yet adopted.
Proposed
Action name
Brief description
Jan-14
Structural reform of banks
Nov-15
Proposal for a European deposit
insurance scheme (EDIS)
Nov-16
Proposals to amend rules on
capital requirements
Proposals to amend rules on bank
recovery and resolution (BRRD)
Proposal to amend rules on the
Single resolution mechanism
(SRM)
Recovery and resolution of central
counter-parties (CCPs)
Proposal to amend rules on
derivatives (EMIR)
2nd proposal to amend rules on
derivatives (EMIR)
Proposal on a pan-European
Personal Pension Product (PEPP)
The proposal on the Securities Financing Transactions Regulation, aims to improve the transparency of the
securities financing markets. The proposal was announced as part of the action plan on shadow banking in
September 2013.
The Commission’s legislative proposal on 24 November 2015 introducing a bank depositors across the
Banking Union. EDIS would develop over time and in three stages: first a re-insurance stage, then a
co-insurance stage and, finally, a full European system of deposit guarantees, which is envisaged for 2024.
Tackle remaining weaknesses and implement some outstanding elements that are essential to ensure the
institutions’ resilience, which have only recently been finalized by global standard setters.
Proposals aim to tackle remaining weaknesses and implement some outstanding elements that are
essential to ensure the institutions’ resilience
Proposals aim to tackle remaining weaknesses and implement some outstanding elements that are
essential to ensure the institutions’ resilience
Nov-16
Nov-16
Nov-16
May-17
Jun-17
Jun-17
Sep-17
Proposals to amend rules on
financial supervision
Dec-17
Proposals to review prudential
rules for investment firms
Mar-18
Proposal on European
crowdfunding service providers
Mar-18
Proposal for a EU framework on
covered bonds
Mar-18
Proposal on facilitating
cross-border distribution of
investment funds
Proposal on the law applicable to
the third-party effects of
assignments of claims
Proposals to address the risks
related to NPLs
Mar-18
Mar-18
Mar-18
Proposal on cheaper cross-border
payments in euro and fairer
currency conversions across the
entire EU
May-18
Proposal to amend the motor
insurance directive
May-18
Proposal on sovereign
bond-backed securities
May-18
Legislative package on sustainable
finance
May-18
Proposal on SME Growth Markets
Proposals aim to tackle remaining weaknesses and implement some outstanding elements that are
essential to ensure the institutions’ resilience
Proposals aim to tackle remaining weaknesses and implement some outstanding elements that are
essential to ensure the institutions’ resilience
Proposal relies on input received from stakeholders from the public consultations on the operations of the
European Supervisory Authorities (ESAs) and on the Capital Markets Union (CMU) Mid-Term Review.
The Commission’s proposal will lay down the foundations for a pan-European Personal Pension market,
ensuring standardization of the core product features, such as transparency requirements, investment
rules, switching and portability. It will ensure sufficient consumer protection on the essential features of
the product, while at the same time being flexible enough to enable different providers to tailor products
to suit their business model. This initiative is complementary to existing pension plans, whether
state-based, occupational or personal pensions and it will not replace or substitute them.
The Commission is proposing to further strengthen and integrate EU financial market supervision. This
requires a reinforced coordination role for all ESAs and new direct supervisory powers for ESMA. To make
this work, the Commission is proposing to make the ESAs’ governance and funding fit for their new tasks.
This proposal aims to ensure that investment firms are subject to key prudential requirements and
corresponding supervisory arrangements that are adapted to their risk profile and business model,
without compromising financial stability.
The Commission’s proposal introduces an optional EU regime which enables crowdfunding platforms to
easily provide their services across the EU Single Market. Instead of having to comply with different
regulatory regimes, platforms will have to comply with only one set of rules, both when operating in their
home market and in other EU Member States. For investors the proposal will further provide legal
certainty as regards the applicable investor protection rules.
Proposals aim to boost the cross-border market for investment funds, promote the EU market for covered
bonds as a source of long-term finance and ensure greater certainty for investors when dealing in
cross-border transactions of securities and claims.
The Commission is committed to put in place all building blocks of the Capital Markets Union by
mid-2019. The measures presented today, and the remaining CMU proposals that will be presented by
May 2018 make it possible that legislation can be adopted before European Parliament elections in 2019.
Proposals aim to boost the cross-border market for investment funds, promote the EU market for covered
bonds as a source of long-term finance and ensure greater certainty for investors when dealing in
cross-border transactions of securities and claims.
Ambitious package of measures is the Commission’s response to the call by the Council for further
measures to address the problem of non-performing loans in the EU as set out in its Action Plan of July
2017.
The two amendments proposed to Regulation 924/2009 on cross-border payments aim to reduce the cost
of all intra-EU payments in euro and unify the single payment market for consumers and businesses.
Today, cross-border payments in euro from non-euro area Member States can be as high as EUR 20 in
some countries while equivalent cross-border payments from euro area Member States are very cheap or
even free.
An obligation on motor vehicles to have a motor third party liability insurance policy, valid for all parts of
the EU on the basis of a single premium. Obligatory minimum amounts of cover provided by insurance
policies (Member States may require higher cover at national level). A prohibition on Member States from
carrying out systematic border checks of insurance of vehicles.
According to the criteria outlined in the Commission proposal, sovereign bond-backed securities (SBBS)
would take the form of low-risk liquid assets backed by a pre-defined pool of euro-area central
government bonds.
Fostering more sustainable private investments was a key priority of the Capital Markets Union’s (CMU)
mid-term review. The Action Plan on Financing Sustainable Growthlaunched by the Commission on 8
March 2018 laid out a roadmap to deliver on this commitment.
This proposal targets amendments to EU rules for companies listed on SME Growth Markets, a
recently-created category of trading venues. This is one of the numerous measures presented by the
Commission since the launch of the CMU in 2015 to improve SMEs’ access to market-based finance.
Note: The above data represents all proposals of financial reforms that are currently being considered by the European Commission.
Data available at .
14
E. Akyildirim, S. Corbet, D.K. Nguyen et al. / International Review of Law and Economics 63 (2020) 105907
Appendix C. Detection of mean shifts in the long-run
correlation components
change point instants , let pen( ) be a function of that increases
with the number K( ) of segments of . Then, let ˆ n be the sequence
of change point instants that minimizes
We use the change point detection method of Lavielle (2005)
to formally see if there is any structural change in the long-run
correlations. Mathematical notations in this part are independent
from the other parts of this manuscript.
We consider a sequence of random variables Y1 , . . ., Yn that take
values in Rp . Assume that  ∈
is a parameter denoting the characteristics of the Yi s that changes abruptly and remains constant
between two changes. The change occur at some instants
1 <
2 < · · · < K −1 . Here K −1 is the number of change points
hence we have K number of segments.7
Now, let K be some integer and let = ( 1 , 2 , . . ., K−1 ) be a
sequence of integers satisfying 0 < 1 < 2 < · · · < K−1 < n. For
any 1 ≤ k ≤ K, let U(Y k−1 +1 , . . ., Y k ; Â) be a contrast function useful for estimating the unknown true value of the parameter in the
ˆ
segment k; i.e., the minimum contrast estimate Â(Y
, . . ., Y k ),
k−1 +1
computed on segment k of , is defined as a solution of the following
minimization problem:
U(Y
k−1 +1
ˆ
, . . ., Y k ; Â(Y
∀Â ∈
k−1 +1
, . . ., Y k )) ≤ U(Y
k−1 +1
, . . ., Y k ; Â),
,
(C.1)
For any 1 ≤ k ≤ K, let G be
G(Y
k−1 +1
, . . ., Y k ) = U(Y
k−1 +1
ˆ
, . . ., Y k ; Â(Y
k−1 +1
, ..., Y k ))
(C.2)
Then define the contrast function J( , y) as
J( , y) =
1
n
K
G(Y
k−1 +1
, . . ., Y k )
(C.3)
k=1
where 0 = 0 and k = n. When true number K segments is known,
for any 1 ≤ k ≤ K , the sequence ˆ n of change point instants that
minimizes this kind of contrast has the property that
Pr(|ˆ n,k −
k|
> ı) → 0,
when ı → ∞ and n → ∞
(C.4)
In particular, this result holds for weak or strong dependent
processes.
We consider the following model
Yi =
i
+
i εi ,
1≤i≤n
(C.5)
where (εi ) is a sequence zero-mean random variables with unit
variance.
In the case of detecting changes in the mean, we assume that ( i )
is a piecewise constant sequence and ( i ) is a constant sequence.
Now, even if (εi ) is not normally distributed, a Gaussian loglikelihood can be used to define the contrast function. Let
k
U(Y
k−1 +1
, . . ., Y k ; ) =
(Yi −
)2
(C.6)
i= k−1 +1
then
k
G(Y
k−1 +1
, . . ., Y k ) =
(Yi − Y
k−1 +1: k
)
2
(C.7)
i= k−1 +1
where Y k−1 +1: k is the empirical mean of (Y k−1 +1 , . . ., Y k ).
When the number of shift points is unknown, it is estimated
by minimizing a penalized version of J( , y). For any sequence of
7
is used to denote the true value.
F( ) = J( , y) + ϕpen( )
(C.8)
where ϕ is a function of n that goes to zero at an appropriate rate
as n goes to infinity. The estimated number of segments K( ˆ n ) converges in probability to K . The proper pen( ) and the penalization
parameter ϕ are chosen according to Lavielle (2005).
References
Benediktsdottir, S., Danielsson, J., Zoega, G., 2011. Lessons from a collapse of a
financial system. Econ. Policy 26, 183–231.
Bessembinder, H., Maxwell, W., Venkataraman, K., 2006. Market transparency,
liquidity externalities, and institutional trading costs in corporate bonds. J.
Finan. Econ. 82, 251–288.
Boffelli, S., Skintzi, V., Urga, G., 2016. High- and low-frequency correlations in
European government bond spreads and their macroeconomic drivers. J. Finan.
Econometr. 15, 62–105.
Christiansen, C., 2007. Volatility-spillover effects in European bond markets. Eur.
Finan. Manag. 13, 923–948.
Codogno, L., Favero, C., Missale, A., 2003. Yield spreads on EMU government bonds.
Econ. Policy 18, 503–532.
Colacito, R., Engle, R., Ghysels, E., 2011. A component model for dynamic
correlations. J. Econometr. 164, 45–59.
Corbet, S., 2014. The contagion effects of sovereign downgrades: evidence from the
European financial crisis. Int. J. Econ. Finan. Iss. 4, 83–92.
Corbet, S., 2016. Turning tigers into PIIGS: the role of leverage in the Irish
economic collapse. Adv. Sustainabil. Environ. Just. 18, 21–55.
Corbet, S., Larkin, C., 2017. Has the uniformity of banking regulation within the
European Union restricted rather than encouraged sectoral development? Int.
Rev. Finan. Anal. 53, 48–65.
Corbet, S., Larkin, C., 2018. Populism and extremism: The immediate political
challenges to Europeanism. Geoforum.
De Grauwe, P., Ji, Y., Steinbach, A., 2017. The EU debt crisis: testing and revisiting
conventional legal doctrine. Int. Rev. Law Econ. 51, 29–37.
Deeg, R., 2005. Remaking Italian capitalism? The politics of corporate governance
reform. West Eur. Polit. 28, 521–548.
Engle, R., 2002. Dynamic conditional correlation: a simple class of multivariate
GARCH models. J. Business Econ. Stat. 20, 339–350.
Engle, R., Ghysels, E., Sohn, B., 2013. Stock market volatility and macroeconomic
fundamentals. Rev. Econ. Stat. 95, 776–797.
Engle, R., Rangel, J., 2008. The spline GARCH model for unconditional volatility and
its global macroeconomic sources. Rev. Finan. Stud. 21, 1187–1222.
Heathcote, J., Perri, F., 2002. Financial autarky and international business cycles. J.
Monet. Econ. 49, 601–627.
Katsikas, D., 2011. Global regulation and institutional change in European
governance. West Eur. Polit. 34, 819–837.
Kim, S.-J., Moshirian, F., Wu, E., 2006. Evolution of international stock and bond
market integration: influence of the European Monetary Union. J. Bank.
Finance 30, 1507–1534.
Lavielle, M., 2005. Using penalized contrasts for the change-point problem. Signal
Process. 85, 1501–1510.
Lierse, H., Seelkopf, L., 2016. Capital markets and tax policy making: a comparative
analysis of European tax reforms since the crisis. Comp. Eur. Polit. 14, 686–716.
Mei, J., Guo, L., 2004. Political uncertainty, financial crisis and market volatility.
Eur. Finan. Manag. 10 (4), 639–657.
Michaelides, A., 2014. Cyprus: from boom to bail-in. Econ. Policy 29, 639–689.
Mohl, P., Sondermann, D., 2013. Has political communication during the crisis
impacted sovereign bond spreads in the euro area? Appl. Econ. Lett. 20, 48–61.
Mugge, D., 2011. Limits of legitimacy and the primacy of politics in financial
governance. Rev. Int. Polit. Econ. 18, 52–74.
Nitoi, M., Pochea, M.M., 2019. What drives European Union stock market
co-movements? J. Int. Money Finance 97, 57–69.
Rajsingh, P., 2016. The global financial crisis and neo-liberal financialization. Crit.
Stud. Corp. Responsibil. Govern. Sustainabil. 11, 57–73.
Sensoy, A., Nguyen, D.K., Rostom, A., Hacihasanoglu, E., 2019. Dynamic integration
and network structure of the EMU sovereign bond markets. Ann. Oper. Res.
281 (1–2), 297–314.
Virk, N., Javed, F., 2017. European equity market integration and joint relationship
of conditional volatility and correlations. J. Int. Money Finance 71, 53–77.