Study on inundation due to storm surge for con dao island
Bạn đang xem bản rút gọn của tài liệu. Xem và tải ngay bản đầy đủ của tài liệu tại đây (3.46 MB, 119 trang )
DECLARATION
I hereby declare that is the research work by myself under the supervision of
Assoc. Prof. PhD. Vu Minh Cat. The results and conclusions of the thesis are fidelity,
which are not copied from any sources and any forms. The reference documents relevant
sources, the thesis has cited and recorded as prescribed. The results of my thesis have not
been published by me to any courses or any awards.
Ha Noi, date 12 July 2016
Author of the thesis
Nguyen Thi Lan
i
ACKNOWLEDGEMENTS
First and foremost I would like to thank the supervisor Ass. Prof. PhD Vu Minh Cat
for his great contribution in this thesis, for supporting me and guiding me stay on the right
trend. I also want to show deep thanks to Ass. Prof. PhD. Tran Thanh Tung who is main
co-ordinator, making value contributions to success in Master course. In addition, please
allow me to send my best gratitude to the “Research, identification scientific arguments
and proposal of Phu Quoc – Con Dao marine spatial planning for sustainable
development” subject, Code: KC.09.16 /11-15, which support a lot of valuable data for
my thesis.
Ha Noi, date 12 July 2016
Author of the thesis
Nguyen Thi Lan
ii
TABLE OF CONTENT
LIST OF FIGURES ........................................................................................................ vi
LIST OF TABLES ........................................................................................................vii
INTRODUCTION ........................................................................................................... 1
1. The necessity of the study ....................................................................................... 1
2. Study objectives ...................................................................................................... 1
3. Objects and scope of the study ................................................................................ 2
4. Study approaches and methodology........................................................................ 2
5. Structure of the thesis .............................................................................................. 3
CHAPTER 1: OVERVIEW ON STORM SURGE STUDY AND GENERAL
DISCRIPTION ON CON DAO ISLANDS .................................................................... 4
1.1. LITERATURE REVIEWS .................................................................................. 4
1.1.1. Introduction about storm in Con Dao islands ............................................... 4
1.1.2. International researches on storm surge....................................................... 6
1.2.3. Storm surge researches in Viet Nam........................................................... 12
1.2. GENERAL DISCRIPTION ON STUDY AREA .............................................. 14
1.2.1. Natural conditions ....................................................................................... 14
1.2.2. Climate ........................................................................................................ 16
1.2.3. Oceanographic regime ................................................................................ 18
1.2.4. Socio-economic activities ........................................................................... 19
CHAPTER 2: APPLICATION OF DELFT3D TO STUDY STORM SURGE ........... 22
iii
2.1 Description of model ........................................................................................... 22
2.1.1. Delft 3D model ........................................................................................... 22
2.1.2 Typhoon model ............................................................................................ 25
2.2. Data used for the simulation .............................................................................. 31
2.2.1. Topographical data...................................................................................... 31
2.2.2. Hydrodynamic data ..................................................................................... 31
2.3. Model set up ....................................................................................................... 32
2.3.1. Simulated domain and computed mesh ...................................................... 32
2.3.2. Model calibration ........................................................................................ 35
2.3.3. Model verification ....................................................................................... 39
CHAPTER 3: SIMULATION OF STORM SURGE IN CON DAO ISLANDS ......... 42
3.1. Typhoon scenarios in the areas announced by Vietnam government ................ 42
3.2. Extraction of water level around study islands .................................................. 45
3.3. Simulation of storm surge based on suggested scenarios .................................. 47
3.3.1. Scenario 0: Simulation of water level in Con Dao without Durian typhoon47
3.3.2 Scenario 1: Simulation of Durian typhoon .................................................. 48
3.3.3 Scenario 2: Simulation of Durian storm with changing wind speed ........... 55
3.3.4 Scenario 3: Simulation of Durian typhoon with changing only its trajectory60
3.3.5 Comparison of scenarios .............................................................................. 66
3.4. Chapter’s conclusion .......................................................................................... 69
CHAPTER 4: INUNDATED MAPPING DUE TO STORM SURGE ......................... 70
4.1. Introduction ArcGIS........................................................................................... 70
iv
4.2 Building inundated maps and inundated calculation for research area ............... 71
4.3. Build up inundation maps due to storm surge in Con Dao islands with scenarios
accordingly ................................................................................................................ 73
4.3.1. Building inundated mapping and calculation of inundated area for 1st scenario
............................................................................................................................... 76
4.3.2. Building inundated mapping and calculation of inundated area for 2nd scenario
............................................................................................................................... 77
4.3.3. Building inundated mapping and calculation of inundated area for 3rd scenario
............................................................................................................................... 79
4.4. Chapter’s conclusion .......................................................................................... 80
CONCLUSIONS AND RECOMMENDATION .......................................................... 81
CONCLUSIONS ....................................................................................................... 81
1. Major results ..................................................................................................... 81
2. Drawback .......................................................................................................... 81
RECOMMENDATION ............................................................................................ 82
REFERENCES .............................................................................................................. 83
APPENDIX 1: RESULTS OF MODEL CALIBRATION ........................................... 86
APPENDIX 2: RESULTS OF MODEL VALIDATION.............................................. 95
APPENDIX 3: WATER LEVEL IN CON DAO ISLANDS ACCORDING TO 4
SCENARIO ................................................................................................................... 99
v
LIST OF FIGURES
Figure 1. 1: Storm Surge vs. Storm Tide .............................................................................. 6
Figure 1. 2: Map of Con Dao Island ................................................................................... 14
Figure 2. 1: System architecture of Delft3D ...................................................................... 23
Figure 2. 2: Sketch of wind velocity field for a moving cyclone ....................................... 28
Figure 2. 3: Computed Mesh created for Con Dao area ..................................................... 34
Figure 2. 4: Topography of Con Dao islands ..................................................................... 34
Figure 2. 5: The water level line between observed water level and computed water level
with C= 55 m0.5/s ................................................................................................................ 37
Figure 2. 6: The water level line between observed water level and computed water level
with C= 75 m0.5/s ................................................................................................................ 38
Figure 2. 7: The water level line between observed water level and computed water level
with C= 68 m0.5/s in hydraulic model verification ............................................................. 40
Figure 2. 8: The water level line between observed water level and computed water level
with C= 68 m0.5/s in Storm model verification ................................................................... 41
Figure 3. 1: Partition of the storm risk of Vietnam coastal area ........................................ 43
Figure 3. 2: Extracted water level points in Con Dao ........................................................ 46
Figure 3. 3: Diagram of water level without Durian storm at around Con Dao islands
according to scenario 0 ....................................................................................................... 47
Figure 3. 5: Trajectory of Durian typhoon ......................................................................... 49
Figure 3. 6: Diagram of water level at point 1 according to 1st scenario ........................... 51
Figure 3. 7: Diagram of water level at point 2 according to 1st scenario ........................... 52
vi
Figure 3. 8: Diagram of water level at point 3 according to 1st scenario ........................... 52
Figure 3. 9: Diagram of water level at point 4 according to 1st scenario ........................... 52
Figure 3. 10: Diagram of water level at point 5 according to 1st scenario ......................... 53
Figure 3. 11: Diagram of water level at point 6 according to the1st scenario .................... 53
Figure 3. 12: Diagram of water level at point 7 according to the 1st scenario ................... 53
Figure 3. 13: Diagram of water level at point 1 according to 2nd scenario ........................ 57
Figure 3. 14: Diagram of water level at point 2 according to 2nd scenario ........................ 57
Figure 3. 15: Diagram of water level at point 3 according to 2nd scenario ........................ 57
Figure 3. 16: Diagram of water level at point 4 according to 2nd scenario ........................ 58
Figure 3. 17: Diagram of water level at point 5 according to scenario 2 ........................... 58
Figure 3. 18: Diagram of water level at point 6 according to 2nd scenario ........................ 58
Figure 3. 19: Diagram of water level at point 7 according to 2nd scenario ........................ 59
Figure 3. 20: Diagram of water level at point 8 according to 2nd scenario ........................ 59
Figure 3. 21: Tracks of Durian typhoon according to the 3rd scenario ............................... 62
Figure 3. 22: Diagram of water level difference when Durian typhoon occurred ............. 62
Figure 3. 23: Diagram of water level difference when Durian typhoon occurred ............. 63
Figure 3. 24: Diagram of water level difference when Durian typhoon occurred ............. 63
Figure 3. 25: Diagram of water level difference when Durian typhoon occurred at point 4
according to 3rd scenario ..................................................................................................... 63
Figure 3. 26: Diagram of water level difference when Durian typhoon occurred ............. 64
Figure 3.27: Diagram of water level difference when Durian typhoon occurred at point 6
according to 3rd scenario ..................................................................................................... 64
vii
Figure 3. 28: Diagram of water level difference when Durian typhoon occurred at point 7
according to scenario 3 ....................................................................................................... 64
Figure 3. 29: Diagram of water level difference when Durian typhoon occurred at point 8
according to scenario 3 ....................................................................................................... 65
Figure 3. 30: Diagram of water level difference at point 1 ................................................ 66
Figure 3. 31: Diagram of water level difference at point 2 ................................................ 66
Figure 3.32: Diagram of water level difference at point 3 ................................................. 67
Figure 3. 33: Diagram of water level difference at point 4 ................................................ 67
Figure 3. 34: Diagram of water level difference at point 5 ................................................ 67
Figure 3. 35: Diagram of water level difference at point 6 ................................................ 68
Figure 3. 36: Diagram of water level difference at point 7 ................................................ 68
Figure 3. 37: Diagram of water level difference at point 8 ................................................ 68
Figure 4. 1: DEM map in Con Dao islands ........................................................................ 74
Figure 4. 2: Contour line in Con Dao islands ..................................................................... 74
Figure 4. 3: Inundated mapping in Con Dao islands due to storm surge in Durian typhoon
according to 1st scenario ..................................................................................................... 76
Figure 4. 4 Inundated mapping in Con Dao island due to storm surge in Durian typhoon
according to 2nd scenario .................................................................................................... 77
Figure 4. 5: Inundated mapping in Con Dao island due to storm surge in Durian storm
according to 3rd scenario ..................................................................................................... 79
viii
LIST OF TABLES
Table 1. 1: Statistic of storm in Con Dao in the last 50 years .........................................4
Table 1. 2: The average temperature of air in the Con Dao Island ..............................16
Table 2. 1: Data of model ............................................................................................. 32
Table 2. 2. Parameters of Con Dao grid ........................................................................33
Table 2.3: Tidal harmonic constants at borders ............................................................35
Table 2. 4: Parameters of model ....................................................................................36
Table 2. 5. Table synthesis error values when calibration models ................................38
Table 3. 1. Basic characteristics and the potential affected by storm to coastal areas in
Vietnam ........................................................................................................................ 43
Table 3. 2. Potential of storm surge and total water level for Vietnam coastal areas ...44
Table 3. 3. Co-ordination and depth of extracted water lever points in Con Dao .........46
Table 3. 4: General information of the Durian typhoon ................................................48
Table 3. 5. Parameters of Durian typhoon ....................................................................50
Table 3. 6. The highest WL difference and appeared time at 8 points ..........................54
Table 3. 7. Parameters of Durian typhoon according to the 2nd scenario .....................55
Table 3. 8. The highest water level difference and appeared time at 8 extracted points
according to 2nd scenario ................................................................................................59
Table 3. 9: Parameters of Durian typhoon according to 3rd scenario ...........................61
Table 3. 10. The highest water level difference and appeared time ..............................65
Table 4. 1. Parameters of DEM map in Con Dao......................................................... 73
Table 4. 2. Inundated area in Con Dao islands according to 1st scenario ......................76
Table 4. 3. Inundated area in Con Dao islands according to 2nd scenario .....................78
Table 4. 4. Inundated area in Con Dao islands according to 3rd scenario .....................79
vii
INTRODUCTION
1. The necessity of the study
In recent years, the impact of global climate change, natural disasters has
become more complex, especially storms, accompanied by sea level rise, which caused
inundation in coastal area. Storm surges can cause inundation to coastal areas and can
cause dike break, especially if storms occur during high tides. Therefore, studying,
calculation and forecasting on the extreme water level during storm at coastal locations
and assessment of inundated risk by storm is very important for finding the solutions
and positive measures to prevent and mitigate damages.
Storm surge is a dangerous natural phenomenon, which caused a lot of damage
to people and property. In Vietnam, the highest water level has recorded as 3.6 m in
1989 by Dan storm. Storm surge is particularly dangerous when the storm occurs at
the same time with spring tides and in this situation, total water level rising combined
with strong wave can cause dike breaks and wave overtopping and also cause heavy
damages to people and property.
In Vietnam in general and Con Dao islands in particular, although there are a
lot of studies of sea level fluctuations in storm, but most of which focus on water level
fluctuations on a large scale. The fluctuations of water level in coastal locations and
inundated risk have not been interested adequately yet, especially when assessing the
inundated risk of coastal area. Therefore, studying of extreme water levels in storm, in
consideration of tides, storm surges, waves and inundated risk to coastal area takes a
great scientific meaning. The result of study will contribute to mitigate the
unfavourable impact of storm surges, serve for protection and maintenance, upgrading
of coastal structures, shoreline protection, requirement for socio-economic
development, environmental protection and sustainable development.
2. Study objectives
To assess situation of inundation due to storm surge for Con Dao islands.
1
3. Objects and scope of the study
- Objects of the study: The extreme water level during storm at the shoreline,
including tides, storm surges and inundated risk from the sea.
- Scope of the study: The area around Con Dao archipelago.
4. Study approaches and methodology
To achieve the above mention objectives, the methodology of this thesis has been
developed base on the characteristics of Con Dao islands. The thesis has been
performed in sequence the following steps:
Collect data
(Winds, waves, tide, water depth, Storm…)
Set up Model
(Delft 3D, GIS…)
Simulation storm surges
(Calibration and verification)
Simulated Results of Storm
Inundated mapping
Observation
Analysis and Discussion
Conclusions and Recommendations
2
Expert Interview
5. Structure of the thesis
Besides the introduction, conclusion, recommendation and annexes, the study is
consisted 4 chapters as following:
Chapter 1: Overview on storm surge study and general description on Con Dao
Chapter 2: Application of DELFT3D to study storm surge
Chapter 3: Simulation of storm surge for Con Dao islands
Chapter 4: Inundated mapping due to storm surge for Con Dao islands
3
CHAPTER 1: OVERVIEW ON STORM SURGE STUDY AND
GENERAL DISCRIPTION ON CON DAO ISLANDS
1.1. LITERATURE REVIEWS
1.1.1. Introduction about storm in Con Dao islands
Southern Vietnam is the region where has rare storm, but if the storm occurs
then the damage is very serious because people have not experience in storm
prevention as in Central and Northern coastal provinces. For over 50 years, several
storms have occurred, of which 3 hurricanes caused severe damage, such as Thin
typhoon in 1904, Linda typhoon in 1997 and Durian typhoon in 2006. Below is a
statistical table of typhoon occurs in Con Dao in the last 50 years (from 1962 to 2012)
Table 1. 1: Statistic of storm in Con Dao in the last 50 years
Source:
No.
Name of storms
Types
Time
1
#28
Typhoon
25 NOV-01 DEC, 1962
2
#3
Tropical Storm
14-17 FEB, 1965
3
#35
Tropical Storm
18-21 DEC, 1965
4
#24
Tropical Storm
27-27 NOV, 1970
5
#30
Typhoon
30 NOV-05 DEC, 1972
6
#22
Tropical Storm
14-18 NOV, 1973
7
#35
Tropical Storm
18-24 DEC, 1974
8
#32
Super Typhoon
1-10 NOV, 1989
9
#30
Typhoon
8-22 NOV, 1992
10
#34
Tropical Storm
24-31 OCT, 1996
11
#37
Tropical Storm
29 OCT-18 NOV, 1996
4
No.
Name of storms
12
LINDA
13
Types
Time
Typhoon
31-03 NOV, 1997
GIL
Tropical Storm
10-11 DEC, 1998
14
31W
Tropical Depression
01-01 DEC, 1999
15
32W
Tropical Depression
09-11 DEC, 1999
16
MUIFA
Typhoon
14-26 NOV, 2004
17
DURIAN
Super Typhoon
26 NOV-05 DEC, 2006
18
TWENTYFIVE
Tropical Depression
14-14 NOV, 2012
- In principle, typhoons attacked Viet Nam Coasts are originated from west
pacific ocean and entering to East sea and typhoon track is seasonally changed. The
first half of the storm season, typhoons approach mostly to northern and central coasts
of Viet Nam, but the latter half of the season, storms move gradually to the south and
affected to south-central and southern coasts of Viet Nam. On average, typhoons are
less likely to affect Vietnam from January to May. From June to August, they are most
likely to affect the Northern regions and moving to central and southern regions from
September to December annually.
- In the latter half of the year, typhoon’s trajectories often more complicated
than first half of typhoon season. The trajectory of the storm in the East Sea can be
divided into five main types: stable, complex, parabolic, weaken at sea and becomes
stronger as be near the shore. Among them, the complex form and the form of
becomes stronger as be near shore are the most unpredictable.
Table 1.1 shows the storm landed in Con Dao from October to December each
year belonging latter half of the storm season. At this time, trajectory of typhoon
becomes more complex and less predictable.
5
1.1.2. International researches on storm surge
Along the coast, storm surge is often the greatest threat to life and property from a
typhoon. In the past, large death tolls have resulted from the rise of the ocean
associated with many of the major typhoons that have made landfall. Typhoon Katrina
(2005) is a prime example of the damage and devastation that can be caused by surge.
At least 1500 persons lost their lives during Katrina and many of those deaths occurred
directly, or indirectly, as a result of storm surge.
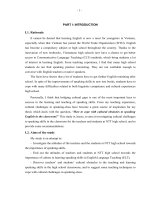
Storm surge is an abnormal rise of water generated by a storm, over and above the
predicted astronomical tides. Storm surge should not be confused with storm tide,
which is defined as the water level rise due to the combination of storm surge and the
astronomical tide. This rise in water level can cause extreme flooding in coastal areas
particularly when storm surge coincides with normal high tide, resulting in storm tides
reaching up to 20 feet or more in some cases.
Figure 1. 1: Storm Surge vs. Storm Tide
Currently research of storm surge (and monsoon) has achieved a lot results. The
country suffered damage by storm surges as US, Japan, Russia, China ... has selfconstruction and development of appropriate software and also provided other
6
countries use as India, Bangladesh. There are several methods of calculation and
forecast storm surge such as method uses semi-empirical formula, diagram method,
artificial neural network method and numerical model methods.
In the method using semi-empirical formula (Ippen and Hallerman, 1966),
surge magnitude is calculated based on ground level according to wind speed, wind
fetch length, the angle between the wind direction and the axis perpendicular to the
shoreline and the water depth. This method is very simple, but precision is not high
because which did not describe all the factors impact on storm surges.
Diagram method (Yang et al, 1970, Horikawa, 1985) is often used to forecast
storm surges for some ports, where have many monitoring data on typhoons and storm
surges. The content of the method is to construct the monogram based on the
relationship between monitoring data of water level with parameters of typhoon storm
(the largest wind speed, wind direction, reduce of pressure in the centre). Therefore,
there is very limited when there is insufficient data or data series is not long enough
(usually around 100 years if requirement of high precision result) and often only true
for the nearest observation station.
Numerical models method was created to overcome the deficiencies of
empirical measurement data. The advantage of this method is reduction of cost
compared with experimental measurement methods. In addition, this method also
allows calculation, forecast the evolution of the phenomenon based on a lot of
proposed scenarios, which is not yet existed in reality, but likely to happen in the
future.
In “Damage Assessment from Storm Surge to Coastal Cities: Lessons from the
Miami Area” Genovese, Hallegatte and Dumas focused on the two contiguous
counties of Miami, Dade and Broward. In this research, authors considered the impact
of different storm surges predicted by the computerized model SLOSH1 and
investigate flood risks with current sea level, considering different typhoon parameters
(storm category, track, wind speed, and tide level). For each impact, authors apply a
7
damage function and determine if the considered storm surges potentially lead to asset
loss, considering both properties and their contents. The results show that, in absence
of protections, losses will be very high for large storm surges reaching up to tens of
USD billions. In the second part of the analysis, authors demonstrate how the
economic impact changes when protections are built up, considering different dams’
heights. The authors concluded that raising flood defences would be beneficial, since
the consequences of a storm surge could be enormous.
In the “Developments in storm and in combination with tide modeling and risk
assessment in the Australian region” Bruce Harper, Thomas Hardy, Lucian Masonand
Ross Fryar emphasized the need for integrated planning and forecasting approaches
for storm tide risk assessment. The importance of the meteorological forcing and the
appropriate modeling of each of the storm tide components, namely astronomical tide,
storm surge, breaking wave setup and coastal inundation is discussed. The critical role
of tropical cyclone “best track” datasets for risk assessment studies and the potential
impacts on design criteria and risk assessment studies is highlighted, together with the
challenge of developing credible enhanced-greenhouse climate change scenarios. It is
concluded that storm tide modeling needs to be undertaken in a holistic framework
that considers the relative uncertainties in each of the various elements - atmospheric,
hydrodynamic and data, as well as addressing operational forecasting, design and
planning needs.
Methods used to simulate and assess storm surge
(1) Analytical methods to determine storm surge: The linear relationship between
storm and storm surges can not cover the storm surge phenomenon fully. Previously
when computer technology and methodology has not developed the analytical methods
have been mentioned. This method can be found in the documents of Russia, Spain
and Japan. Currently, this method is almost undeveloped, except for some
establishments want to have very fast approximate forecast results.
8
(2) Experimental methods: Using the results of the analytics model through
experiments create expressions to describe storm surge phenomena. These results may
be put into operation quickly. Experimental property is shown in the observation of
real high storm surge in off-shore, near-shore region more difficult to implement.
Then, using the analytic relationship of wave propagation and water depth, the height
of storm surge can be determined in coastal areas.
(3) Statistical and regression methods: This is one of the methods to be applied widely
in the world, where measured data is available or the monitoring of storm surges
simultaneously with other environmental factors. Statistical methods are used in
combination with probability theory and extreme method. Murty (1978), Harris (1962)
was the first authors to propose statistical methods to apply in forecast, calculation of
storm surge. Firstly Harris created datasets of storm surges including monitoring data,
data of interpolation, extrapolation and additional data from the source of results from
numerical model, which is got by the linear model. From these data sets, the author
had built equations of linear regression to predict surges.
Although there are many advantages to forecast storm surges, however statistical
methods only offer best results once applied on defined area. To build a regression
equation to forecast of storm surges, we need to consider the impact relations follow
the impact function.
The form of equation of general linear regression could be written as follows (Murty
1978).
(x, y, t) = ai,j,k ( x0, y0) Fi,j ( t – i t )
(1-1)
In which:
- : Altitude of rising water at x0, y0 station in time t.
- t : Time step
- i: Time step between monitoring time periods
9
- i, j: Indexes corresponding to monitoring stations
- k: indexes of monitoring stations
- Fi,k(t – i t ): Quantities characterize for meteorological parameters, which has k
form from j monitoring stations at time (t – i t) .
- ai,j,k ( x0, y0): Coefficients corresponding to dependent parameters. This coefficients
can be determined by theory or empirical datas ...
To determine the height of water rise, people often use empirical formulas, which is
summarized from the actually observed documents for each area. In Vietnam, Bui
Xuan Thong and Nguyen Tuong have based on survey of relationship between heigh
of storm surges with wind speeds from 1959 to 1970 in Northern coastal area, they
have given the calculated expression as follows:
h = 0.175 W2max
(1-2)
In which:
Wmax - The average wind speed of storms (m/s)
h – the height of storm surge (cm)
In the past time, in order to calculate the height of storm surge when design the
warehouse, Soviet Union has often applied the formula of Karausev A.V, Labzovski
N.A, especially norms like:
+ According to the .06.04.82 normative of Soviet Union
h = kw. (W2.X/gH).cos .
(1-3)
+ According to the 22 TCN 222-95 branch standard of Ministry of Transport
h =kw(W2.X/g(H+0.5. h). cos .
(1-4)
10
+ According to QP.TL.C - 1 - 78 Norm of Ministry of Irrigation (Ministry of
Agriculture and Rural Development)
h = 2. 10-3. (W2.X/gH).cos .
(1-5)
In which
W – wind speed (m/s)
X – wind momentum (km)
H – water depth (m)
(4) Hydraulic physical model: There are two approaches to the problem of storm
surges with a lot of advantages however to put in on practical application is limited.
Two approaches were hydraulic models and analog electric models.
Representing the group of analog electrochemical methods is the Russian authors as
Macarov and Menzin (1970), Ishiguro (1972). In principle, the electric network is
designed as real hydraulic network and electric parameters is replaced as hydraulic
system such as water level, discharge etc. Since dynamic processes are simulated on
the analog network, Ishigura was suggested as follows. (1) The external forces make
up water flow in the hydrodynamic system has similar nature like current electric in
electric network, (2) current electric flow through the absorption of electrical power
generated voltage, likewise due the dynamic nature of currents will create different
water levels, (3) the law of energy conservation through the continuity of line appear
in both real and same network and (4) Timing is the same in both network systems.
(5) Hybrid method: Holz (1977), Funke and Crookshank (1979) tested hybrid model in
the tidal estuary. The mathematical and physical meaning of Hybrid model show in the
combination of propagation of long wave through coastal area by 2 models, which
simulate at the same time in deep water and shallow water and through dynamic model
and hydraulic model. Two models simulate at the same time, water level at the
11
abutting area between two models is determined empirically and put this value into
dynamics numerical models.
In fact, the application of Hybrid models is done continuously at the same time of two
model types as physical models and hydraulic model. Information is exchanged
directly through the interface of two model regions.
(6) Methods of numerical simulation: This is the main content of the mathematical
modeling techniques to simulate storm surge. This technique includes the following
steps.
- The first step is to build an understanding about the nature of the physical
phenomena of storm surge and processes expressed in real terms. This step, the
researcher completely can do and must do it.
- The second step is to find out the formation process of mathematical equation to
describe storm surge.
- The third step is the techniques to identify forming forces of storm surge, the closed
system of equations. Determine the type of boundary conditions including hard
boundary, liquid boundary and side boundary.
- The fourth step is the technique to solve a system of equations, which have been set
up. This is the digital part, which relating to calculated grids, difference method, select
the programming language ...
- The fifth step is the techniques to calibrate model, the stability of the model
1.2.3. Storm surge researches in Viet Nam
Vietnam is a coastal country, where have high storm surges risk so researches
of storm surges have been done for a long time and many models and technology of
storm surge forecast were built. Besides the development of numerical models to
simulate the storm surge, some studies tend to use commercial models or open source
model to calculate storm surges to coastal areas of Vietnam. The business model may
12
be mentioned as MIKE package developed by Denmark Hydraulic Institute (DHI) and
Delft-3D model by Delft Technology University, Netherlands, etc.
In researching methods by numerical models, three main research directions
have been implemented. They are (i) built particular models; (ii) research and develop
open source models of abroad and (iii) use commerce models of abroad. In addition
there have many projects, research projects in different levels, which are implemented
and developed models, technology to calculate and forecast of storm surges in
Vietnam.
In the project namely “Nghiên cứu để cập nhật, chi tiết hóa bộ số liệu cơ bản về
triều, nước dâng dọc bờ biển từ Quảng Ninh đến Quảng Nam phục vụ tính tốn thiết
kê, nâng cấp tuyến đê biển” conducted by Dinh Van Manh and partners, based on data
base of tides, storm surges and total levels of tide and storm surges along the coasts
from Quang Ninh to Quang Nam were established, in which, data of statistical arising
storm was built by Monte Carlo method based on probability distribution of the
parameters storms occurred in the past.
Following this direction, in “Nghiên cứu xây dựng hệ thống dự báo tác nghiệp
khí tượng thủy văn biển (gồm dịng chảy, sóng và nước dâng do bão) vùng biển Đông
và ven biển Việt Nam” project, Le Trong Dao and partners have used Delft 3D model
to set up and simulation, forecasting storm surges to coastal areas in Vietnam.
In addition, Nguyen The Tuong, Tran Hong Lam et al (2007) in the framework
of cooperation between Vietnam - China research project used a package of models
such as 3D Delft of the Netherlands, JMA (Japan Meteorological Agency storm surge
model) of Japan and CTS (China typhoon Surge) of China to calculate and provide
forecasting water surges fo the coasts of Viet Nam.
13
1.2. GENERAL DISCRIPTION ON STUDY AREA
1.2.1. Natural conditions
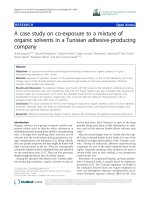
1.2.1.1. Geographical location
Con Dao archipelago consists of 16 islands with total of 76 km2, which located in the
far southern sea and far from Vung Tau city of 185km, from the Ho Chi Minh City
230 km and from the Hau estuary (Can Tho) about 83km. Geographical coordinates of
Con Dao island is 106031 'to 106045' East longitude and 8034' to 8049' North latitude.
The largest island is Con Lon (Con Dao) with area of 51.52 km2 and is also the
economic, cultural, political and social center of the district. Population of Con Dao
district about 7,000 people in 2013, there is no administrative units of wards and
communes, only the residential area.
Source: KC.09.16 Subject
Figure 1.2: Map of Con Dao Island
Con Dao district has great potentials for development of tourism, exploitation
and processing of seafood, port development, petroleum and gas complex services and
shipping. Coast with a 200 km of length, with many beautiful beaches like Dat Doc,
14
Bai Canh, Dam Trau, Hon Cau, Hon Tre... In addition, the Con Dao National Park is
an area of nearly 6.000 ha on mainland and 14.000 ha on sea with a variety of trees
and rare animals.
1.2.1.2. Characteristics of topography and geomorphology
Con Dao archipelago was formed in stage of volcanic activity in the late Jurassic
and lasted until late Paleogenic era. Because tectonic activity of volcano in the period
mentioned above, the archipelago was formed and exists to the present day. Con Dao
has soil texture and terrain more complex than other islands.
Floating Island Region: Con Dao Islands consists of 14 floating islands,
including Con Son Island, which is the largest island with area of approximately
58km2, three other islands with area of over 5 km2 as Hon Ba, Hon Bay Canh and Hon
Cau and ten remaining islands has an area of less than 1km2. Con Dao has low
mountainous terrain (Thanh Gia mountain with the highest peak of 577 m), mountains
was formed by magma eruption.
Coastal zone: The shoreline of Con Dao Island has complex structure, texture
of rock mailly formatted by magma eruption and intrusion. The distribution and
positions of shoreline are not fixed, depending on tide, sedimentation and erosion.
Coast are composed of erupted magma distributed in the northeast of Con Dao and
Hon Tai, Bay Canh, Hon Cau and some other small islands in the northwest. Features
of eruptive rocks are highly alkaline. Coast are composed by shallow intrusion magma
is the stretch of shore in Ben Dam, Thanh Gia mountain, Ta Be mount, Chim cape and
northwest shore of Bay Canh island. Coast is composed of discrete Quaternary rocks
distributed in central areas of Con Dao - the first coast of Co Ong airport valley. The
sediment here mostly is fine sand originated by sea.
The seabed: The seabed have abrasives and accumulate surface in depths from
3-10m: It is not great area, mainly distributes in the northeast coast, central and south
western of Con Dao islands. This is the underground shelf of Northeast gulf, Con Son
bay, Ben Dam bay. Largely of surface is sand, fine-grained sand mixed with organism
15
debris. Some surface areas have coral reefs developing rapidly such as Con Son Gulf,
Ben Dam Bay. Particularly in Con Son Gulf, which near the pier exists negligible
accumulation, is mud.
The bottom area has abrasion accumulates surface at depths from 10 to 20 m:
Focusing mainly in Northeast bay and Con Son Gulf Bay which in southwest Con Dao
island. Bottom topography in the north-eastern and central regions is relatively flat;
bottom sediments are mostly fine sand and sand-sea creatures. The bottom topography
of southwest of Con Dao has more complex surface roughness. Bottom sediments are
mainly sand, gravel and mixed into sea creatures, coarser composition of grain.
1.2.2. Climate
1.2.2.1. Temperature
Con Dao locates in the area of tropical monsoon climate and has two distinct
seasons: rainy seasons and dry seasons, surrounded by sea, so climate of Con Dao is
influenced by ocean climate regime therefore Con Dao climate regime is more
moderate than the mainland. Air temperature in Con Dao doesn’t not oscillates largely,
the average temperature of months in year ranges between 26-290C, full-year average
temperature is 27,80C (high absolute temperatures is 360C and low absolute
temperatures 180C) (Dang Ngoc Thanh, 2003). This is the most moderated areas of
coastal zone in Vietnam with the oscillation amplitude of temperature annually is low,
not over 3,10C - 40C. Monthly average temperature is highest in May with 28,30C and
lowest in January with 25,20C (table 1.2).
Table 1. 2:
The average temperature of air in the Con Dao Island
Source: Nguyen Van Au, 2002
Month
1
2
3
4
5
6
T (0C)
25,2 25,7 26,9 28,2 28,3 27,8 27,5
16
7
8
9
10
11
12
27,5 27,2 26,9 26,7 25,7