Response of maize yield under different climatic and production conditions in vietnam
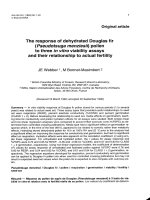
Bạn đang xem bản rút gọn của tài liệu. Xem và tải ngay bản đầy đủ của tài liệu tại đây (5.44 MB, 139 trang )
..
Department of Water, Atmosphere and Environment
Institute of Meteorology
Supervisor: Ao. Prof. Dipl. Ing. Dr. Josef EITZINGER
Co-supervisor: Assoc. Prof. Dr. Ahmad M. MANSCHADI
RESPONSE OF MAIZE YIELD UNDER DIFFERENT
CLIMATIC AND PRODUCTION CONDITIONS IN VIETNAM
Dissertation
for obtaining a doctorate degree
at the University of Natural Resources and Applied Life
Sciences Vienna
Submitted by
Tran Thi Mai Anh
Vienna, December 2018
i
Acknowledgements
The sincerest appreciation is for my Supervisor Ao. Prof. Dipl. Ing. Dr. Josef EITZINGER who has
been giving a great support especially during the period that I was studying as a Ph.D. student at
Institute of Meteorology, University of Natural Resources and Life Sciences, Vienna. I have also
received much encouragement from my Co-supervisor Assoc. Prof. Dr. Ahmad M. MANSCHADI
who is one of the most enthusiastic professors I have ever met so far. Moreover, I would like to
thank Professor Branislava LALÍC for her great support during training courses that granted by
project SERBIA FOR EXCELL in the Department of Meteorology and Crop Science, University of
Novi Sad, Serbia. Other thankful words are for all of the professors, engineering staffs in Institute
of Meteorology (BOKU) and in Thai Nguyen University of Agriculture and Forestry, Vietnam for
their great support.
Additionally, I would like to express my appreciation to Vietnam International Education
Cooperation Department (VIED) and Austrian agency for international mobility and cooperation in
education, science and research (OeAD) for their financial assistance. Principally, I gratefully
thank Ms. Karin KIETREIBER (OeAD-official) who gave me a kind support since my first days in
Vienna.
Finally, I would like to thank Vietnam Department of Agriculture and Department of Natural
Resource and Environment for the database which I used for this dissertation.
ii
ABSTRACT
Maize (Zea mays. L) is the second most valuable cereal crop in Vietnam as well as in the study
area, a province in the North of Vietnam. It is grown at two different growing seasons, during winter
(winter maize, grown from September till January) and spring (spring maize, grown from February
till May). Maize is currently indeed more important than ever because of increasing food demand
which is caused by increasing population in Vietnam. Nonetheless, the climate variability drives
various challenges such as flooding and droughts in recent years, which are two principal abiotic
stresses on maize production in Vietnam.
To identify the influence of climate variability on maize production, the study used DSSAT-CERESmaize model version 4.5 to simulate maize growth and yield. Additionally, the AGRICLIM model
was applied to analyze changes in adverse weather conditions by indicators. To run the CERESMaize model requires four main individual input data sets which are daily weather parameters, soil
and crop characteristics, and agronomic management information. Additionally, field experiment
data were used for calibration of crop parameters to ensure the simulation accuracy. The field
experiments were conducted by Nguyen Huu Hong in 2008 (N.H.Hong, 2008) for two seasonal
maize crops, during the spring and winter 2008 in Dong Hy district, Thai Nguyen province. To
validate the model, annual observed maize yields (yield statistic reports) during a period of 15
years from 2000-2014 were used to compare with simulated maize yields. The performance of the
simulated results afterwards were statistically assessed by the Normalized Root Mean Square
Error (NRMSE). The NRMSE values proved that DSSAT-CERES-Maize reproduced crop growth
parameters well, with the NRMSE values in a range between 19.4% and 10.3%, however, showing
a better performance in spring maize simulation than in winter. Furthermore, the results also
indicated the critical role of irrigation for good maize yields during the 15-year period and the
influence of different soil types on maize yields. This evidence is expressed, for example, by a
decline in simulated maize yields under rainfed conditions, where maize yields were reduced or
crop failure occurred by lack of water for germination.
To simulate the maize production perspective till 2100, the study applied climate change
scenarios, in specific the Representative Concentration Pathways RCP 4.5 and RCP 8.5, which
are stabilized to limit radiative forcing at 4.5 and 8.5 W m-2, respectively. The results show (under
unchanged current crop management options such as used cultivars) that annual production of
maize (incl. winter and spring maize) from 2035-2100 are slightly lower than in the past (reference
period 2000-2014), caused by the balance of decreasing spring maize and increasing winter maize
yields. However, taking into account the average of yearly maize yields over the whole period of
iii
100 years, it was determined to be higher than the average of observed annual maize yields in the
period (2000-2014) of about 1.1% under RCP 8.5 and 3.6% under RCP 4.5. Winter maize yields
were calculated to increase up to 33.3% and 31.9% under RCP 4.5 and RCP 8.5, respectively,
while spring maize yields, in opposition, decreased under both climatic scenario conditions, RCP
4.5 and RCP 8.5, by -30.3% and -33.9%, respectively. These results are mainly correlated with a
higher number of dry days and less precipitation in spring compared with winter contribute to maize
yield decline.
Additionally, due to climatic change conditions in the future, N leaching is projected to decrease
considerably in spring season due to less precipitation, where it slightly increases in the winter
season. Approximately 70% of total N leaching in spring seasons is less than 41 kg ha-1 while
approximately 70% of N leaching in winter seasons is higher than 56 kg ha-1 under RCP 4.5.
Likewise, N leaching in spring seasons is lower than in winter seasons under RCP 8.5. This is
consistent with the higher number of dry days in spring seasons compared to winter season in the
next decades up to 2100 under both climate change scenarios (RCP 4.5 and RCP 8.5), as
calculated by AGRICLIM.
To adapt to the changed climate conditions in the future, it is necessary to foresee new approaches
that would mitigate severe weather effects and improve crop productivity such as planting date
changes, intercropping cultivations, mulch applications and additional irrigation.
Keywords: Climate variability, climate change, maize production, Vietnam, DSSAT-CERES,
RCP 4.5, RCP 8.5.
iv
ZUSAMMENFASSUNG
Mais (Zea mays. L) ist die zweitwichtigste Körnerfrucht in Vietnam sowie im Untersuchungsgebiet,
einer Provinz im Norden Vietnams. Er wird in zwei unterschiedlichen Jahreszeiten angebaut, im
Winter (Wintermais, September-Jänner) und im Frühjahr (Frühjahrsmais, Februar-Mai). Mais ist
aufgrund der wachsenden Bevölkerung und damit steigender Nachfrage nach Lebensmitteln in
Vietnam wichtiger denn je. Die Klimavariabilität in Vietnam in den letzten Jahren führte jedoch zu
zunehmenden abiotischen Stressfaktoren für Mais wie Überschwemmungen und Trockenheiten,
die die Maisproduktion in Vietnam beeinträchtigten.
Um den Einfluss von Klimavariabilität auf die Maisproduktion zu erfassen, wird in der Studie Mais
mit dem DSSAT-CERES Maismodell Version 4.5 simuliert. Zusätzlich wird das AGRICLIM Modell
zur Analyse von Änderungen ungünstiger Witterungsbedingungen mittel Indikatoren eingesetzt.
Die Datenanforderungen zur Durchführung der Simulation mit dem CERES-Maize Modell
umfassen vier Arten von Eingabedaten, nämlich tägliche Witterungsparameter, Boden- und
Pflanzeneigenschaften und produktionstechnische Informationen. Zusätzlich wurden Messdaten
aus
Feldversuchen
für
die
Kalibrierung
der
Pflanzenparameter
verwendet,
um
die
Simulationsgenauigkeit sicherzustellen. Die Feldversuche wurden von Nguyen Huu Hong (2008)
in den zwei saisonalen Wachstumsperioden, Frühjahr und Winter 2008, im Distrikt Dong Hy, in
der Provinz Thai Nguyen, Vietnam, durchgeführt. Um das Modell zu validieren, wurden
Durchschnittswerte jährlicher Maisertragsdaten aus Ertragsstatistiken von 15 Jahren (2000-2014)
verwendet, um sie mit simulierten Maiserträgen zu vergleichen. Die Güte der simulierten
Ergebnisse wurde anschließend mit dem normalisierten mittleren quadratischen Fehler
(Normalized Root Square Error, NRMSE) statistisch bewertet. Die NRMSE-Werte zeigen, dass
das DSSAT-CERES-Maismodell gute Ergebnisse liefert, wobei die NRMSE-Werte in einem
Bereich zwischen 10,3% und 19,4% lagen und beim Frühjahrsmais bessere Ergebnisse erreicht
wurden. Die Ergebnisse unterstreichen auch die wichtige Rolle der Bewässerung für gute
Maiserträge in den 15 Jahren der Referenzperiode (2000-2014) und den Einfluss verschiedener
Bodentypen auf den Maisertrag. Die Ergebnisse zeigen zum Beispiel einen Rückgang der
simulierten Maiserträge ohne Zusatzbewässerung bzw. einen Totalausfall durch fallweise
Verhinderung des Feldaufgangs durch Trockenheit.
Um die Perspektive der Maisproduktion im Jahr 2100 zu simulieren, verwendete die Studie
Klimaszenarien, die sogenannten Repräsentativen Konzentrationspfade RCP 4.5 und RCP 8.5,
die stabilisiert sind, um den Strahlungsantrieb bei 4.5 bzw. 8.5 W m-2 zu begrenzen. Diese
v
Ergebnisse zeigen, dass die Jahresproduktion von Winter- und Frühjahrsmais zusammen (bei
gleichbleibender Produktionstechnik wie genutzte Sorten, usw.) in der fernen Zukunft (2035-2100)
im geringfügig niedriger sein würde als in der Gegenwart (Bezugszeitraum 2000-2014), bedingt
durch die Bilanz sinkender Erträge bei bei Frühjahrsmais und entsprechend zunehmender Erträge
bei Wintermais. Berücksichtigt man jedoch den Durchschnitt der jährlichen Maiserträge über den
gesamten Zeitraum von 100 Jahren (2000-2100 Klimaszenariendaten), zeigt sich, dass der
simulierte Jahresertrag (gemittelter Winter- und Frühjahrsmaisertrag pro Jahr) beim RCP 8.5
Klimaszenario etwa +1,1% und beim RCP 4.5 Klimaszenario um 3,9% über dem Durchschnitt der
beobachteten jährlichen Maiserträge (Referenzperiode 2000-2014) liegt. In beiden Fällen wird
dabei ein deutlicher Anstieg der unbewässerten Wintermais-Erträge simuliert, nämlich eine
Zunahme der Wintermais-Erträge um 31,9% unter dem Klimaszenario RCP 8.5 und um 33,3%
unter dem Klimaszenario RCP 4.5. Die Erträge bei unbewässerten Frühjahrsmais hingegen
zeigen einen starken Rückgang unter den beiden Klimaszenario-Bedingungen RCP 4.5 und RCP
8.5 um 30.3% bzw. 33.9%. Dieses Ergebnis ist durch eine deutliche Zunahme der Anzahl von
Trockentagen und geringeren Nierschlägen in der Frühjahrsmaissaison im Vergleich zur
Wintermaissaison bedingt.
Aufgrund der veränderten klimatischen Bedingungen wird die N-Auswaschung in der
Frühjahrssaison aufgrund der geringeren Niederschläge voraussichtlich deutlich zurückgehen und
in der Wintersaison leicht ansteigen. Etwa 70% der N-Auswaschung beim Frühjahrsmais beträgt
weniger als 41 kg ha-1, während 70% der N-Auswaschung in den Wintermonaten mehr als 56 kg
ha-1 unter RCP 4.5 beträgt. Ebenso ist N-Auswaschung im Frühjahr niedriger als in den
Wintersaisonen unter RCP 8.5. Dies steht im Einklang mit der höheren Anzahl trockener Tage in
der Frühjahrssaison im Vergleich zur Wintersaison in den nächsten Jahrzehnten bis 2100 unter
beiden Klimaszenarien (RCP 4.5 und RCP 8.5), die von AGRICLIM simuliert wurden.
Um sich zukünftig an die veränderten Klimabedingungen anpassen zu kưnnen, müssen neue
Anpassungsmnahmen
vorgesehen
werden,
welche
die
Auswirkungen
extremer
Witterungsbedingungen abschwächen und die Pflanzenproduktivität verbessern, wie z.B.
Änderung der Anbauzeitpunkte, Mischkulturen, Mulchsysteme und zusätzliche Bewässerung.
Schlüsselwörter: Klimavariabilität, Klimaszenarien, Maisproduktion, Vietnam, DSSAT-CERES,
RCP 4.5, RCP 8.5.
vi
ORGANIZATION OF THE THESIS
The Ph.D. thesis is organized into 5 chapters.
Chapter 1: Introduction
General information about climate, soil conditions and maize production in Vietnam and general
information about the study area is introduced in this first chapter.
Chapter 2: Literature review
Overview of study is arranged into several parts.
* Climate and climate change in global scale and regional scale
This section is about the global climate system, regional climate systems, besides, partly
introduces climatic conditions and their influence in agriculture as well as in maize production.
* Prior studies about maize production worldwide and in Vietnam
Maize is grown worldwide. Therefore, numerous studies about maize have been carried out by
various places from temperate regions to tropical and arid regions. This part takes an overview of
the studies about maize productions and things about it.
* Crop modeling and its role in crop management in future
This section is about the approach to study maize production and crop modeling. This is based on
the development of crop models worldwide. This trend develops in future is a novation as well as
a vision further.
Chapter 3: Materials and Methods
Input data and methods for study are presented in detail in this chapter. Each step to carry out the
study is described in this section.
Chapter 4: Results and discussion
To address the objectives and research questions, the results answer the questions about the
signs of climate change in the study, the impact of climate conditions on maize production. Finally,
the results show up the perspective of maize production in the future under climate change
scenarios with various aspects from other studies around the same topic.
Chapter 5: Conclusions and recommendations
In this section, the results are concluded in a brief content with some suggestions and
recommendations for further research as well as farming options.
vii
TABLE OF CONTENTS
ORGANIZATION OF THE THESIS ......................................................................................................... vii
I. INTRODUCTION.................................................................................................................. 11
1.1 Introduction ............................................................................................................................... 11
1.1.1 Vietnam and its weather system ......................................................................................................................... 11
1.1.2 The study area ..................................................................................................................................................... 12
1.1.3 Maize physiology and production ....................................................................................................................... 13
1.1.4 Types and uses of maize...................................................................................................................................... 14
1.1.5 Agriculture and cropping systems in Nguyen province ....................................................................................... 16
1.2 Problem statement ..................................................................................................................... 18
1.3 Research questions ..................................................................................................................... 22
1.4 Research Objectives .................................................................................................................... 22
II. LITERATURE REVIEW ......................................................................................................... 23
2.1 Dry and rainy seasons ................................................................................................................. 23
2.1.1 Monsoon and its effect in East Asian countries .................................................................................................. 23
2.1.2 Monsoon and its effect in Vietnam ..................................................................................................................... 24
2.1.3 Pacific El Nino Southern Oscillation (ENSO) ........................................................................................................ 24
2.2 Climate change and climate variability ........................................................................................ 25
2.1.1 Climate change and its influence in Southeast Asia ............................................................................................ 27
2.1.2 Climate change and climate variability in Vietnam ............................................................................................. 28
2.2 Impacts of climate change in the study area ................................................................................ 29
2.2.1 Droughts and its effect ........................................................................................................................................ 29
2.2.2 Erosion and land degradation ............................................................................................................................. 30
2.3 Climate change scenarios ....................................................................................................................................... 31
2.3.1 Climate change scenarios for South Asia ............................................................................................................ 33
2.3.2 Climate change scenarios for Vietnam ................................................................................................................ 33
2.4 The interaction between climate change and agriculture ............................................................. 34
2.5 Maize production under climate change conditions ..................................................................... 35
viii
2.6 Maize production in Vietnam ...................................................................................................... 37
2.7 Crop modelling ........................................................................................................................... 40
2.7.1 DSSAT model application .................................................................................................................................... 41
2.7.2 Limitations of DSSAT crop models applications .................................................................................................. 42
III. MATERIALS AND METHODS .............................................................................................. 43
3.1 Study area and weather stations ................................................................................................. 43
3.2 Data collection and analysis ................................................................................................................................... 46
3.2.1 Weather data ...................................................................................................................................................... 48
3.2.2 Soil data ............................................................................................................................................................... 50
3.2.2.1 Soil types in study area..................................................................................................................................... 50
3.2.2.2 Examination of some soil profiles and soil properties ..................................................................................... 51
3.2.3 Experiment fields and crop management data ................................................................................................... 56
3.3 DSSAT CERES – Maize application ................................................................................................ 58
3.3.1 Calibration and validation of DSSAT model ......................................................................................................... 58
3.3.2 Crop simulation ................................................................................................................................................... 59
3.3.3 Performance of DSSAT-CERES Maize model ....................................................................................................... 60
3.3.3.1 Validation of CERES-Maize ............................................................................................................................... 60
3.3.3.2 Sensitivity analysis of CERES Maize model under various weather conditions ................................................ 61
3.3.4 Maize yield simulation under climate change scenarios ..................................................................................... 62
3.3.4.1 GCMs scenarios ................................................................................................................................................ 62
3.3.4.2 Simulation of maize yields during 2001-2100 .................................................................................................. 62
3.4 AGRICLIM - Agroclimatic Indexes model ...................................................................................... 62
IV. RESULTS AND DISCUSSION ............................................................................................... 63
4.1 Past climate characteristics of Thai Nguyen province ................................................................... 63
4.1.1 Climatic trends in Thai Nguyen province over 35 years (1980-2015) ................................................................. 63
4.1.2 Monsoon season and the potential of maize production under local weather conditions in Thai Nguyen province,
Vietnam ........................................................................................................................................................................ 65
4.1.3 The signs of climate change in Thai Nguyen province, Vietnam ......................................................................... 66
4.2 Local weather condition analysis by AGRICLIM model .................................................................. 76
ix
4.2.1 Historical periods and an overlapping period under climate change scenario ................................................... 76
4.2.1.1. Local weather over the period 1961-2015 ...................................................................................................... 76
4.2.1.2 Climate change and overlapping period 2000-2015 between observed and scenario data ............................ 81
4.2.2 Change of agroclimatic indicators under different climate scenario periods ..................................................... 82
4.2.3 Relation between past climate conditions and maize yields .............................................................................. 88
4.3 Crop model calibration and validation results .............................................................................. 90
4.3.1 DSSAT model calibration ..................................................................................................................................... 90
4.3.2 DSSAT model validation ...................................................................................................................................... 91
4.3.2.1 DSSAT model validation under fixed irrigation ................................................................................................ 92
4.3.2.2 Sensitivity of simulated maize yield ................................................................................................................. 94
4.3.2.3 Potential maize yield in Thai Nguyen ............................................................................................................... 98
4.4 Simulated rainfed maize yields under climate change scenarios ................................................... 99
4.4.1 Winter and spring maize yields for the period 2001-2100 under RCP 4.5 and RCP 8.5 climate change scenarios
(CCSs)............................................................................................................................................................................ 99
4.4.2 Uncertainty analysis and factors influencing maize yield simulation ............................................................... 106
4.4.2.1 The difference of the two applied climate scenarios ..................................................................................... 106
4.4.2.2 The contribution of other factors to maize yields in the study region ........................................................... 107
4.5 Adaptation to climate change impacts on maize production in Vietnam ..................................... 108
V. Conclusions and recommendations ................................................................................. 115
5.1 Conclusions ............................................................................................................................... 115
5.1.1 Evidence of climate change in the study area and its projection in future ........................................................ 115
5.1.2 Perspectives of maize production during the next decades up to 2100 under projected weather conditions .. 115
5.2 Limitation and recommendations .............................................................................................. 116
x
I. INTRODUCTION
1.1 Introduction
1.1.1 Vietnam and its weather system
Vietnam is located in the East of the Indochina
Peninsula with an entire interior area about
329,241 km2. In terms of administrative
subdivisions, Vietnam is divided into 58
provinces and 5 municipalities (Kuntiyawichai
et al., 2015).
Due to the elongated shape from 8oN to 23oN
through 15 latitudes with the coastline about
3,260 km, Vietnam’ climate is generally affected
by the ocean climate system that combined with
the influence of diverse terrains (Nguyen-Tien,
Elliott, & Strobl, 2018).
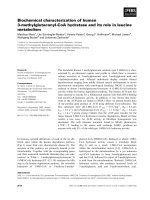
In addition to the difference of horizonal climate
zone, Vietnam' climate can be deivided by Hai
Van Pass at 16oN and listed by 7 sub-regions,
which based on the various patterns of
topography. Their symbols are R1 to R7
(Nguyen & Nguyen 2004), as shown in Fig. 1.
From Hai Van Pass towards the north (R1, R2,
R3, and R4), weather is distinct to four seasons
in a year, including spring (February to April),
summer
(April
to
September),
autumn
(September to October) and winter (November
to February).
Fig. 1. Climatic Sub-regions in Vietnam
(Nguyen & Nguyen 2004)
11
Differently, from Hai Van Pass towards the south (R5, R6, and R7), there are only two main
seasons, which are the dry season (November to April) and the rainy season (May to October)
(Thi-Minh-Ha et al., 2011).
To forecast the weather, Vietnam has a total number of 138 weather stations for 329,241km 2 with
the average density approximately 2385.8 km2 station-1. However, there is a huge disparity of the
weather station density between highland areas and the other areas, which was reported by the
Vietnamese National Weather Service Center in 2014. The averaged density in the highland area
is approximately 2815.8 km2 station-1, and be lower than 430 km2 compared with the national
average density. In comparison with the density which the World Meteorological Organization
(WMO) claimed for a mountainous area, 250-575 km2 per station, the averaged density in the
highland area in Vietnam remains much lower than recommended density (Ecole & Sup, 2014).
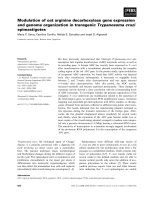
1.1.2 The study area
Thai Nguyen province, the study area, is a mountainous province and locates in the north of
Vietnam (Fig. 2). The province covers an area of 3536.4 km2 with around 1.227 million people,
therein, approximately 65% of habitants living in rural areas (reported by General Statistic Office
of Vietnam, 2016). In terms of administration, Thai Nguyen is divided into 9 sub-divisions which
include 1 capital of the province (namely Thai Nguyen city), 6 districts (namely Dai Tu, Dinh Hoa,
Dong Hy, Phu Binh, Phu Luong, Vo Nhai), 1 town (namely Pho Yen), and 1 provincial city (namely
Song Cong).
Thai Nguyen is considered a capital education for people who are living in the mountainous areas
in the north of Vietnam. The province is also known as an industrial zone because of many
factories and mineral mines. In recent years, Thai Nguyen is famous for its biggest mine, Nui
Phao mining which is known as the world’s largest tungsten (Wolfram, W) mine. The reserve of
the mine was estimated approximately 66 million tons as the report of Masan Resources group in
2012. Besides, Thai Nguyen province is famous for some agricicultural products such as tea, rice
and maize (see Fig. 4a). Thai Nguyen’ green tea products are considered the best tea products in
Vietnam.
Due to the location and stratified by climate conditions, Thai Nguyen province belongs to the region
R2 (see Fig. 1) which has a typical characteristics of the sub-tropical climate. This means Thai
Nguyen' weather is affected by Southwest monsoon compared with the influence of a complex
topographies (Thi-Minh-Ha et al., 2011). The topography is characterized by high hills and
12
moderate mountains in the northern part and the southwest part of the province. In the center and
the southeast regions, the topography is generally considered as the midland region of the
province which is not as high as in the northern regions, where almost all local residents are settled
(Thai Nguyen, 2015).
b)
a)
Fig. 2. Thai Nguyen location and Cau river (Ha Ngoc et al., 2015)
In terms of the hydrological system, Thai Nguyen occupies a part of a river flowing through the
province, namely the Cau river. The river supplies a large amount of irrigation for agriculture by
delivering water into numerous streams and channels for irrigation. However, the huge rainfall
amount in summer still causes flooding and damages to the local agriculture and local
infrastructure, especially in areas which are near the Cau River Basin (Ha Ngoc et al., 2015).
1.1.3 Maize physiology and production
Maize (Zea mays L.), a C4 plant also well-known as corn, is cultivated around the world under a
wide range of climates. Mexico is known as one of the maize origin centers (Mickleburgh & PagánJiménez, 2012).
Maize can grow in the temperate climate and have suitable rates of dry weight and leaf area
accumulation within a range of temperatures between 16 and 28 °C (Hardacre & Turnbull, 1986).
In tropical regions, the optimum leaf appearance temperature and leaf photosynthesis are in the
range of 32 to 35 °C (Kim et al., 2007). Maize, therefore, can grow at higher temperatures in
comparison to the other cereal crops and is therefore suitable for warmer conditions. However,
excessively hot temperature or even moderately cool night temperature can become a limiting
13
factor which impacts on maize growth processes such as photosynthesis. Especially, heat
negatively affects fertility during pollination, with negative consequences for grain yield. The
canopy exchange rate (in line photosynthesis activity) of maize starts to decrease at temperatures
over 35 °C and extremely decreases in the case temperature is more than 38-39 °C (Kim et al.,
2007). Likewise, maize seed emergence is best derived under the ceiling temperature conditions
from 28.9 to 30.0 °C and starts to decrease at 39.1-40 °C (for leaf production), as a result in a
study case in Iran (Edalat & Kazemeini, 2014) while the minimum soil temperature for germination
is from 8-9 °C (European cultivars). Generally, the major impact of warmer temperatures is on the
reproductive stage of development (Hat & Prueger, 2015). However, in some cases, heat stress
does not affect the silking stage, at least in the range of air temperature up to 42.9 °C on the field
and 52.5 °C in the greenhouse (Lizaso et al., 2018) or have no effects on the silking-anthesis
interval (Shim et al., 2017).
In addition to the influence of temperature, water is considered one of the most important elements
which strongly affect maize growth. In theory, the rainfed maize is cultivated successfully in Thai
Nguyen because maize requires 300-700 mm well distributed precipitation during growing period
(depending on yield level, soil and climate conditions) (Eitzinger et al., 2009).
Being the primary feeding source for livestock and poultry production, maize is the second most
important cereal crop in Vietnam. However, caused by typical climate systems and topographic
characteristics, maize is mostly cultivated in the north of Vietnam, sharing 70% of the total maize
area, in which 50% is cultivated in northern Midlands and mountainous areas with two or three
crops per year (USDA, 2012; USDA, 2014; USDA, 2015). In addition, maize is grown under rainfed
conditions or limited irrigated conditions in Vietnam instead of the optimum irrigated conditions.
1.1.4 Types and uses of maize
Maize can be used for a variety of food and industrial products because maize contains
approximately 72% starch, 10% protein and 4% fat (Ranum et al., 2014). The protein quality
(relative content of casein) of a common maize is at 32 %, which is much lower than rice, and
approximately equals to wheat and sorghum with 79.3, 38.7, and 32.5 %, respectively (FAO:
In addition, a yellow-maize contains a high
concentration of pro-vitamin A that can be converted into vitamins by animal tissues. Therefore,
maize is used as human food. Moreover, maize is also used in the pharmaceutical industry and
drink industry. In addition to human food and animal feeding application, maize is used in paper
and textile industries to enhance the strength of papers or warp yarns. That’s why maize currently
14
becomes a very important crop to meet the demand of food, feed, and biofuel. In 2013, maize is
the second of top five crops produced after sugar cane (FAO, 2015).
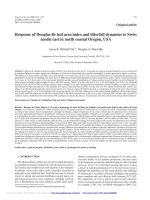
In Vietnam, farmers currently use various maize types and cultivars, comprising different ripening
groups (Fig. 3 a-d). Hybrid maize is usually used for livestock because hybrid maize grains are
typically harder, bigger, and have suitable physical properties in dry milling than the other cultivars’
grains. With the dark yellow kernels, hybrid maize cultivars are easily distinguished with the others
(Fig. 3a).
a) Hybrid maize namely LVN61
b) White sticky maize namely NL556
(Source: />
(Source: />
c) Yellow sweet maize
(Source: />
d) Purple sticky maize
(Source: />
Fig. 3 a-d. Various maize types grown in Vietnam
A hybrid-maize is widely grown with flexible planting dates and different topographies in Thai
Nguyen, Vietnam. Therefore, in comparison with sticky maize, a hybrid-maize has a longer
growing period and more tolerant of drought stresses. Similar to a hybrid-maize, a sweet-maize
has light yellow kernels. Nevertheless, sweet maize kernels are soft and sweet. A sweet-maize is
commonly planted in recent years in local regions, especially in winter season. A white-stickymaize is the local cultivar that is often used for human food. Its physical properties are similar to
sweet maize however, they have different colors and are sticky. A white-sticky-maize is usually
15
grown in the winter season while the purple sticky maize is newly and rarely found in Vietnam. In
the 2010s, Vietnamese scientists and farmers improved various hybrid genotypes with shorter
growing periods than before. Those new genotypes were examined in experiment fields before
transferred to farmers in large scales. Most of the varieties require 117-130 days from sowing to
harvest (Nguyen and Phan, 2010; Tran et al., 2012).
1.1.5 Agriculture and cropping systems in Nguyen province
Within 6 years (2005-2010), agriculture occupied approximately 95% of total gross outputs of
agricultural sectors which involved forestry and fishery sectors in Thai Nguyen province, therein,
the value of cereal crops (rice and maize) was approximately 50% of total output cultivation value
that involved other crop groups such as perennial crops/industrial crops, fruit crops, vegetable
crops (Thai Nguyen, 2010). Meanwhile, the planted maize areas occupy approximately by 20% in
the total planted cereal crop area (Thai Nguyen, 2010).
Farmers mostly bred and used local varieties by themselves in the past. However, in recent
decades, farmers have started using hybrid genotypes instead of local cultivars. The reason is
that the hybrid maize has improved characteristics such as high yield and high content of starch.
However, they have less flavor and too hard for the human diet. Due to the maize varieties, maize
is partly used for human food and mostly used for livestock feed in the local region.
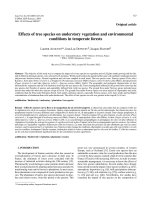
In the hilly area, perennial crops such as tea and cassava (Fig. 4a,b), are usually prior to growing
instead of vegetable crops (Fig. 4d,e) or rice (Fig. 4c) because they require lower investment of
irrigation systems. Therefore, in the highland of the province, maize is a sole crop which mostly
grown under rainfed condition (Fig. 4f). In the flat area, rice, maize, and other vegetable crops are
usually cultivated in 3-seasonal-crop rotations. However, rice is prior to cultivating in summer
which is the rainy season because of a higher market price. Maize is therefore mainly grown at
the other growing seasons which are winter (September or October to next January) and spring
(February to May) with planting dates are set up due to specific weather conditions, field locations,
irrigation conditions, soil conditions, and seasonal cropping systems. Hence, there are various
maize planting dates in the local fields.
16
a) Tea
b) Casava
c) Rice
d) Vegetables
e) Soybean
f)
Maize
Fig. 4. (a-f) Some various crop productions in Thai Nguyen province, Vietnam (Source: photo (ae): Josef Eitzinger et al., 2018; photo (f): Thi Mai Anh Tran, 2016)
17
The planted maize area has been increased over the years. Over 20 years from 1995-2015, the
planted maize area was increased 4 times from 5.2 thousand ha in 1995 to 21.0 thousand ha in
2015. As a consequence, maize production increased significantly from 10.1 thousand tonnes in
1995 to 88.0 thousand tonnes in 2015. In combination with the increase of the planted area, some
other factors such as new varieties, new methodologies, and a higher investment might also
contributed to an increase in maize production as well as an increase in maize yield (Tab. 1)
Table 1. Maize production in Thai Nguyen province, Vietnam
Agro-ecology
1995
2000
2005
2010
2015
Area (thousand ha)
5.2
10.7
15.9
17.9
21.0
Production (thousand tonnes)
10.1
30.8
55.1
75.2
88.0
Yield (kg/ha)
1940
2880
3470
4200
4190
(Data based on )
1.2 Problem statement
Indeed, Vietnam is well-known as one of the abundant biodiversity countries with ideal
opportunities for bio-economic development, particularly the agricultural sector. However,
numerous studies have been determined that Vietnam is one of the most vulnerable countries
regarding climate change and climate variability because Vietnam is currently affected by adverse
impacts of natural hazards such as droughts, floods, typhoons, and heavy rain (IPCC, 2007; FAO,
2014). One of the reasons is that Vietnam is a coastal country to the west of the Pacific Ocean in
the eastern region of Southeast Asia. By a long coastline in the tropical monsoon belt to the east,
Vietnam is therefore extremely affected by intense tropical cyclones.
In average, there are six to eight cyclones, affecting Vietnam every year, as reported by The United
Nations Development Program. Since 1954, Vietnam has witnessed about 212 storms which left
the country enormous damages in terms of population, infrastructure, houses, industrial areas,
and seafood farms. Over the last few decades, the frequency and intensity of tropical cyclones
originating in the Pacific have increased even more than ever (Daidu & Congxian, 2006). Most
tropical cyclones cause strong winds and heavy rains that can drive into secondary hazards such
as floods, typhoons, and salinization in Vietnam. Since 2015, the rising sea level has caused
extreme salinization of coastal aquifers (Briefs & Earth, 2015). From 1985-1989, the number of
typhoons hitting Vietnam was almost half that of the Philippines, but higher than Thailand. These
18
hazards strongly influenced human life in Vietnam, especially farmers’ livelihood who living from
fishery (Kuntiyawichai et al., 2015). In addition to floods and typhoons, the frequency of heavy
rains has been recently also higher than before in most sub-regions of Vietnam. Over the past 50
years, in the south of Vietnam rainfall showed a strong increase from 5 to 20% throughout the year
(Russell, 2011). The number of heavy precipitation above 50 mm with increasing very wet days
was detected to increase at most stations, left the country 4,884 deaths by floods, cost 3.7 million
USD (data based on EM-DAT, 2015; In 2016, heavy rain events were one
of the main causes of extreme urban flooding in Ho Chi Minh city (Nguyen & Thi, 2016).
In contrast, in the north of Vietnam, rainfall decreased by 5 to 10% in wet seasons (Russell, 2011).
This declination of precipitation in the north and the central highlands of Vietnam was recently
detected the main reason of drought in the other studies (Thi-Minh-Ha et al., 2011, Briefs & Earth,
2015, Dijk & Rooij, 2014). Droughts occur in dry seasons while floods occur in rainy seasons.
Moreover, the adverse influence of this prevailing condition is notable to the regions in which high
temperature combined with a long duration under water stress.
Overall, the high temperature is common in summer combined with heavy rain in Vietnam. In
recent years, the maximum temperature has reached nearly 40 °C, which was higher than the
average level over the last decades. Nguyen et al. (2013) indicated that the average of
temperature increased 0.26 °C per decade since the 1970s, possibly related to El Niño -Southern
Oscillation across the country (Nguyen et al., 2014). On the other hand, the temperature increases
not only due to elevated global atmospheric greenhouse gas (GHG) levels but also due to land
use change effects. Indeed, land use change can have strong regional effects on air temperature,
as it was shown that in tropical regions, land use change from forests to agriculture can increase
regional air temperature due to change (Hu et al., 2015). Also increasing urban areas can lead to
regional temperature increase albedo (urban heat island effect) (Zhang & Liang, 2018). In China,
urbanization and other land use changes such as deforestation were found out to contribute to an
increase in the daily mean temperature of 0.12 °C per decade (Jingyong et al., 2005). This finding
was proved by many other studies all over the world. Land use change which drives an increase
in temperature of 0.5 °C and a reduction in rainfall of 0.17 mm/day across the Amazonian regions,
likely figured out by the declination of the extent of Amazon rainforest (Lejeune et al., 2015).
Besides, a dramatic decrease in deforestation during the long period of more than 34 years
correlated significantly to spatial variabilities of the number of rainy days and to increased
temperatures in the Central Rift Valley of Ethiopia (Muluneh et al., 2017). The influence of
prevailing weather conditions has been more or less negatively impacting on agriculture,
19
particularly irrigation in Vietnam (Trinh et al., 2014). Besides, the land area is considered a limiting
factor of food production. Therefore, to increase the total productivity under natural resource
limitations is a extremely challenge (MONRE, 2008).
Under local conditions, soil properties are mostly poor in quality, therefore become a limiting factor
which adversely impacts on agriculture, especially in terms of arable land use. These
characteristics of the soils are obviously found in two main soil types, namely Ferralsol and Acrisol
(Thai Nguyen, 2015). Defined by FAO, Ferralsols having the organic horizons with the thickness
of less than 40 cm is the typical characteristic which formed under free drainage. Its parent
materials can be freely leached out, leading immobilized iron in the oxidized stage, causing the
smallest soil particles with yellowish or reddish colors. The oxidized iron contributes to creating a
well-aerated structure with a number of porosities and most oxic horizons in clay and silt soil,
leading to circulating freely of air and water though Ferralsols. In comparison with other soils,
rainfall is quickly absorbed through Ferralsols soil, being convenient for root systems. However,
rainfall also leaches quite faster to deeper layers as the consequence, leading to the limitation in
fertilizer efficiency application. Therefore, the retention of nutrients to protect soil against losses is
important in using this kind of soil type. Under the local climate conditions characterized by a huge
amount of rain and the sloping topography, most of the soil types are characterized by acid
property with low pH, leading to low organic matter in the north of Vietnam (MONRE, 2008). Similar
to Ferralsols, Acrisols are present in hilly and mountainous areas under the humid climatic
condition. They mostly have a limitation in their structure in the accumulation zone (Quesada et.
al., 2010). Under local conditions, Acrisols are formed under high precipitation, high air humidity,
and hilly topography conditions (Thai Nguyen, 2015).
Generally, arable land area (ALA) in Vietnam was increasing over five decades since 1961. The
process of the ALA changes in Vietnam is shown in Fig. 5 (). In 2015,
the ALA for the agricultural sector was approximately 7 millions square kilometers (m.sq.km),
which was higher than the arable land area in 1961 nearly by 1.5 m.sq.km. However, in the first
30 years of the period, the ALA was not increasing but even decreasing slightly, mainly because
of the expansion of urban areas. Strong increases in the ALA have been recorded in recent years.
In 1990, the ALA was 5.3 m.sq.km, however it only increased by 1 m.sq.km in the short period of
10 years. From 2001 to 2010, the ALA had a slight fluctuation before increased again until 2015.
The number of the increased ALA was mainly caused by deforestation in the mountainous areas
in Vietnam. At present, in term of the economic aspect, the increased arable land area generously
contributed to an increase in the total food production. However, in terms of sustainable
20
development, a decline of the total forest area has caused enormous challenges which are
happening nowadays. For instance, flooding in the mountainous areas occurs more frequently and
intensively in a correlation with numerous different hazards that costed much more than the value
of agriculture that can benefit for residents living there.
Fig. 5. Arable land use area in Vietnam. (Data based on )
Additionally, Vietnam is presently challenging with rapidly increasing population and
environmental pollutions. In 1979, Vietnam’ population was 52.7 million people. Inn 2004, the
population climbed up to 81.6 million people. It is even predicted to reach 122 million in 2050
(MONRE, 2008). The huge size of residents drives the country to the secondary challenges that
are partly related to pollutions and food security. As the report from Vietnam government,
environmental quality, in general, is degrading to pollutions from agriculture which caused by
undisposed wastes and pesticides. These issues even more notable nowadays than ever because
of destroying biodiversity and reducing numbers of individuals, directly damaging many wildlife
habitats, and extremely impact Vietnam socio-economic conditions (MONRE, 2008).
To cope with those challenges as well as to meet the demand of increasing population, Vietnam
government has had various solutions to mitigate these severe effects. One of the major prior
orientations is to increase the production efficiency, especially in the agricultural sector. On the
other hand, farmers, therefore, were forced to change their traditional pathway in agriculture such
as change of crop rotation, and replace wetland rice to maize because of lack of rainfall in dry
21
season in the north of Vietnam. Over the past two decades, the arable land area of rice decreased
by 27% while the total of maize cultivation was nearly triple (Keil et al., 2008). Besides, Vietnamese
farmers currently tend to invest much more for their farms than in the past, especially in terms of
methods and technologies to get higher productivity. However, the local maize production has still
been not able to satisfy the demand in recent years (Dang et al., 2002). The reason may cause
by the unfavorable weather conditions in combination with damages from insects and weeds,
leading to low maize yields. Therefore, calculating and predicting effects of climate change on crop
yields is important for topics ranging from food security to the socio-economic viability of the
province.
1.3 Research questions
* How was the trend of climate in the last three decades in Thai Nguyen province, the mountainous
area in the north of Vietnam?
* Did historical climate conditions have a positive impact on maize production over the past 30
years in the study area?
* Will climate conditions be more severe in the future than in the past? How will it impact maize
production and what will be suitable adaptation options?
1.4 Research Objectives
To analyze how climate change impacts on maize production in Thai Nguyen province, Vietnam,
three specific objectives are set:
(1) Analyze changing climate variability by statistical (indicator based) model AGRICLIM under
current and future climate conditions (climate scenarios) in the case of the study area.
(2) Apply CERES-Maize model to simulate and analyze crop growth and yields as well as main
growth limiting factors (nitrogen and water balance) under the different climatic scenarios, soil,
genetic and management conditions.
(3) Analyze the potential of maize production under climate change scenarios within 100 years
(2001 – 2100) and develop recommendations for adaptation options in crop management.
22
II. LITERATURE REVIEW
“Weather”, the short term variability of weather parameters, is commonly mentioned in human
daily life to describe the actual states of the atmosphere, while “climate” in a narrow sense is
usually defined as the “average weather” over a range of years (ideally a predefined 30-year period
for
allowing
comparisons
between
sites)
(Source:
In some regions, the weather is
more or less homogeneous during the day and only exposes the difference every half of the year
such as regions surround Earth' Poles. However, in most other regions on the Earth, it is visible
to see the difference of weather every day caused by the appearance of sunlight during the day.
Besides, there is the difference between day and night. For instance, the weather may be warmer
during the day but cooler than that during the night. In addition, to present the periodic changes
such as El Niño, La Niña, climate variability is defined as a short-term fluctuation on the seasonal
or multi-seasonal scale. The time duration could be months to decades. To express the variation
of climate in a longer duration, from decades to millennia, it is defined as climate change.
2.1 Dry and rainy seasons
2.1.1 Monsoon and its effect in East Asian countries
Summer monsoon affects East Asia including China, Japan, Korea, Indo-China peninsula
(including Vietnam), and Philippines (Wang et al., 2013). The onset of summer monsoon happens
in late May or June and ends in September every year (Cruz et al., 2013). In addition, some other
Asian countries which are located in southeast Asia including East India, South China, Myanmar,
Thailand, Vietnam, Laos, Kampuchea, Malaysia, Singapore, Indonesia, Borneo, Philippines
islands, Portuguese, Timor and western New Guinea are not only affected by summer monsoon
regime but are also affected by winter monsoon regime, which are namely the northeast monsoon
and southwest monsoon, respectively. The northeast (summer) monsoon usually starts from late
May and ends in September while the southwest (winter) monsoon usually starts from November
and ends in March (Loo et al., 2015). Monsoon bring needed moisture by rainfall for agriculture,
forests and habitants of the regions.
On the other hand, monsoons have some potential to cause extreme weather phenomenon,
driving to secondary hazards such as flooding and soil erosion. China is affected strongly by the
East Asian monsoon which brings disasters such as droughts, floods, and cold surges which
23
adversely impacts on local life. Those disasters lead to the damages and losses of domestic
products (Xue et al., 2015). Likewise, the summer monsoon brings heavy rain in summer with
extreme daily rainfall events in India (May, 2004). However, in contrast to the state of monsoon in
China and India, southwest (winter) monsoon over the western Philippines showed a enormous
decrease in total amount of rainfall in most stations over the past 50 years, resulting in a decrease
of the number of days without rainfall (Cruz et al., 2013). In addition, few studies detected a
decrease of precipitation during winter monsoon season. However, in most cases, a regional
precipitation increase is more common than a decrease. In addition to an increase in the average
amount of precipitation, an increased trend of rainfall variability which affected by summer
monsoon is also revealed in southeast Asia (IPCC, 2001b, IPCC, 2007).
2.1.2 Monsoon and its effect in Vietnam
Vietnam lies in the tropical climate zone with two main monsoon circulation systems which are the
winter monsoon and the summer monsoon. They are also known as North Asian monsoon and
South Asian monsoon. However, South Asian monsoon has stronger influence on Vietnam'
climate than North Asian monsoon (Nguyen et al., 2014).
The onset of the winter monsoon is usually from August-September to December-January in the
southern north and the center of Vietnam, meanwhile, the onset of the summer monsoon is from
April-May to September-October. In Vietnam, the summer monsoon brings rainfall to most of
regions. The appearance of the summer monsoon is notably in the upper northern regions of
Vietnam including R1, R2, and R3 (see Fig. 1). However, there is not a clear difference between
the dry season and rainy season in the north of Vietnam because there is no notable reversal of
prevailing winds but light rains by the end of the dry season (April-May) (ISPONRE, 2009).
Downwards to the south of Vietnam, the combination of two monsoon regimes drives to rainy
season appearing in the late period of years, however, affected remarkably by summer monsoon.
The summer monsoon is characterized by the deep moist convection and the change in direction
of prevailing winds. The signal of the summer monsoon onset was defined therefore by the change
of prevailing winds (Pham et al., 2010). Flooding is considered the consequence of monsoon
dynamics over the country.
2.1.3 Pacific El Nino Southern Oscillation (ENSO)
During El-Nino years, a drier and warmer were reported to show an association with the interannual variations in southeast Asia (GFDRR, 2011). Nguyen et al. (2014) carried out a study which
24
used weather data from 40 weather stations in Vietnam to indicate that averaged temperature in
Vietnam had increased a range of 0.26 per decade since the 1970s, possibly related to El- NinoSouthern Oscillation across the country (Nguyen et al., 2014), shown in Fig. 6. The frequency of
El-Nino was projected to increase in central equatorial Pacific, leading to increasing of Pacific El
Nino Southern Oscillation (ENSO) related precipitation (Tran Thuc, 2013).
Fig. 6. Variation of observed annual average temperature anomaly (Celsius degree) (Nguyen et
al., 2014)
2.2 Climate change and climate variability
Climate change and climate variability are more and more notably nowadays. Their states are
mainly presented via global warming which is commonly known as the main consequence of
climate change. Global warming refers to the gradual increase of observed or projected global
surface temperature. Evidence of climate change and its impacts on natural systems have been
proved by a huge number of studies (IPCC, 1993; IPCC, 2007; IPCC, 2013). Climate change is
also widely projected for most regions on the Earth (Houghton et al., 1995; Metz & Davidson,
2007; F.Stocker et al., 2013).
Since the first assessment report of the Intergovernmental Panel on Climate Change (IPCC, 1993)
which was completed in August 1990, the proofs of climate change has been more clearly in the
other continuous IPCC reports (Houghton et al., 1995; Metz & Davidson, 2007; F.Stocker et al.,
2013). Besides, climate change has been documented over 30 years in plenty regions in Africa
25