CHƯƠNG TRÌNH TỐI ƯU HÓA SINH LÍ SỬ DỤNG SVV & SI
Bạn đang xem bản rút gọn của tài liệu. Xem và tải ngay bản đầy đủ của tài liệu tại đây (4.27 MB, 41 trang )
<span class='text_page_counter'>(1)</span><div class='page_container' data-page=1>
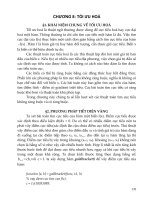
PHYSIOLOGIC OPTIMIZATION
PROGRAM USING SVV & SI
<b>Yes</b> <b>No</b>
<b>Fluid Infusion</b>
<b>1 liter NS</b> <b>SI >Normal</b> <b>SI Low</b> <b>SI High</b>
<b>Pressor</b> <b>Inotrope/</b>
<b>Vasodilator</b> <b>Diuretic</b>
<b>Volume Responsive: SVV>13%</b>
<b>1</b> <b>2</b> <b>3</b>
</div>
<span class='text_page_counter'>(2)</span><div class='page_container' data-page=2>
<i><b>Fluid therapy!!</b></i>
</div>
<span class='text_page_counter'>(3)</span><div class='page_container' data-page=3>
<b>The Volume prescription Rx for the </b>
<b>Critically Ill and Injured</b>
<b>William T. McGee, M.D., M.H.A. </b>
<b>FCCM, FCCP</b>
Intensivist
Baystate Medical Center, Springfield, MA
Associate Professor of Medicine and Surgery
</div>
<span class='text_page_counter'>(4)</span><div class='page_container' data-page=4>
<b>Relevant Disclosures</b>
Edwards Lifesciences
FloTrac/Vigileo/EV1000/ Clear
Sight
My cases; POPtm (free)
PICCO
LIDCO
Echo
Esophageal Doppler
Respirophasic change in SV
(SVV)
</div>
<span class='text_page_counter'>(5)</span><div class='page_container' data-page=5></div>
<span class='text_page_counter'>(6)</span><div class='page_container' data-page=6>
What I won’t be able to do in
</div>
<span class='text_page_counter'>(7)</span><div class='page_container' data-page=7>
<b>Hospital mortality according to whether or not </b>
<b>patients achieved AIFR, CLFM, both, or neither.</b>
Murphy C V et al. Chest 2009;136:102-109
©2009 by American College of Chest
Physicians
intensivist
surgeon
cardiologist
Fool guessing!
</div>
<span class='text_page_counter'>(8)</span><div class='page_container' data-page=8>
<b>Goals:</b>
1. Volume management is the most
important part of care of the critically ill
(<i><b>volume management is important )</b></i>
2. POP provides a simple physiology based
way to accomplish it
3. Physiology based care is important in the
ICU
</div>
<span class='text_page_counter'>(9)</span><div class='page_container' data-page=9>
A critique of fluid bolus
resuscitation in
severe sepsis
Andrew K. Hilton & Rinaldo Bellomo
<i>Critical Care </i>2012, 16:302
<b>BAD Fluids! </b>
</div>
<span class='text_page_counter'>(10)</span><div class='page_container' data-page=10></div>
<span class='text_page_counter'>(11)</span><div class='page_container' data-page=11>
•The Question we ask on rounds every
day….
•Do we want to give more IVF?!?!?!?!?
•Is the patient fluid responsive?!?!?!?!?
Fundamentally, will fluid increase the
patient’s stroke volume and therefore
increase oxygen delivery?
</div>
<span class='text_page_counter'>(12)</span><div class='page_container' data-page=12>
Fluid ?
Pressor ?
Diuretic ?
</div>
<span class='text_page_counter'>(13)</span><div class='page_container' data-page=13>
<b>DO</b>
<b><sub>2</sub></b><b>= CO (CaO</b>
<b><sub>2</sub></b><b>)</b>
<b>CaO</b>
<b><sub>2</sub></b><b>= Hb (1.36 ccO</b>
<b><sub>2</sub></b><b>/gm) </b>
</div>
<span class='text_page_counter'>(14)</span><div class='page_container' data-page=14>
<b>What percentage of ICU </b>
<b>patients are volume depleted </b>
<b>after 24hours?</b>
1. Almost 0%
2. 25%
3. 50%
4. 75%
</div>
<span class='text_page_counter'>(15)</span><div class='page_container' data-page=15>
<b>Volume therapy critical care </b>
<b>perspective: 1 question</b>
What is the impact on cardiac performance?
Requires a cardiac performance measure!
Ultimately
<b>DO</b>
<b><sub>2</sub></b> is what we can controlregarding Organ perfusion and function.
Answer: <b>Physiologic Optimization Program</b>
</div>
<span class='text_page_counter'>(16)</span><div class='page_container' data-page=16>
<b>Is Volume Management </b>
<b>Important?</b>
</div>
<span class='text_page_counter'>(17)</span><div class='page_container' data-page=17></div>
<span class='text_page_counter'>(18)</span><div class='page_container' data-page=18></div>
<span class='text_page_counter'>(19)</span><div class='page_container' data-page=19>
<b>Volume Status</b>
<b>Morbidity</b>
<b>/Mort</b>
<b>alit</b>
<b>y</b>
<b>Under</b> <b>Perfect</b> <b>Over</b>
<b>Relationship of Morbidity/Mortality </b>
<b>to Volume Status </b>
<b>for High-Risk Patients</b>
</div>
<span class='text_page_counter'>(20)</span><div class='page_container' data-page=20>
Relationship of Morbidity/Mortality to
Volume Status for High-Risk Patients
<b>30%</b>
<b>0%</b>
<b>Fluid Loading</b>
<b>B</b>
<b>Hypovolemia</b>
<b>Euvolemia</b>
<b>A</b> <b><sub>C</sub></b>
<b>Hypervolemia</b>
<b>D</b>
<b>SV</b>
<b>EDV</b>
<b>A</b>
<b>B</b>
<b>C</b>
<b>Per</b>
<b>io</b>
<b>p</b>
<b>er</b>
<b>ati</b>
<b>v</b>
<b>e </b>
<b>M</b>
<b>o</b>
<b>rb</b>
<b>id</b>
<b>it</b>
<b>y</b>
<b> R</b>
<b>isk</b>
<b>50%</b>
<b>10%</b>
<b>A</b> <b>C</b>
<b>B</b>
<b>Hypovolemia</b>
<b>Euvolemia</b>
<b>Hypervolemia</b>
<b>Fluid Loading</b>
<b>IC</b>
<b>U</b>
<b> M</b>
<b>o</b>
<b>rtal</b>
<b>it</b>
<b>y</b>
<b> R</b>
<b>isk</b>
<b>D</b>
</div>
<span class='text_page_counter'>(21)</span><div class='page_container' data-page=21>
<b>Functional Hemodynamics</b>
The Study and use of the cardiopulmonary
interaction to assess physiology Dynamic
measures of volume responsiveness Stroke
Volume Variation SVV and Pulse Pressure
Variation PPV
</div>
<span class='text_page_counter'>(22)</span><div class='page_container' data-page=22>
<b>Physiologic Basis of </b>
</div>
<span class='text_page_counter'>(23)</span><div class='page_container' data-page=23>
Ancient Chinese physicians
would assess a patient's pulse
for hours at a time to establish a
diagnosis. (<i>Pulsologists</i>) <b>2500 </b>
<b>BC</b>
<i><b>Muo Ching</b></i>
Described, differentiated and
diagnosed pulses in 10
volumes of books.
They could recognize more
than 200 different variations of
pulse based on volume,
strength, and regularity.
</div>
<span class='text_page_counter'>(24)</span><div class='page_container' data-page=24>
<b>Definitions</b>
<b>SV/SI Stroke Volume/Stroke </b>
<b>Index: cardiac performance </b>
<b>measure</b>
<b>SVV Stroke Volume Variation: </b>
<b>volume responsiveness </b>
</div>
<span class='text_page_counter'>(25)</span><div class='page_container' data-page=25>
<b>Mechanism of SVV</b>
Time
Airw
ay
Pres
s
ure
Ar
ter
ial
Pr
es
s
ur
e
Positive Pressure Breath
↑ Intrathoracic pressure
<b>↑</b> RV afterload
<b>↓</b> RV Preload
Empty Pulmonary System
<b>Delayed ↓↓ SV</b>
<b>Acute</b> <b>↑ SV</b>
↑ LV Preload
McGee, WT;J Int. Care Med 2009; 24(6) p352
</div>
<span class='text_page_counter'>(26)</span><div class='page_container' data-page=26>
<b>The increase of preload volume is equal: ∆ EDV<sub>1</sub></b> <b>= ∆ EDV<sub>2</sub></b>
<b>starting point is not </b> <b>∆ SV<sub>1</sub></b> <b>>> ∆ SV<sub>2</sub></b>
<b>∆ SV (SVV) Starling Relationship: </b>
<b>Respiratory Variation in SV at Different </b>
<b>Preloads </b>
<b>EDV</b>
<b>SV</b>
<b>small variation</b>
<b>large variation</b>
<b>∆ EDV<sub>1</sub></b> <b>∆ EDV<sub>2</sub></b>
<b>∆ SV<sub>1</sub></b>
<b>∆ SV<sub>2</sub></b>
<b>∆ EDV (preload) caused by mechanical ventilation </b>
</div>
<span class='text_page_counter'>(27)</span><div class='page_container' data-page=27>
<b>SV – SVV Mirrors Frank-Starling EDV – SV Relationship</b>
<b>Preload Increases from A to B</b>
60
65
70
75
80
85
90
95
100
105
140 160 180 200 220 240 260
<b>EDV, (ml)</b>
<b>S</b>
<b>V</b>
<b>, </b>
<b>(m</b>
<b>l)</b>
60
65
70
75
80
85
90
95
100
105
0 5 10 15 20 25 30 35 40 45
<b>SVV, (%)</b>
<b>S</b>
<b>V</b>
<b>, </b>
<b>(m</b>
<b>l)</b>
<b>F-S relationship requires development; SV- SVV </b><i><b>allows </b></i>
<i><b>prediction</b></i> <b>about preload dependent cardiac performance </b>
<b>A</b> <b>A</b>
<b>B</b> <b>B</b>
<b>McGee,Hatib CCM 2007;34</b>
<b>SVV high</b>
</div>
<span class='text_page_counter'>(28)</span><div class='page_container' data-page=28>
SV
More variability
SVV high
Preload
<i><b>Sweet spot Goal </b></i>
Less variability
SVV low
SV/SVV pairs determine an individual’s position on
their Starling Curve
Sweet spot: max benefit from preload s volume
overload!
Provides a Goal for volume therapy.
A
</div>
<span class='text_page_counter'>(29)</span><div class='page_container' data-page=29>
For patients clinically diagnosed with
ARDS/ALI, what percentage have
hydrostatic; PCWP, pulmonary edema as
a contributing factor to their chest x-ray
picture and A-a gradient (oxygenation
defect)?
</div>
<span class='text_page_counter'>(30)</span><div class='page_container' data-page=30>
<b>Distribution of Pulmonary-Artery–Occlusion Pressure (Panel A) and Central </b>
<b>Venous Pressure (Panel B) before Receipt of the First Protocol-Mandated </b>
<b>Instruction on Fluid Management.</b>
<b>The National Heart, Lung, and Blood Institute Acute Respiratory Distress </b>
<b>Syndrome (ARDS) Clinical Trials Network. N Engl J Med 2006;354:2213-2224.</b>
<b>Many had hydrostatic pulmonary edema (30%)</b>
<b>Likely preventable; CI≥nl 97%</b>
</div>
<span class='text_page_counter'>(31)</span><div class='page_container' data-page=31>
<b>POP: Goals vs.</b>
<b>No Goals (Chaos)</b>
● Simulation/<i>standardization</i>
</div>
<span class='text_page_counter'>(32)</span><div class='page_container' data-page=32>
<b>PHYSIOLOGIC OPTIMIZATION </b>
<b>PROGRAM USING SVV & SV</b>
<b>Yes</b> <b>No</b>
<b>Fluid Infusion</b>
<b>1 liter NS</b> <b>SV Normal</b> <b>SV Low</b> <b>SV High</b>
<b>Pressor</b> <b>Inotrope/</b>
<b>Vasodilator</b> <b>Diuretic</b>
<b>Volume Responsive: SVV>10-15%</b>
<b>1</b> <b>2</b> <b>3</b>
</div>
<span class='text_page_counter'>(33)</span><div class='page_container' data-page=33>
<b>Goals</b>
Optimize perfusion and DO2
How:
<b>1)Give volume until CO/SV </b>
<b>target/maximized (no increase)</b>
<b>2)Stop when SVV is low < 10-15% (13%)</b>
</div>
<span class='text_page_counter'>(34)</span><div class='page_container' data-page=34>
SI Normal: <b>Pressor</b>
Vasodilation, severe sepsis or septic shock
SI Low: <b>Inotrope/Vasodilator</b>
Low output state Echo?
SI High: <b>Diuretic</b>
Acute lung injury, ARDS, or previous massive
resuscitation (wet lungs)
<b>The clinical impression of non-volume </b>
<b>responsive patients along with the </b>
<b>stroke index directs therapy. </b>
<b>1</b>
<b>2</b>
<b>3</b>
<b>P</b>
<b>A</b>
<b>T</b>
<b>H</b>
<b>W</b>
<b>A</b>
<b>Y</b>
<b>S</b>
<b>Non-volume responsive (SVV≤13%)</b>
</div>
<span class='text_page_counter'>(35)</span><div class='page_container' data-page=35>
<b>When SVV doesn’t help</b>
● Irregular Rhythm
● Spontaneous Breathing
● Insufficient Pleural Pressure Change
● Tachycardia >135
</div>
<span class='text_page_counter'>(36)</span><div class='page_container' data-page=36>
When SVV is not useful
Cardiac performance SV/CO
<b>∆ CO/SV</b>
SVV provides additional
information about volume
</div>
<span class='text_page_counter'>(37)</span><div class='page_container' data-page=37>
<b>Give Fluids Assess Change in </b>
<b>CO/SV & DO</b>
<b><sub>2</sub></b>May be problematic:
Renal Failure
</div>
<span class='text_page_counter'>(38)</span><div class='page_container' data-page=38>
Passive leg-raising test consists of measuring
the hemodynamic effects: ΔSV/CO of a leg
elevation up to 45o
<b>45o</b>
<i><b>Semirecumbent position</b></i> <i><b>Passive leg raising</b></i>
<b>Responders get fluid</b>
<b>Non responders don’t! Improvement in SV requires </b>
<b>other therapy </b>
Teboul J-L and Monnet X. Prediction of volume responsiveness in critically ill patients
with spontaneous breathing activity. Curr Opin Crit Care. 2008:14(3);337
</div>
<span class='text_page_counter'>(39)</span><div class='page_container' data-page=39>
Assessing DO2 adequacy
Clinical question?
O2 Extraction
<i>No data exists that I am aware of that improving</i>
<i>DO2 is useful</i>
</div>
<span class='text_page_counter'>(40)</span><div class='page_container' data-page=40>
Goals
• SV cardiac performance measure: DO2
Individually assessed “adequate” baseline (OR)
or normal
• SVV volume responsiveness; α slope of F-S
Curve: if actively giving fluids goal
</div>
<span class='text_page_counter'>(41)</span><div class='page_container' data-page=41>
CONCLUSION 2017 SVV/SV
<b>Starling-ize our patients </b> <b>POP GDT</b>
<b>Optimization of volume therapy saves lives!</b>
<b>Manage volume therapy using physiology in </b>
<b>both directions</b>
<b>SV</b>
<b>More variability </b>
<b>SVV is high</b>
<b>Less variability </b>
<b>SVV is low </b>
<b>Preload</b>
Sweet spot
GDT
No DO2 change
</div>
<!--links-->