A Stata package for the estimation of the dose–response function through adjustment for the generalized propensity score.
Bạn đang xem bản rút gọn của tài liệu. Xem và tải ngay bản đầy đủ của tài liệu tại đây (301.43 KB, 22 trang )
<span class='text_page_counter'>(1)</span><div class='page_container' data-page=1>
The Stata Journal
<b>Editor</b>
H. Joseph Newton
Department of Statistics
Texas A&M University
College Station, Texas 77843
979-845-8817; fax 979-845-6077
<b>Editor</b>
Nicholas J. Cox
Department of Geography
Durham University
South Road
Durham City DH1 3LE UK
<b>Associate Editors</b>
Christopher F. Baum
Boston College
Nathaniel Beck
New York University
Rino Bellocco
Karolinska Institutet, Sweden, and
Univ. degli Studi di Milano-Bicocca, Italy
Maarten L. Buis
Vrije Universiteit, Amsterdam
A. Colin Cameron
University of California–Davis
Mario A. Cleves
Univ. of Arkansas for Medical Sciences
William D. Dupont
Vanderbilt University
David Epstein
Columbia University
Allan Gregory
Queens University
James Hardin
University of South Carolina
Ben Jann
ETHZăurich, Switzerland
Stephen Jenkins
University of Essex
Ulrich Kohler
WZB, Berlin
Frauke Kreuter
University of Maryland–College Park
Jens Lauritsen
Odense University Hospital
Stanley Lemeshow
Ohio State University
J. Scott Long
Indiana University
Thomas Lumley
University of Washington–Seattle
Roger Newson
Imperial College, London
Austin Nichols
Urban Institute, WashingtonDC
Marcello Pagano
Harvard School of Public Health
Sophia Rabe-Hesketh
University of California–Berkeley
J. Patrick Royston
MRCClinical Trials Unit, London
Philip Ryan
University of Adelaide
Mark E. Schaffer
Heriot-Watt University, Edinburgh
Jeroen Weesie
Utrecht University
Nicholas J. G. Winter
University of Virginia
Jeffrey Wooldridge
Michigan State University
<b>Stata Press Editorial Manager</b>
<b>Stata Press Copy Editors</b>
Lisa Gilmore
</div>
<span class='text_page_counter'>(2)</span><div class='page_container' data-page=2>
regular columns, book reviews, and other material of interest to Stata users. Examples
of the types of papers include 1) expository papers that link the use of Stata commands
or programs to associated principles, such as those that will serve as tutorials for users
first encountering a new field of statistics or a major new technique; 2) papers that go
“beyond the Stata manual” in explaining key features or uses of Stata that are of interest
to intermediate or advanced users of Stata; 3) papers that discuss new commands or
Stata programs of interest either to a wide spectrum of users (e.g., in data management
or graphics) or to some large segment of Stata users (e.g., in survey statistics, survival
analysis, panel analysis, or limited dependent variable modeling); 4) papers analyzing
the statistical properties of new or existing estimators and tests in Stata; 5) papers
that could be of interest or usefulness to researchers, especially in fields that are of
practical importance but are not often included in texts or other journals, such as the
use of Stata in managing datasets, especially large datasets, with advice from hard-won
experience; and 6) papers of interest to those who teach, including Stata with topics
such as extended examples of techniques and interpretation of results, simulations of
statistical concepts, and overviews of subject areas.
For more information on the<i>Stata Journal</i>, including information for authors, see the
web page
The<i>Stata Journal</i>is indexed and abstracted in the following:
<i>•</i> Science Citation Index Expanded (also known as SciSearch<i></i>R<sub>)</sub>
<i>•</i> CompuMath Citation Index<i></i>R
<b>Copyright Statement:</b>The<i>Stata Journal</i>and the contents of the supporting files (programs, datasets, and
help files) are copyright c<i></i>by StataCorp LP. The contents of the supporting files (programs, datasets, and
help files) may be copied or reproduced by any means whatsoever, in whole or in part, as long as any copy
or reproduction includes attribution to both (1) the author and (2) the<i>Stata Journal</i>.
The articles appearing in the<i>Stata Journal</i>may be copied or reproduced as printed copies, in whole or in part,
as long as any copy or reproduction includes attribution to both (1) the author and (2) the<i>Stata Journal</i>.
Written permission must be obtained from StataCorp if you wish to make electronic copies of the insertions.
This precludes placing electronic copies of the<i>Stata Journal</i>, in whole or in part, on publicly accessible web
sites, fileservers, or other locations where the copy may be accessed by anyone other than the subscriber.
Users of any of the software, ideas, data, or other materials published in the<i>Stata Journal</i>or the supporting
files understand that such use is made without warranty of any kind, by either the<i>Stata Journal</i>, the author,
or StataCorp. In particular, there is no warranty of fitness of purpose or merchantability, nor for special,
incidental, or consequential damages such as loss of profits. The purpose of the<i>Stata Journal</i>is to promote
free communication among Stata users.
</div>
<span class='text_page_counter'>(3)</span><div class='page_container' data-page=3>
<b>8</b>, Number 3, pp. 354–373
<b>A Stata package for the estimation of the</b>
<b>dose–response function through adjustment for</b>
<b>the generalized propensity score</b>
Michela Bia
Laboratorio Riccardo Revelli
Centre for Employment Studies
Collegio Carlo Alberto
Moncalieri, Italy
Alessandra Mattei
Department of Statistics
University of Florence
Florence, Italy
fi.it
<b>Abstract.</b> In this article, we briefly review the role of the propensity score in
estimating dose–response functions as described inHirano and Imbens(2004,<i></i>
<i>Ap-plied Bayesian Modeling and Causal Inference from Incomplete-Data Perspectives</i>,
73–84). Then we present a set of Stata programs that estimate the propensity
score in a setting with a continuous treatment, test the balancing property of the
generalized propensity score, and estimate the dose–response function. We
illus-trate these programs by using a dataset collected byImbens, Rubin, and Sacerdote
(2001,<i>American Economic Review</i>91: 778–794).
<b>Keywords:</b>st0150, gpscore, doseresponse, doseresponse model, bias removal, dose–
response function, generalized propensity score, weak unconfoundedness
<b>1</b>
<b>Introduction</b>
Much of the work on propensity-score analysis has focused on cases where the
treat-ment is binary. Matching estimators for causal effects of a binary treattreat-ment based on
propensity scores have also been implemented in Stata (e.g.,Becker and Ichino [2002]
and Leuven and Sianesi[2003]).
In many observational studies, the treatment may not be binary or even categorical.
In such a case, one may be interested in estimating the dose–response function where
the treatment might take on a continuum of values. For example, in economics, an
important quantity of interest is the effect of aid to firms (e.g.,Bia and Mattei[2007]).
In socioeconomic studies, one may be interested in the effect of the amount of a lottery
prize on subsequent labor earnings (e.g.,Hirano and Imbens[2004]).
Hirano and Imbens(2004) developed an extension to the propensity-score method
in a setting with a continuous treatment. FollowingRosenbaum and Rubin(1983) and
most of the literature on propensity-score analysis, they make an unconfoundedness
assumption, which allows them to remove all biases in comparisons by treatment status
by adjusting for differences in a set of covariates. Then they define a generalization of the
propensity score for the binary case—henceforth labeled generalized propensity score
(GPS)—which has many of the attractive properties of the binary-treatment propensity
score.
c
</div>
<span class='text_page_counter'>(4)</span><div class='page_container' data-page=4>
In this article, we briefly review the method developed byHirano and Imbens(2004),
and we provide a set of Stata programs that estimate theGPS, assess the adequacy of
the underlying assumptions on the distribution of the treatment variable, test whether
the estimated GPS satisfies the balancing property, and estimate the dose–response
function. FollowingHirano and Imbens(2004), our Stata programs address the problem
of estimation and inference by using parametric models.
We illustrate these programs with a dataset collected from Imbens, Rubin, and
Sac-erdote (2001). The population consists of individuals who won the Megabucks lottery
in Massachusetts in the mid-1980s. We apply our programs to estimate the average
po-tential post-winning labor earnings for each level of the lottery prize (the dose–response
function). Although the assignment of the prize is obviously random, substantial item
and unit nonresponse led to a selected sample where the amount of the prize is no
longer independent of background characteristics. In using these programs, remember
that they only allow you to reduce, not to eliminate, the bias generated by unobservable
confounding factors. As in the binary-treatment case, the extent to which this bias is
reduced depends crucially on the richness and quality of the control variables, on which
theGPSis computed.
<b>2</b>
<b>The propensity score with continuous treatments</b>
Suppose we have a random sample of size<i>N</i> from a large population. For each unit<i>i</i>
in the sample, we observe a<i>p×</i>1 vector of pretreatment covariates, <i>Xi</i>; the treatment
received,<i>Ti</i>; and the value of the outcome variable associated with this treatment, <i>Yi</i>.
Using the Rubin causal model (Holland 1986) as a framework for causal inference, we
define a set of potential outcomes, <i>{Y<sub>i</sub></i>(<i>t</i>)<i>}<sub>t</sub><sub>∈T</sub></i>, <i>i</i> = 1<i>, . . . , N</i>, where <i>T</i> is a continuous
set of potential treatment values, and<i>Y<sub>i</sub></i>(<i>t</i>) is a random variable that maps a
particu-lar potential treatment, <i>t</i>, to a potential outcome. Hirano and Imbens(2004) refer to
<i>{Y<sub>i</sub></i>(<i>t</i>)<i>}<sub>t</sub><sub>∈T</sub></i> as the unit-level dose–response function. We are interested in the average
dose–response function, <i>μ</i>(<i>t</i>) =<i>E{Y<sub>i</sub></i>(<i>t</i>)<i>}</i>. FollowingHirano and Imbens(2004), we
as-sume that<i>{Y<sub>i</sub></i>(<i>t</i>)<i>}<sub>t</sub><sub>∈T</sub></i>, <i>T<sub>i</sub></i>, and<i>X<sub>i</sub></i>, <i>i</i>= 1<i>, . . . , N</i>, are defined on a common probability
space; that <i>Ti</i> is continuously distributed with respect to the Lebesgue measure on<i>T</i>;
and that <i>Yi</i> = <i>Yi</i>(<i>Ti</i>) is a well-defined random variable. To simplify the notation, we
will drop the<i>i</i> subscript in the sequel.
The propensity function is defined byHirano and Imbens(2004) as the conditional
density of the actual treatment given the observed covariates.
<b>Definition 2.1</b> (GPS) Let<i>r</i>(<i>t</i>,<i>x</i>) be the conditional density of the treatment given the
covariates:
</div>
<span class='text_page_counter'>(5)</span><div class='page_container' data-page=5>
TheGPShas a balancing property similar to that of the standard propensity score;
that is, within strata with the same value of<i>r</i>(<i>t, x</i>), the probability that<i>T</i> =<i>t</i>does not
depend on the value of<i>X</i>:
<i>X⊥I</i>(<i>T</i> =<i>t</i>)<i>|r</i>(<i>t, x</i>)
where<i>I</i>(<i>·</i>) is the indicator function. Hirano and Imbens(2004) show that, in
combina-tion with a suitable unconfoundedness assumpcombina-tion, this balancing property implies that
assignment to treatment is unconfounded, given theGPS.
<b>Theorem 2.1</b> (Weak unconfoundedness given the GPS) Suppose that assignment to
the treatment is weakly unconfounded, given pretreatment variables<i>X</i>:
<i>Y</i>(<i>t</i>)<i>⊥T|X</i> for all<i>t∈ T</i>
Then, for every<i>t</i>,
<i>fT{t|r</i>(<i>t, X</i>)<i>, Y</i>(<i>t</i>)<i>}</i>=<i>fT{t|r</i>(<i>t, X</i>)<i>}</i>
Using this theorem, Hirano and Imbens(2004) show that the GPS can be used to
eliminate any biases associated with differences in the covariates.
<b>Theorem 2.2</b> (Bias removal with GPS) Suppose that assignment to the treatment is
weakly unconfounded, given pretreatment variables<i>X</i>. Then
<i>β</i>(<i>t, r</i>) =<i>E{Y</i>(<i>t</i>)<i>|r</i>(<i>t, X</i>) =<i>r}</i>=<i>E</i>(<i>Y</i> <i>|T</i>=<i>t, R</i>=<i>r</i>)
and
<i>μ</i>(<i>t</i>) =<i>E</i>[<i>β{t, r</i>(<i>t, X</i>)<i>}</i>]
<b>3</b>
<b>Estimation and inference</b>
The implementation of the GPSmethod consists of three steps. In the first step, we
estimate the score<i>r</i>(<i>t, x</i>). In the second step, we estimate the conditional expectation of
the outcome as a function of two scalar variables, the treatment level<i>T</i> and theGPS<i>R</i>:
<i>β</i>(<i>t, r</i>) =<i>E</i>(<i>Y|T</i> =<i>t, R</i>=<i>r</i>). In the third step, we estimate the dose–response function,
<i>μ</i>(<i>t</i>) = <i>E</i>[<i>β{t, r</i>(<i>t, X</i>)<i>}</i>], <i>t</i> <i>∈ T</i>, by averaging the estimated conditional expectation,
</div>
<span class='text_page_counter'>(6)</span><div class='page_container' data-page=6>
<b>3.1</b>
<b>Modeling the conditional distribution of the treatment given the</b>
<b>covariates</b>
The first step is to estimate the conditional distribution of the treatment given the
covariates. We assume that the treatment (or its transformation) has a normal
distri-bution conditional on the covariates:
<i>g</i>(<i>Ti</i>)<i>|Xi</i> <i>∼N</i>
<i>h</i>(<i>γ, Xi</i>)<i>, σ</i>2
(1)
where <i>g</i>(<i>T<sub>i</sub></i>) is a suitable transformation of the treatment variable [<i>g</i>(<i>·</i>) may be the
identity function], and <i>h</i>(<i>γ, X<sub>i</sub></i>) is a function of covariates with linear and higher-order
terms, which depends on a vector of parameters,<i>γ</i>. The choice of the higher-order terms
to include is only determined by the need to obtain an estimate of theGPSthat satisfies
the balancing property.
The programgpscore.ado estimates theGPSand tests the balancing property
ac-cording to the following algorithm:
1. Estimate the parameters<i>γ</i>and<i>σ</i>2<sub>of the conditional distribution of the treatment</sub>
given the covariates (1) by maximum likelihood.1
2. Assess the validity of the assumed normal distribution model by one of the
follow-ing user-specified goodness-of-fit tests: the Kolmogorov–Smirnov, the Shapiro–
Francia, the Shapiro–Wilk, or the Stata skewness and kurtosis test for normality.
a. If the normal distribution model is statistically disapproved, inform the user
that the assumption of normality is not satisfied. The user is invited to use
a different transformation of the treatment variable<i>g</i>(<i>T<sub>i</sub></i>).
3. Estimate theGPSas
<i>R<sub>i</sub></i>= <i>√</i> 1
2<i>πσ</i>2exp
<i>−</i> 1
2<i>σ</i>2<i>{g</i>(<i>Ti</i>)<i>−h</i>(<i>γ, Xi</i>)<i>}</i>
where<i>γ</i> and<i>σ</i>2<sub>are the estimated parameters in step 1.</sub>
4. Test the balancing property and inform the user whether and to what extent
the balancing property is supported by the data. Following Hirano and Imbens
(2004), the programgpscore.ado tests for balancing of covariates according to
the following scheme:
a. Divide the set of potential treatment values,<i>T</i>, into<i>K</i> intervals according to
a user-specified rule, which should be defined on the basis of the sample
dis-tribution of the treatment variable. Let<i>G</i>1<i>, . . . , GK</i> denote the<i>K</i>treatment
intervals.
</div>
<span class='text_page_counter'>(7)</span><div class='page_container' data-page=7>
b. Within each treatment interval <i>Gk</i>, <i>k</i> = 1<i>, . . . , K</i>, compute the GPS at a
user-specified representative point (e.g., the mean, the median, or another
percentile) of the treatment variable, which we denote by<i>tGk</i>, for each unit.
Let<i>r</i>(<i>t<sub>G</sub><sub>k</sub>, X<sub>i</sub></i>) be the value of the GPScomputed at <i>t<sub>G</sub><sub>k</sub></i> <i>∈G<sub>k</sub></i> for unit<i>i</i>.
c. For each <i>k</i>, <i>k</i>= 1<i>, . . . , K</i>, block on the scores<i>r</i>(<i>tGk, Xi</i>), using<i>m</i>intervals,
defined by the quantiles of order <i>j/m</i>, <i>j</i> = 1<i>, . . . , m−</i>1, of the GPS
evalu-ated at<i>t<sub>G</sub><sub>k</sub></i>, <i>r</i>(<i>t<sub>G</sub><sub>k</sub>, X<sub>i</sub></i>), <i>i</i>= 1<i>, . . . , N</i>. Let <i>B</i><sub>1</sub>(<i>k</i>)<i>, . . . , Bm</i>(<i>k</i>) denote the<i>m</i> GPS
intervals for the<i>k</i>th treatment interval,<i>G<sub>k</sub></i>.
d. Within each interval<i>B</i>(<i><sub>j</sub>k</i>),<i>j</i> = 1<i>, . . . , m</i>, calculate the mean difference of each
covariate between units that belong to the treatment interval, <i>G<sub>k</sub></i>,<i>{i</i>:<i>T<sub>i</sub></i> <i>∈</i>
<i>G<sub>k</sub>}</i>, and units that are in the sameGPSinterval,<i>{i</i>:<i>r</i>(<i>t<sub>G</sub><sub>k</sub>, X<sub>i</sub></i>)<i>∈B<sub>j</sub></i>(<i>k</i>)<i>}</i>, but
belong to another treatment interval,<i>{i</i>:<i>T<sub>i</sub></i> <i>∈/</i> <i>G<sub>k</sub>}</i>.
e. Combine the<i>m</i>differences in means, calculated in step d, by using a weighted
average, with weights given by the number of observations in each GPS
in-terval <i>B<sub>j</sub></i>(<i>k</i>), <i>j</i> = 1<i>, . . . , m</i>. Specifically, the following weighted average is
calculated for each of the<i>p</i>covariates<i>X<sub>l</sub></i>,<i>l</i>= 1<i>, . . . , p</i>:
1
<i>N</i>
<i>m</i>
<i>j</i>=1
<i>N<sub>B</sub></i>(<i>k</i>)
<i>j</i> <i>{xl,j</i>(<i>Gk</i>)<i>−xl,j</i>(<i>G</i>
<i>c</i>
<i>k</i>)<i>}</i>
where<i>N<sub>B</sub></i>(<i>k</i>)
<i>j</i>
is the number of observations in the<i>B<sub>j</sub></i>(<i>k</i>)GPSinterval;<i>xl,j</i>(<i>Gk</i>)
is the mean of the covariate<i>Xl</i> for units<i>i</i>, such that <i>r</i>(<i>tGk, Xi</i>)<i>∈B</i>
(<i>k</i>)
<i>j</i> and
<i>Ti</i> <i>∈Gk</i>; and<i>xl,j</i>(<i>Gck</i>) is the mean of the covariate<i>Xl</i>for units <i>i</i>, such that
<i>r</i>(<i>t<sub>G</sub><sub>k</sub>, X<sub>i</sub></i>)<i>∈B<sub>j</sub></i>(<i>k</i>) and<i>T<sub>i</sub></i> <i>∈/</i> <i>G<sub>k</sub></i>. The test statistics we use to evaluate the
balancing property are functions of this weighted average.
f. For each<i>G<sub>k</sub></i>, <i>k</i> = 1<i>, . . . , K</i>, test statistics (the Student’s <i>t</i> statistics or the
Bayes factors) are calculated and shown in the Results window. Finally, the
most extreme value of the test statistics (the highest absolute value of the
Student’s <i>t</i> statistics or the lowest value of the Bayes factors) is compared
with reference values, and the user is informed of the extent to which the
balancing property is supported by the data.
<b>3.2</b>
<b>Estimating the conditional expectation of the outcome given the</b>
<b>treatment and GPS</b>
In the second stage, we model the conditional expectation of the outcome,<i>Yi</i>, given<i>Ti</i>
and<i>Ri</i>, as a flexible function of its two arguments. We use polynomial approximations
of order not higher than three. Specifically, the most complex model we consider is
<i>ϕ{E</i>(<i>Yi|Ti, Ri</i>)<i>}</i>=<i>ψ</i>(<i>Ti, Ri</i>;<i>α</i>)
</div>
<span class='text_page_counter'>(8)</span><div class='page_container' data-page=8>
where<i>ϕ</i>(<i>·</i>) is a link function that relates the predictor,<i>ψ</i>(<i>Ti, Ri</i>;<i>α</i>), to the conditional
expectation,<i>E</i>(<i>Yi|Ti, Ri</i>).
We assume that the main effects of<i>Ti</i> and<i>Ri</i> cannot be removed so that we have
18 possible submodels. The programdoseresponse model.adodefines all these models
and estimates each of them by using the estimatedGPS,<i>R<sub>i</sub></i>. When fitting the selected
model, the program takes into account the nature of the outcome variable—which may
be binary, categorical (nominal or ordinal), or continuous—by choosing the appropriate
link function.
AsHirano and Imbens(2004) emphasize, there is no direct meaning to the estimated
coefficients in the selected model, except that testing whether all coefficients involving
theGPSare equal to zero can be interpreted as a test of whether the covariates introduce
any bias.
<b>3.3</b>
<b>Estimating the dose–response function</b>
The last step consists of averaging the estimated regression function over the score
function evaluated at the desired level of the treatment. Specifically, in order to obtain
an estimate of the entire dose–response function, we estimate the average potential
outcome for each level of the treatment we are interested in as
<i>E{Y</i>(<i>t</i>)<i>}</i>= 1
<i>N</i>
<i>N</i>
<i>i</i>=1
<i>β{t,r</i>(<i>t, Xi</i>)<i>}</i>=
1
<i>N</i>
<i>N</i>
<i>i</i>=1
<i>ϕ−</i>1 <i>ψ{t,r</i>(<i>t, Xi</i>);<i>α}</i>
!
where<i>α</i>is the vector of the estimated parameters in the second stage.
The programdoseresponse.adoestimates the dose–response function according to
the following algorithm:
1. Estimate theGPS, verify the normal model used for theGPS, and test the balancing
property calling the routinegpscore.ado.
2. Estimate the conditional expectation of the outcome, given the treatment and the
GPS, by calling the routinedoseresponse model.ado.
3. Estimate the average potential outcome for each level of the treatment the user is
interested in.
4. Estimate standard errors of the dose–response function via bootstrapping.2
5. Plot the estimated dose–response function and, if requested, its confidence
inter-vals.
</div>
<span class='text_page_counter'>(9)</span><div class='page_container' data-page=9>
Some remarks on step4of the algorithm can be useful. When bootstrapped standard
errors are requested, by activating the appropriate option (see sections4 and 5), the
bootstrap encompasses both the estimation of theGPSbased on the specification given
by the user and the estimation of the<i>α</i> parameters. Reestimating theGPSand the <i>α</i>
parameters at each replication of the bootstrap procedure allows us to account for the
uncertainty associated with the estimation of theGPSand the<i>α</i>parameters.
Typically, users would first identify a transformation of the treatment variable and
a specification of the function <i>h</i> in (1), satisfying the normality assumption and the
balancing property, respectively (by using, for instance, the routinegpscore.ado), and
then provide exactly this transformation and this specification in the input to the
pro-gramdoseresponse.ado.
<b>4</b>
<b>Syntax</b>
gpscore <i>varlist</i> <i>if</i> <i>in</i> <i>weight</i>, t(<i>varname</i>) gpscore(<i>newvar</i>)
predict(<i>newvar</i>) sigma(<i>newvar</i>) cutpoints(<i>varname</i>) index(<i>string</i>)
nq gps(<i>#</i>) t transf(<i>transformation</i>) normal test(<i>test</i>) norm level(<i>#</i>)
test varlist(<i>varlist</i>) test(<i>type</i>) flag(<i>#</i>) detail
doseresponse model <i>treat var GPS var</i> <i>if</i> <i>in</i> <i>weight</i>, outcome(<i>varname</i>)
cmd(<i>regression cmd</i>) reg type t(<i>string</i>) reg type gps(<i>type</i>)
interaction(<i>#</i>)
doseresponse <i>varlist</i> <i>if</i> <i>in</i> <i>weight</i>, outcome(<i>varname</i>) t(<i>varname</i>)
gpscore(<i>newvar</i>) predict(<i>newvar</i>) sigma(<i>newvar</i>) cutpoints(<i>varname</i>)
index(<i>string</i>) nq gps(<i>#</i>) dose response(<i>newvarlist</i>)
t transf(<i>transformation</i>) normal test(<i>test</i>) norm level(<i>#</i>)
test varlist(<i>varlist</i>) test(<i>type</i>) flag(<i>#</i>) cmd(<i>regression cmd</i>)
reg type t(<i>type</i>) reg type gps(<i>type</i>) interaction(<i>#</i>) tpoints(<i>vector</i>)
npoints(<i>#</i>) delta(<i>#</i>) filename(<i>filename</i>) bootstrap(<i>string</i>) boot reps(<i>#</i>)
analysis(<i>string</i>) analysis level(<i>#</i>) graph(<i>filename</i>) detail
In thegpscoreand doseresponsecommands, the argument<i>varlist</i> represents the
list of control variables, which are used to estimate theGPS. In thedoseresponse model
</div>
<span class='text_page_counter'>(10)</span><div class='page_container' data-page=10>
<b>5</b>
<b>Options</b>
We describe only the options for thedoseresponsecommand, because they include all
the options for thegpscorecommand and thedoseresponse modelcommand.
There-fore, all the options described in sections 5.1 and 5.2 apply todoseresponse, and we
specify, if applicable, whether the option also applies togpscoreor
doseresponse model.
<b>5.1</b>
<b>Required</b>
outcome(<i>varname</i>)(doseresponse model) specifies that<i>varname</i> is the outcome
vari-able.
t(<i>varname</i>)(gpscore) specifies that<i>varname</i> is the treatment variable.
gpscore(<i>newvar</i>)(gpscore) specifies the variable name for the estimatedGPS.
predict(<i>newvar</i>) (gpscore) creates a new variable to hold the fitted values of the
treatment variable.
sigma(<i>newvar</i>)(gpscore) creates a new variable to hold the maximum likelihood
esti-mate of the conditional standard error of the treatment given the covariates.
cutpoints(<i>varname</i>)(gpscore) divides the set of potential treatment values,<i>T</i>, into
intervals according to the sample distribution of the treatment variable, cutting at
<i>varname</i> quantiles.
index(<i>string</i>)(gpscore) specifies the representative point of the treatment variable at
which the GPS has to be evaluated within each treatment interval. <i>string</i>
identi-fies either the mean (<i>string</i> =mean) or a percentile (<i>string</i> =p1<i>, . . . ,</i>p100) of the
treatment.
nq gps(<i>#</i>) (gpscore) specifies that the values of the GPSevaluated at the
represen-tative point index(<i>string</i>) of each treatment interval have to be divided into <i>#</i>
(<i>#</i> <i>∈ {</i>1<i>, . . . ,</i>100<i>}</i>) intervals, defined by the quantiles of theGPS evaluated at the
representative pointindex(<i>string</i>).
dose response(<i>newvarlist</i>)specifies the variable name(s) for the estimated
dose–response function(s).
</div>
<span class='text_page_counter'>(11)</span><div class='page_container' data-page=11>
<b>5.2</b>
<b>Optional</b>
t transf(<i>transformation</i>)(gpscore) specifies the transformation of the treatment
vari-able used in estimating theGPS. The default<i>transformation</i>is the identity function.
The supported transformations are the logarithmic transformation,t transf(ln);
the zero-skewness log transformation,t transf(lnskew0); the zero-skewness Box–
Cox transformation, t transf(bcskew0); and the Box–Cox transformation,
t transf(boxcox). The Box–Cox transformation finds the maximum likelihood
estimates of the parameters of the Box–Cox transform regressing the treatment
variablet(<i>varname</i>)on the control variables listed in the input variable list.3
normal test(<i>test</i>) (gpscore) specifies the goodness-of-fit test that gpscore will
per-form to assess the validity of the assumed normal distribution model for the
treat-ment conditional on the covariates. By default,gpscoreperforms the Kolmogorov–
Smirnov test (normal test(ksmirnov)). Possible alternatives are the Shapiro–
Francia test,normal test(sfrancia); the Shapiro–Wilk test,normal test(swilk);
and the Stata skewness and kurtosis test for normality,normal test(sktest).
norm level(<i>#</i>)(gpscore) sets the significance level of the goodness-of-fit test for
nor-mality. The default isnorm level(0.05).
test varlist(<i>varlist</i>)(gpscore) specifies that the extent of covariate balancing has to
be inspected for each variable of<i>varlist</i>. The default<i>varlist</i>consists of the variables
used to estimate theGPS. This option is useful when there are categorical variables
among the covariates. gpscore, which is a regression-like command, requires that
categorical variables are expanded into indicator (also called dummy) variable sets
and that one dummy-variable set is dropped in estimating the GPS. However, the
balancing test should also be performed on the omitted group. This can be done by
using the test varlist(<i>varlist</i>)option and by listing in <i>varlist</i> all the variables,
including the complete set of indicator variables for each categorical covariate.
</div>
<span class='text_page_counter'>(12)</span><div class='page_container' data-page=12>
test(<i>type</i>)(gpscore) specifies whether the balancing property has to be tested using
either a standard two-sided <i>t</i> test (the default) or a Bayes-factor–based method
(test(Bayes factor)). The program informs the user if there is some evidence that
the balancing property is satisfied. Recall that the test is performed for each single
variable intest varlist(<i>varlist</i>)and for each treatment interval. Specifically, let
<i>p</i> be the number of control variables in test varlist(<i>varlist</i>), and let<i>K</i> be the
number of the treatment intervals. We first calculate<i>p×K</i>values of the test statistic;
then we select the worst value (the highest<i>t</i>value in modulus, or the lowest Bayes
factor) and compare it with standard values. Table1shows the “order of magnitude”
interpretations of the test statistics we consider.
Table 1. “Order of magnitude” interpretations of the test statistics
<i>t</i>value Bayes factor (BF)<i>∗</i> Evidence for the balancing property (BP)
<i>|t|</i> <i><</i>1<i>.</i>282 BF<i>></i>1<i>.</i>00 Evidence supports theBP
1<i>.</i>282<i><</i> <i>|t|</i> <i><</i>1<i>.</i>645 <i>√</i>0<i>.</i>10<i><</i>BF<i><</i>1<i>.</i>00 Very slight evidence against theBP
1<i>.</i>645<i><</i> <i>|t|</i> <i><</i>1<i>.</i>960 0<i>.</i>10<i><</i>BF<i><√</i>0<i>.</i>10 Moderate evidence against theBP
1<i>.</i>960<i><</i> <i>|t|</i> <i><</i>2<i>.</i>576 0<i>.</i>01<i><</i>BF<i><</i>0<i>.</i>10 Strong to very strong evidence against theBP
<i>|t|</i> <i>></i>2<i>.</i>576 BF<i><</i>0<i>.</i>01 Decisive evidence against theBP
<i>∗</i><sub>The order of magnitude interpretations of the Bayes factor we applied were proposed</sub>
byJeffreys(1961).
flag(<i>#</i>)(gpscore) specifies thatgpscoreestimates theGPSwithout performing either
a goodness-of-fit test for normality or a balancing test. The default<i>#</i> is 1, meaning
that both the normal distribution model and the balancing property are tested; the
default level is recommended. We introduced this option for practical reasons. Recall
thatdoseresponse estimates the standard errors of the dose–response function by
using bootstrap methods. In each bootstrap iteration, we want to reestimate the
GPSwithout testing either the normality assumption or the balancing property.
cmd(<i>regression cmd</i>)(doseresponse model) defines the regression command to be used
for estimating the conditional expectation of the outcome given the treatment and
theGPS. The default for the outcome variable iscmd(logit)when there are two
dis-tinct values,cmd(mlogit)when there are 3–5 values, andcmd(regress)otherwise.
The supported regression commands arelogit,probit,mlogit,mprobit,ologit,
</div>
<span class='text_page_counter'>(13)</span><div class='page_container' data-page=13>
reg type t(<i>type</i>)(doseresponse model) defines the maximum power of the treatment
variable in the polynomial function used to approximate the predictor for the
con-ditional expectation of the outcome given the treatment and the GPS. The default
<i>type</i> is linear, meaning that the predictor, <i>ψ</i>(<i>T,R</i>;<i>α</i>), is a linear function of the
treatment. Alternatively,<i>type</i>can bequadraticorcubic.
reg type gps(<i>type</i>) (doseresponse model) defines the maximum power of the
esti-mated GPS in the polynomial function used to approximate the predictor for the
conditional expectation of the outcome given the treatment and theGPS. The
de-fault <i>type</i>is linear, meaning that the predictor,<i>ψ</i>(<i>T,R</i>;<i>α</i>), is a linear function of
the estimatedGPS. Alternatively,<i>type</i>can bequadraticor cubic.
interaction(<i>#</i>) (doseresponse model) specifies whether the model for the
condi-tional expectation of the outcome given the treatment and theGPShas the
interac-tion between treatment andGPS. The default<i>#</i> is 1, meaning that the interaction
is included.
tpoints(<i>vector</i>)specifies thatdoseresponseestimates the average potential outcome
for each level of the treatment in<i>vector</i>. By default,doseresponsecreates a vector
with the<i>i</i>th element equal to the<i>i</i>th observed treatment value. This option cannot
be used with thenpoints(<i>#</i>)option (see below).
npoints(<i>#</i>) specifies thatdoseresponseestimates the average potential outcome for
each level of the treatment belonging to a set of evenly spaced values,<i>t</i>0<i>, t</i>1<i>, . . . , t</i>#,
that cover the range of the observed treatment. This option cannot be used with
thetpoints(<i>vector</i>)option (see above).
delta(<i>#</i>)specifies thatdoseresponsealso estimates the treatment-effect function
con-sidering a<i>#</i>-treatment gap, which is defined as<i>μ</i>(<i>t</i>+ #)<i>−μ</i>(<i>t</i>). The default <i>#</i> is
0, meaning thatdoseresponseestimates only the dose–response function,<i>μ</i>(<i>t</i>).
filename(<i>filename</i>)specifies that the treatment levels specified through the
tpoints(<i>vector</i>) option or the npoints(<i>#</i>) option, the estimated dose–response
function, and, eventually, the estimated treatment-effect function, along with their
standard errors (if calculated), be stored to a new file called<i>filename</i>.
bootstrap(<i>string</i>)specifies the use of bootstrap methods to derive standard errors and
confidence intervals. By default,doseresponsedoes not apply bootstrap techniques.
In such a case, no standard error is calculated. To activate this option,<i>string</i> should
be set toyes.
boot reps(<i>#</i>) specifies the number of bootstrap replications to be performed. The
default isboot reps(50). This option produces an effect only if thebootstrap()
</div>
<span class='text_page_counter'>(14)</span><div class='page_container' data-page=14>
analysis(<i>string</i>)specifies thatdoseresponseplots the estimated dose–response
func-tion(s) and, eventually, the estimated treatment-effect funcfunc-tion(s), along with the
corresponding confidence intervals if they are calculated with bootstrapping. By
default,doseresponseplots only the estimated dose–response and treatment
func-tion(s). In order to plot confidence intervals,<i>string</i> has to be set toyes. If the user
typesanalysis(no), no plot is shown.
analysis level(<i>#</i>) sets the confidence level of the confidence intervals. The default
isanalysis level(0.95).
graph(<i>filename</i>)stores the plots of the estimated dose–response function and the
esti-mated treatment effects to a new file called <i>filename</i>. When the outcome variable
is categorical, doseresponsecreates a new file for each category <i>i</i>of the outcome
variable and names it<i>filename i</i>.
detail(gpscore) displays more detailed output. Specifically, this option specifies that
gpscoreshows the results of the goodness-of-fit test for normality, some summary
statistics of the distribution of the GPS evaluated at the representative point of
each treatment interval, and the results of the balancing test within each treatment
interval. When this option is specified fordoseresponse, the results of the regression
of the outcome on the treatment and theGPSare also shown.
<b>6</b>
<b>Example: The Imbens–Rubin–Sacerdote lottery </b>
<b>sam-ple</b>
We use data from the survey of Massachusetts lottery winners; the data are described
in detail inImbens, Rubin, and Sacerdote(2001). We are interested in estimating the
effect of the prize amount on subsequent labor earnings (from U.S. Social Security
records). Although the lottery prize is obviously randomly assigned, substantial unit and
item nonresponse led to a selected sample, where the amount of the prize is potentially
correlated with background characteristics and potential outcomes. To remove such
biases, we make the weak unconfoundedness assumption specifying that, conditional on
the covariates, the lottery prize is independent of the potential outcomes.4
The sample we use in this analysis is the “winners” sample of 237 individuals who
won a major prize in the lottery. The outcome of interest isyear6 (earnings six years
after winning the lottery), and the treatment is prize, the prize amount. Control
variables are age, gender, years of high school, years of college, winning year, number
of tickets bought, work status after winning, and earnings<i>s</i> years before winning the
lottery (with<i>s</i>= 1<i>,</i>2<i>, . . . ,</i>6).
We tried to replicate the results produced by Hirano and Imbens(2004) but have
not been able to numerically replicate all their estimates because of restrictions of our
</div>
<span class='text_page_counter'>(15)</span><div class='page_container' data-page=15>
programs. Specifically, our programs do not allow us to consider a function of the
treat-ment variable or a function of theGPSin the estimation of the conditional expectation
of the outcome, given the treatment and theGPS. However, we get qualitatively similar
results.
<b>6.1</b>
<b>Output from gpscore</b>
We first choose the quantiles of the treatment variable to divide the sample into groups.
FollowingHirano and Imbens(2004), we divide the range of prizes into three treatment
intervals, [0–23], (23–80], and (80–485]. Then we rungpscore using the specification
applied byHirano and Imbens(2004). The output looks like the following:
. use lotterydataset.dta
. qui generate cut = 23 if prize<=23
. qui replace cut = 80 if prize>23 & prize<=80
. qui replace cut = 485 if prize>80
. gpscore agew male ownhs owncoll tixbot workthen yearw yearm1 yearm2 yearm3
> yearm4 yearm5 yearm6, t(prize) gpscore(pscore) predict(hat_treat) sigma(sd)
> cutpoints(cut) index(p50) nq_gps(5) t_transf(ln) detail
Generalized Propensity Score
******************************************************
Algorithm to estimate the generalized propensity score
******************************************************
Estimation of the propensity score
The log transformation of the treatment variable prize is used
T
Percentiles Smallest
1% 1.609438 .1301507
5% 2.283851 .1301507
10% 2.420012 1.609438 Obs 237
25% 2.835211 1.67818 Sum of Wgt. 237
50% 3.45783 Mean 3.558185
Largest Std. Dev. .9553768
75% 4.143008 5.598792
90% 4.875426 5.720607 Variance .9127448
95% 5.128892 5.778643 Skewness -.0165889
99% 5.720607 6.183716 Kurtosis 3.452439
initial: log likelihood = -<inf> (could not be evaluated)
feasible: log likelihood = -4917.4112
rescale: log likelihood = -480.91803
rescale eq: log likelihood = -348.62357
Iteration 0: log likelihood = -348.62357
(<i>output omitted</i>)
</div>
<span class='text_page_counter'>(16)</span><div class='page_container' data-page=16>
Number of obs = 237
Wald chi2(13) = 37.22
Log likelihood = -307.68186 Prob > chi2 = 0.0004
T Coef. Std. Err. z P>|z| [95% Conf. Interval]
eq1
agew .0151905 .0048563 3.13 0.002 .0056724 .0247086
male .4379826 .1351124 3.24 0.001 .1731672 .702798
ownhs .0192025 .060835 0.32 0.752 -.1000319 .1384368
owncoll .0372805 .0397666 0.94 0.349 -.0406607 .1152217
tixbot .0043423 .0182546 0.24 0.812 -.031436 .0401206
workthen .1270879 .1645602 0.77 0.440 -.1954442 .44962
yearw -.0014367 .0464566 -0.03 0.975 -.09249 .0896166
yearm1 .0062064 .010379 0.60 0.550 -.014136 .0265488
yearm2 -.0123161 .0162758 -0.76 0.449 -.044216 .0195839
yearm3 .0119446 .0166256 0.72 0.472 -.0206411 .0445302
yearm4 .0242245 .0158217 1.53 0.126 -.0067855 .0552344
yearm5 -.0216437 .0153635 -1.41 0.159 -.0517555 .0084682
yearm6 -.0050021 .0110455 -0.45 0.651 -.0266509 .0166467
_cons 2.315546 .4693959 4.93 0.000 1.395547 3.235545
eq2
_cons .886297 .040709 21.77 0.000 .806509 .9660851
Test for normality of the disturbances
Kolmogorov-Smirnov equality-of-distributions test
Normal Distribution of the disturbances
One-sample Kolmogorov-Smirnov test against theoretical distribution
normal((res_etreat - r(mean))/sqrt(r(Var)))
Smaller group D P-value Corrected
res_etreat: 0.0517 0.281
Cumulative: -0.0420 0.434
Combined K-S: 0.0517 0.550 0.517
The assumption of Normality is statistically satisfied at .05 level
Estimated generalized propensity score
Percentiles Smallest
1% .0131817 .0003053
5% .0869414 .0011738
10% .1272663 .0131817 Obs 237
25% .2255553 .0163113 Sum of Wgt. 237
50% .3536221 Mean .3196603
Largest Std. Dev. .1222106
75% .4343045 .4500003
90% .4481351 .4500911 Variance .0149354
95% .4497166 .450096 Skewness -.7723501
99% .4500911 .4501086 Kurtosis 2.510499
</div>
<span class='text_page_counter'>(17)</span><div class='page_container' data-page=17>
******************************************************************************
The set of the potential treatment values is divided into 3 intervals
The values of the gpscore evaluated at the representative point of each
treatment interval are divided into 5 intervals
******************************************************************************
***********************************************************
Summary statistics of the distribution of the GPS evaluated
at the representative point of each treatment interval
***********************************************************
Variable Obs Mean Std. Dev. Min Max
gps_1 237 .262852 .0956436 .0583948 .4486237
Variable Obs Mean Std. Dev. Min Max
gps_2 237 .4178101 .0373217 .2433839 .4501224
Variable Obs Mean Std. Dev. Min Max
gps_3 237 .1814998 .088236 .0181741 .4141454
******************************************************************************
Test that the conditional mean of the pre-treatment variables given the
generalized propensity score is not different between units who belong to a
particular treatment interval and units who belong to all other treatment
intervals
******************************************************************************
Treatment Interval No 1 - [1.139000058174133, 22.98200035095215]
Mean Standard
Difference Deviation t-value
agew -.25322 1.814 -.13959
male .04799 .04246 1.1304
ownhs .15044 .156 .96433
</div>
<span class='text_page_counter'>(18)</span><div class='page_container' data-page=18>
Treatment Interval No 2 - [23.08799934387207, 79.11299896240234]
Mean Standard
Difference Deviation t-value
agew -.13308 1.8294 -.07275
male -.03419 .0657 -.52041
ownhs -.2294 .13927 -1.6471
owncoll -.20996 .21228 -.98908
tixbot -.26933 .43812 -.61474
workthen .03013 .05266 .57227
yearw -.32817 .17008 -1.9295
yearm1 .51467 1.7741 .2901
yearm2 .23703 1.7038 .13912
yearm3 .41572 1.6656 .24959
yearm4 .46856 1.571 .29826
yearm5 -.00903 1.6242 -.00556
yearm6 -.33587 1.6445 -.20423
Treatment Interval No 3 - [82.98699951171875, 484.7900085449219]
Mean Standard
Difference Deviation t-value
agew -1.7504 2.3202 -.75444
male -.04742 .06211 -.76342
ownhs .34062 .1914 1.7796
owncoll .23199 .28116 .82512
tixbot -.03159 .56716 -.0557
workthen -.07006 .07448 -.94069
yearw .3672 .22613 1.6238
yearm1 -.63678 1.9428 -.32777
yearm2 -.83409 1.8356 -.45441
yearm3 -1.2074 1.7322 -.69707
yearm4 -1.351 1.5982 -.84534
yearm5 -1.6137 1.8792 -.8587
yearm6 -2.2111 1.8615 -1.1878
According to a standard two-sided t-test:
Moderate evidence against the balancing property
The balancing property is satisfied at level 0.05
</div>
<span class='text_page_counter'>(19)</span><div class='page_container' data-page=19>
<b>6.2</b>
<b>Output from doseresponse</b>
Before running doseresponse, we have to decide about the treatment levels, which
estimate the average potential outcome. FollowingHirano and Imbens(2004), we focus
on the values 10<i>,</i>20<i>, . . . ,</i>100, which we store to a 10-dimensional vector namedtp(see
below). The output from runningdoseresponseis as follows:
. use lotterydataset.dta, clear
. qui generate cut = 23 if prize<=23
. qui replace cut = 80 if prize>23 & prize<=80
. qui replace cut = 485 if prize>80
. matrix define tp = (10\20\30\40\50\60\70\80\90\100)
. doseresponse agew ownhs male tixbot owncoll workthen yearw yearm1 yearm2
> yearm3 yearm4 yearm5 yearm6, outcome(year6) t(prize) gpscore(pscore)
> predict(hat_treat) sigma(sd) cutpoints(cut) index(p50) nq_gps(5)
> t_transf(ln) dose_response(dose_response) tpoints(tp) delta(1)
> reg_type_t(quadratic) reg_type_gps(quadratic) interaction(1) bootstrap(yes)
> boot_reps(100) filename("output") analysis(yes) graph("graph_output") detail
********************************************
ESTIMATE OF THE GENERALIZED PROPENSITY SCORE
********************************************
(<i>output omitted</i>)
The outcome variable ``year6´´ is a continuous variable
The regression model is: Y = T + T^2 + GPS + GPS^2 + T*GPS
Source SS df MS Number of obs = 202
F( 5, 196) = 3.01
Model 2945.92738 5 589.185477 Prob > F = 0.0122
Residual 38378.9633 196 195.811037 R-squared = 0.0713
Adj R-squared = 0.0476
Total 41324.8907 201 205.596471 Root MSE = 13.993
year6 Coef. Std. Err. t P>|t| [95% Conf. Interval]
prize -.2254371 .0748156 -3.01 0.003 -.3729839 -.0778902
prize_sq .0003537 .0001669 2.12 0.035 .0000245 .0006828
pscore -103.3373 48.37076 -2.14 0.034 -198.7312 -7.943281
pscore_sq 131.949 79.40569 1.66 0.098 -24.65021 288.5482
prize_pscore .5499933 .2197661 2.50 0.013 .1165835 .9834031
_cons 31.26845 6.955419 4.50 0.000 17.55138 44.98552
Bootstrapping of the standard errors
...
> ...
The program is drawing graphs of the output
This operation may take a while
</div>
<span class='text_page_counter'>(20)</span><div class='page_container' data-page=20>
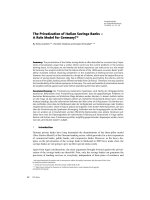
The estimated coefficients of the regression of the outcome, earnings six years after
winning the lottery, the prize, and the score are shown because we have required a
detailed output. Otherwise, doseresponse provides only a graphic output, such as
that shown in figure1. Figure1shows both the estimated dose–response function and
the estimated treatment-effect function, which can be interpreted as a derivate, because
we have specified a treatment gap equal to 1 (delta(1)). Only information concerning
theGPSestimation is provided whendetailis not specified and theanalysis()option
is set tono.
5000
10000
15000
20000
25000
E[year6(t)]
0 20 40 60 80 100
Treatment level
Dose Response Low bound
Upper bound
Confidence Bounds at .95 % level
Dose response function = Linear prediction
Dose Response Function
−
200
−
100
0
100
200
E[year6(t+1)]
−
E[year6(t)]
0 20 40 60 80 100
Treatment level
Treatment Effect Low bound
Upper bound
Confidence Bounds at .95 % level
Dose response function = Linear prediction
Treatment Effect Function
Figure 1. Estimated dose–response function, estimated derivative, and 95% confidence
bands
</div>
<span class='text_page_counter'>(21)</span><div class='page_container' data-page=21>
The results generated by doseresponse are stored in a new Stata file, which we
have named output. This file has 10 observations and 6 variables: treatment level,
containing the treatment levels, at which we estimate the average potential outcome;
treatment level plus, containing the <i>#</i>-shifted treatment levels, where <i>#</i> is equal
to 1;dose response, the estimated dose–response function;se dose response bs, the
standard errors of the estimated dose–response function;diff dose response, the
es-timated treatment-effect function; andse diff dose response bs, the standard errors
of the estimated treatment-effect function. The graphic output is also stored to a new
file, which we have namedgraph output.
<b>7</b>
<b>Acknowledgments</b>
We thank Fabrizia Mealli, Guido Imbens, and Keisuke Hirano for their insightful
sug-gestions and discussions, and Guido Imbens and Keisuke Hirano for providing the data.
<b>8</b>
<b>References</b>
Becker, S. O., and A. Ichino. 2002. Estimation of average treatment effects based on
propensity scores. <i>Stata Journal</i> 2: 358–377.
Bia, M., and A. Mattei. 2007. Application of the generalized propensity score.
Eval-uation of public contributions to Piedmont enterprises. POLIS Working Paper 80,
University of Eastern Piedmont.
Hirano, K., and G. W. Imbens. 2004. The propensity score with continuous
treat-ments. In <i>Applied Bayesian Modeling and Causal Inference from Incomplete-Data</i>
<i>Perspectives</i>, ed. A. Gelman and X.-L. Meng, 73–84. West Sussex, England: Wiley
InterScience.
Holland, P. W. 1986. Statistics and causal inference.<i>Journal of the American Statistical</i>
<i>Association</i>8: 945–960.
Imbens, G. W., D. B. Rubin, and B. I. Sacerdote. 2001. Estimating the effect of unearned
income on labor earnings, savings, and consumption: Evidence from a survey of
lottery players. <i>American Economic Review</i> 91: 778–794.
Jeffreys, H. 1961. <i>Theory of Probability</i>. 3rd ed. Oxford: Oxford University Press.
Leuven, E., and B. Sianesi. 2003. psmatch2: Stata module to perform full Mahalanobis
and propensity score matching, common support graphing, and covariate imbalance
testing. Boston College Department of Economics, Statistical Software Components.
Downloadable from />
Rosenbaum, P. R., and D. B. Rubin. 1983. The central role of the propensity score in
observational studies for causal effects. <i>Biometrika</i>70: 41–55.
</div>
<span class='text_page_counter'>(22)</span><div class='page_container' data-page=22>
<b>About the authors</b>
Michela Bia is a research assistant at Laboratorio Revelli, Centre for Employment Studies,
Collegio Carlo Alberto, Turin, Italy.
</div>
<!--links-->
<a href=''></a>