- Trang chủ >>
- THPT Quốc Gia >>
- Sinh học
Social Capital, Network Effects and Saving in Rural Vietnam
Bạn đang xem bản rút gọn của tài liệu. Xem và tải ngay bản đầy đủ của tài liệu tại đây (152.08 KB, 21 trang )
<span class='text_page_counter'>(1)</span><div class='page_container' data-page=1>
SOCIAL CAPITAL, NETWORK EFFECTS, AND SAVINGS IN
RURAL VIETNAM
byCarolNewman
<i>Department of Economics and Institute for International Integration Studies, Trinity College Dublin</i>
FinnTarp*
<i>Department of Economics, University of Copenhagen, and UNU-WIDER, Helsinki</i>
and
KatleenVanDenBroeck
<i>Department of Economics, University of Copenhagen</i>
Information failures are a major barrier to formal financial saving in low-income countries. We explore
the extent to which social capital in rural Vietnam plays a role in increasing formal savings where
knowledge gaps exist. Social capital is defined as information sharing and the elimination of
informa-tion asymmetries through active participainforma-tion in the Women’s Union. We consider high- and
low-quality networks in terms of the low-quality of information transmitted. We find that membership of
high-quality networks leads to higher levels of saving in formal financial institutions and saving for
productive investments. Our results support a role for social capital in facilitating savings and suggest
that transmitting financial information through the branches of the Women’s Union could be effective
in increasing formal savings at grassroots level. We also conclude that it is important to ensure that the
information disseminated is accurate given that behavioral effects are also found in networks with
low-quality information.
<b>JEL Codes</b>: D14, O12, Z13
<b>Keywords</b>: household savings, information failure, social capital, Vietnam, Women’s Union
1. Introduction
In this study we examine the role that social capital can play in correcting for
financial market failures in rural communities in Vietnam. Such failures may lead
to sub-optimal behavior as households choose either not to save or to save in a
low-yielding form, for example, cash held at home. In line with Coleman (1988)
<i>Note</i>: We would like to thank two anonymous referees for their constructive critique and
sugges-tions, and for the insightful advice from the editor. We are grateful for most helpful comments and
critique on an earlier version of this paper presented at the UNU-WIDER Conference on Poverty and
Behavioural Economics in Helsinki in September 2011 and at other conferences. We also acknowledge
useful comments from colleagues at the Central Institute of Economic Management (CIEM), the
Institute of Labour Science and Social Affairs (ILSSA), and the Institute of Policy and Strategy for
Agriculture and Rural Development (IPSARD), Hanoi, Vietnam and participants at various seminars
in Vietnam. Particular thanks are due to Chu Tien Quang, Luu Duc Khai, Nguyen Le Hoa, and Pham
Lan Huong for background information and to ILSSA staff for collaboration on data collection.
Financial support from Danida is acknowledged. The usual caveats apply.
*Correspondence to: Finn Tarp, Department of Economics, University of Copenhagen, Øster
Farigmagsgade 5, Building 26, DK-1353 Copenhagen, Denmark ().
Review of Income and Wealth
Series 60, Number 1, March 2014
DOI: 10.1111/roiw.12061
</div>
<span class='text_page_counter'>(2)</span><div class='page_container' data-page=2>
and Putnam (1993), we define social capital as the existence of a social structure
which leads to the formation of social networks through which information can be
disseminated or shared. This, in turn, informs individual financial behavior.
We are motivated by two separate considerations. First, household savings
are an important determinant of welfare. They help households to smooth
con-sumption when faced with negative income shocks (see, for example, Deaton,
1992; Wainwright and Newman, 2011). Second, a key challenge for developing
countries is to increase the share of savings that is held formally given the
impor-tance of accumulating capital for productive investment purposes (Dupas and
Robinson, 2009). Yet, for low-income households there are many barriers to
accessing savings accounts in formal financial institutions. Poor households are
therefore more likely to save informally and often keep money as cash held at
home (Banerjee and Duflo, 2007).
Arguably, one of the most difficult challenges in increasing formal savings is
correcting for information failures.1<sub>In some cases, these can be effectively </sub>
elimi-nated at local level rather than requiring costly state-wide policies. It is well
established in the literature that risk-sharing among social groups through a
system of transfers and loans is an important mechanism for risk coping among
the rural poor (Coate and Ravallion, 1993; Townsend, 1994; Udry, 1994; Foster
and Rosenzweig, 2001; Ligon <i>et al</i>., 2002). Informal risk-sharing of this kind
usually takes the form of informal savings and credit groups that directly
substi-tute for the formal market. The potential role of social capital in transmitting
information on, for example, the merits of formal saving or the process involved in
setting up a savings account, through existing social structures is much less
under-stood in this context.
In this study, we propose, in line with much of the literature, that social
networks can act as a substitute for formal institutions where the latter are weak
(see Fafchamps, 2006, for an overview). Bowles and Gintis (2002) highlight the
fact that communities possess private information, which neither the market nor
the state has access to, that may allow them to correct more effectively for local
market failures through existing social structures. In particular, they can facilitate
information sharing, and eliminate information asymmetries through establishing
social norms. This is the concept of social capital that we apply in this study and
we establish its role in influencing savings behavior.
This definition is consistent with much of the wider literature concerned with
defining and conceptualizing social capital. Coleman (1988) identifies three forms
of social capital that can act as a resource in improving outcomes for individual
actors, namely, information sharing, obligation and trust, and social norms.
Simi-larly, Putnam (1993) identifies social norms and social trust as the core
character-istics of social organizations that facilitate coordination and cooperation among
members but places particular emphasis as well on the role of social networks.
Social capital is also defined by the social structures that allow interpersonal
1<sub>Physical distance to savings institutions is another important barrier. For example, Rosenzweig</sub>
</div>
<span class='text_page_counter'>(3)</span><div class='page_container' data-page=3>
relationships to take place. In this context, social organizations play an important
role in facilitating the transmission of social capital through the social network
that they give rise to. Fafchamps (2006), for example, emphasizes the role of clubs
and networks in the provision of public goods while Olken (2009) uses
participa-tion in social groups as a measure of social connectedness.
We consider two specific mechanisms through which social capital is
trans-mitted through social networks. The first is the information channel where
members of the social network share information with each other which leads
them to behave in a similar fashion. This is consistent with the models of herd
behavior proposed by Banerjee (1992) and Bikhchandani <i>et al</i>. (1992) whereby
individuals behave as others do in the belief that they possess more information
on the best course of action. Foster and Rosenzweig (1995) take this idea a step
further in identifying “learning from neighbors” as an important source of
pro-ductivity improvements in the adoption of a new technology in India. The second
mechanism is through the existence of social norms, where an individual’s
pre-ferences are influenced by an established set of norms that directly impact on
individual tastes or affect preferences through social pressures. Social norms are
identified by Coleman (1988) and Putnam (1993) as a form of social capital, and
evidence of a role for social norms in economic decision making has been provided
in many different contexts. For example, Akerlof (1980) provides a theoretical
model which identifies the pecuniary reasons why social customs prevail. Bertrand
<i>et al</i>. (2000) empirically identify a link between social networks and welfare
recipiency which they explain through social norms that exist within the network.
Stone <i>et al</i>. (2003) refer to social capital at work when they show how
family-friends and civic ties relate to labor market outcomes in Australia. They also
contribute a brief and illuminating discussion of the different dimensions of social
capital in the various realms of the social sciences.
The empirical literature linking social capital to financial market behavior is
limited, particularly in developing country contexts. There are some notable
excep-tions, including Cole<i>et al</i>. (2009) who find that trust and information are
impor-tant in financial market participation, using a randomized field experiment in two
rural regions of India. Experimental evidence that social learning improves
indi-viduals’ ability to solve life cycle precautionary savings models is provided by
Ballinger<i>et al</i>. (2003). With an objective similar to this study but in a developed
country setting, Guiso <i>et al</i>. (2004) measure social capital through a number of
different indicators and find that in high social capital areas of Italy, households
are more likely to invest in stock than in cash. Our study adds to this literature by
providing evidence of a role for social capital in informing savings decisions in a
developing country setting.
</div>
<span class='text_page_counter'>(4)</span><div class='page_container' data-page=4>
correcting for information asymmetries in this context given the nature and
sig-nificance of the role played by mass organizations at grassroots level.
In Vietnam, the state continues to play a dominant role in the functioning of
the economy. Under the umbrella of the Communist Party, a variety of
socio-political organizations exist that play an important role, both socially and
eco-nomically, in local communities. These groups follow a hierarchical structure with
official leaders at the central, province, district, and commune level, managing
the activities of the organization and working with members. Since these groups
operate under the umbrella of the state, their activities complement government
strategies and policies. The Women’s Union is one of the most prominent of these
groups and, along with addressing many social issues locally, such as providing
information on family planning and health, it is mandated to work toward
facili-tating savings and credit teams.2
The Women’s Union was formed on the basis of socio-political ideals, and the
duties and responsibilities of members range from fulfilling the duties of a citizen,
actively participating in community meetings, supporting the work of the
commu-nity, and the sharing of information. Active members regularly interact at
meet-ings and so the Women’s Union is likely to serve as an important vehicle for social
relations that facilitate the sharing of information and the establishment of social
norms (Coleman, 1988). Moreover, the nature of the organizational structure of
the Women’s Union suggests that members are likely to possess the information
necessary to behave in an optimal way, particularly in the case of savings behavior.
It is expected, however, that there will be heterogeneity in the quality of
informa-tion possessed by different branches of the Women’s Union and as a result the
network of actors within these groups. While network quality is traditionally
thought of in terms of the extent of trust and reciprocity between members
(Coleman, 1988; Putnam, 1993), in this study, we define the quality of the network
in terms of the quality of information it possesses.
In summary, we hypothesize that active membership of the Women’s Union
in rural Vietnam leads to the formation of a network that facilitates interpersonal
relationships that allow members to share information on the merits of formal
saving. Accordingly, we analyze the choice of different types of saving and how the
composition of the portfolio is affected by union membership. We consider both
high-quality and low-quality networks defined by the quality of the information
that the branch of the Women’s Union is observed to possess which differs across
localities.
To test our hypothesis we use a unique and carefully developed dataset for
Vietnam. We find that high levels of overall formal saving by Women’s Union
members induce other members to save formally and increase the likelihood that
they save for productive purposes. We conclude that these groups serve as an
important source of information on the merits of formal saving.
The theoretical framework is presented in Section 2, followed by the empirical
approach in Section 3. The data are described in Section 4, and the empirical
results in Section 5. Section 6 concludes.
2<sub>The Vietnamese Women’s Federation has established agreements with the two main state banks</sub>
</div>
<span class='text_page_counter'>(5)</span><div class='page_container' data-page=5>
2. TheoreticalFramework
The theoretical motivations for household and individual savings have been
extensively explored in the literature (see, for example, Gersovitz, 1988; Browning
and Lusardi, 1996). Precautionary motives are particularly relevant in developing
countries where income is volatile and other consumption smoothing
mecha-nisms are limited. For example, Fafchamps and Pender (1997) find that while poor
households save for both precautionary reasons and to finance investment,
par-ticularly where credit is not available, low returns on saving prevent them from
investing in profitable investment, in particular, non-divisible larger investments.
As such, in most cases precautionary motives prevail as households remain in a
poverty trap. Our theoretical starting point for analyzing precautionary savings
follows most of the literature modeling savings behavior under uncertainty using
a standard inter-temporal allocation model, where in each time period the
house-hold must decide how much to consume and how much to invest in accumulating
assets (including savings) which will act as a buffer against unexpected income
shocks (see, for example, Deaton, 1991, 1992; Fafchamps<i>et al</i>., 1998; Wainwright
and Newman, 2011).
A household’s discounted expected utility function is given by:
(1) <i><sub>U</sub></i> <i><sub>E</sub></i> <i><sub>U C</sub></i>
<i>i</i> <i>t</i>
<i>t</i>
<i>i</i> <i>it</i>
<i>t</i>
<i>T</i>
= ⎡
( )
⎣⎢
⎤
⎦⎥
=
∑
δ1
,
where <i>δ</i> is the rate of time preference, <i>Ui</i>(<i>Cit</i>) is the utility function, and <i>T</i> is
the number of time periods. We assume that households are risk averse,
i.e. <i>U C<sub>i</sub></i>′′( )<i><sub>it</sub></i> <0, and have precautionary savings, i.e. <i>Ui</i>′′′( )<i>Cit</i> <sub>></sub>0. The former
assumption is required to ensure that the utility function is concave so households
are risk averse, and the latter ensures that the marginal utility function is convex
so uncertainty induces saving.
In each time period, each household randomly receives income<i>yi</i>(<i>sit</i>) which
depends on the state of nature<i>sit</i>facing the household in time period<i>t</i>. The state
of nature includes all exogenous shocks to income that can affect the whole
community (such as a natural disaster) or the individual households (such as the
death of the main income earner). Since households are risk averse they
accumu-late liquid wealth (or precautionary savings) to act as a buffer against such income
shocks. Total wealth (liquid) of the household at time<i>t</i>is given by<i>Ait</i>which yields
a return <i>rit</i>. The Bellman equation corresponding to the household’s decision
problem takes the usual form:
(2) <i>V X s<sub>i</sub></i> <i><sub>it</sub></i> <i><sub>it</sub></i> <i>U X</i> <i>A</i> <i>EV y s</i> <i>r</i>
<i>Ait</i> <i>i</i> <i>it</i> <i>it</i> <i>i</i> <i>i</i> <i>i</i> <i>it</i> <i>it</i>
, max
(
)
=(
−)
+(
)
+ +(
)
+1 +1 +1 +1
1
δ
[
<i>AA<sub>it</sub></i><sub>+</sub><sub>1</sub>|<i>s<sub>it</sub></i><sub>+</sub><sub>1</sub>]
,where<i>Xit</i>=<i>Ait</i>+<i>yit</i>is “cash-in-hand” of household<i>i</i>in time<i>t</i>and<i>Ait</i>+1≥0, i.e. no
borrowing. This model allows for accumulating and selling of assets to act as a
buffer against income shocks.
Following Fafchamps<i>et al</i>. (1998), the distribution of the returns to
accumu-lating assets will depend on the level and composition of<i>Ait</i>. We assume that the
</div>
<span class='text_page_counter'>(6)</span><div class='page_container' data-page=6>
the decision to choose savings over other forms of insurance against shocks, we
assume that purchasing formal insurance, borrowing, or accumulating other liquid
assets are not possible. We allow for savings of different forms and so the
house-hold’s wealth portfolio can include cash, gold, and jewelry held at home, informal
savings held with local rotating credit groups or money lenders, or formal savings
held in state and private-owned banks.
For simplicity, we group together informal savings and cash held at home
for the purpose of our theoretical model. We extend the model given in (2) to allow
for two assets: informal savings/cash held at home (<i>Wit</i>) and formal savings in a
financial institution (<i>Fit</i>). We assume that the return to holding savings informally
and cash at home is negative (–<i>θ</i>) given the risk of theft.3<sub>For simplicity we assume</sub>
that this risk is constant across all households. We assume that the perceived
return to formal saving is a function of the information available to the household
at time<i>t</i>, i.e.<i>γi</i>(<i>Iit</i>)=<i>γit</i>, whereγ<i><sub>i</sub></i>′( )<i>I<sub>it</sub></i> >0. This will vary across households
depend-ing on how certain or uncertain they are regarddepend-ing future returns. We assume that
the level of certainty depends on how good the available information is. As
discussed in Section 1, we assume that information can be transmitted to
house-holds through participation in the Women’s Union that gives rise to social
networks. Information can be transmitted through the sharing of information
between members that regularly interact at meetings or through the demonstration
of established social or group norms.
Formal saving comes at a cost,<i>η</i>, which is also a function of the information
available to the household, i.e.<i>ηi</i>(<i>Iit</i>)=<i>ηit</i>andη<i>i</i>′( )<i>Iit</i> <0. These costs include travel
costs but could also include the cost of learning how to apply for a savings account
or how different types of financial products work (for example, fixed term deposits
vs. flexible term deposits). Women’s Union membership could reduce these costs
by providing households with the relevant information through the social
network. The combined returns to holding savings informally or cash at home and
formal savings are given by:
(3)
(
1<sub>+</sub><i>r<sub>it</sub></i><sub>+</sub><sub>1</sub>)
<i>A<sub>it</sub></i><sub>+</sub><sub>1</sub><sub>= −</sub>(1 θ)(
<i>A<sub>it</sub></i><sub>+</sub><sub>1</sub><sub>−</sub><i>F<sub>it</sub></i><sub>+</sub><sub>1</sub>)
<sub>+ +</sub>(
1 γ<i><sub>it</sub></i><sub>+</sub><sub>1</sub>)
<i>F<sub>it</sub></i><sub>+</sub><sub>1</sub><sub>−</sub>η<i><sub>it</sub></i><sub>+</sub><sub>1</sub><i>F<sub>it</sub></i><sub>+</sub><sub>1</sub><sub>1</sub>.In this setting, formal saving is considered more costly than saving informally
or at home if <i>γit</i>−<i>ηit</i><<i>θ</i>. As such, information can play an important role in
changing the perceived relative risk associated with different forms of saving
through providing information on the returns and in reducing the costs associated
with saving formally.
The revised Bellman equation can be written as:
(4) <i>V X s</i> <i>maxU X</i> <i>W</i> <i>F</i>
<i>EV y s</i>
<i>i</i> <i>it</i> <i>it</i>
<i>F</i> <i>i</i> <i>it</i> <i>it</i> <i>it</i>
<i>i</i> <i>i</i> <i>i</i> <i>it</i>
<i>it</i>
,
(
)
=(
− −)
+(
)
+ −+ + +
+
1 1 1
1 1
δ
[
(( θ)(
<i>Ait</i>+1−<i>Fit</i>+1)
+ +(
1 γ<i>it</i>+1)
<i>Fit</i>+1−η<i>it</i>+1<i>Fit</i>+1|<i>sit</i>+1]
.As before no borrowing is allowed so<i>Ait</i>+1≥<i>Fit</i>+1≥0.
3<sub>The real value of cash held at home can also potentially be eroded from one year to the next due</sub>
</div>
<span class='text_page_counter'>(7)</span><div class='page_container' data-page=7>
We solve this optimization problem to derive an expression for the level of
formal saving. Following Fafchamps<i>et al</i>. (1998), we assume a negative
exponen-tial utility function and a normal distribution for future consumption. We take a
mean variance approximation of the expected value function, so households will
choose<i>Fit</i>+1in order to (approximately):
(5) <i>max</i>
<i>y s</i> <i>W</i> <i>I</i> <i>I</i> <i>F</i>
<i>R</i>
<i>F</i>
<i>i</i> <i>it</i> <i>it</i> <i>i</i> <i>it</i> <i>i</i> <i>it</i> <i>it</i>
<i>i</i>
<i>y</i>
<i>it</i>+
( )
+ −( ) + +(
( )
−( )
)
−
+ +
1
1 1
1
2
1 1
θ γ η
σ <i>ii</i> <i>i</i>
<i>i</i>
<i>s</i> <i>I F</i>
<i>s</i> <i>s</i> <i>I F</i>
<i>it</i> <i>F</i> <i>it</i> <i>it</i>
<i>iyF</i> <i>it</i> <i>y</i> <i>it</i> <i>Fi</i> <i>it</i> <i>it</i>
2 2
1
2
1
2
( )
+( )
+
( ) ( ) ( )
⎡
⎣
+
+
σ
ρ σ σ
⎢⎢ ⎤
⎦
⎥
⎧
⎨
⎪
⎩
⎪
⎫
⎬
⎪
⎭
⎪,
where <i>Ri</i> is the Arrow–Pratt absolute risk aversion coefficient, which for the
exponential utility function exhibits constant absolute risk aversion. That is,
<i>Ri</i> = − ′′( )
[
<i>U Ci</i> <i>it</i> <i>U Ci</i>′( )<i>it</i>]
, which implies that as wealth increases households holdthe same level of wealth in the form of risky (or in this case perceived to be risky)
assets. We define the expected value of income as <i>E y s</i>
[
<i>i</i>(
<i>it</i>+1|<i>sit</i>)
]
=<i>y si</i>( )
<i>it</i> , itsvariance as <i>V y s</i>
[
<i>i</i>(
<i>it</i>+1 <i>sit</i>)
]
= <i>yi</i>( )
<i>sit</i>2
| σ , the expected value of returns to formal
saving as <i>E</i>
[
1+γ<i><sub>i</sub></i>(
<i>I<sub>it</sub></i><sub>+</sub><sub>1</sub>|<i>I<sub>it</sub></i>)
−η<i><sub>i</sub></i>(
<i>I<sub>it</sub></i><sub>+</sub><sub>1</sub>|<i>I<sub>it</sub></i>)
]
= +1 γ<i><sub>i</sub></i>( )
<i>I<sub>it</sub></i> −η<i><sub>i</sub></i>( )
<i>I<sub>it</sub></i> , and its variance as<i>V</i> 1 <i><sub>i</sub></i> <i>I<sub>it</sub></i> <sub>1</sub> <i>I<sub>it</sub></i> <i><sub>F</sub></i>2<i><sub>i</sub></i> <i>I<sub>it</sub></i>
+
(
)
[
γ + |]
=σ( )
, where σ<i>Fi</i> <i>Iit</i>2<sub>′( )</sub><sub><</sub><sub>0</sub> <sub>implying that information reduces</sub>
the perceived variance in the return to saving and assuming that the cost of saving
does not affect the variance in returns.<i>ρiyF</i>(<i>sit</i>) is the correlation between income
and the returns to saving. Assuming that returns are independent of income shocks
this correlation will be zero.
Solving the optimization problem yields:
(6) <i><sub>F</sub></i> <i>I</i> <i>I</i>
<i>R</i> <i>I</i>
<i>it</i>
<i>i</i> <i>it</i> <i>i</i> <i>it</i>
<i>i</i> <i>Fi</i> <i>it</i>
+1= +
( )
2<sub>( )</sub>
−( )
1
* γ η .
σ
The model predicts that the level of formal saving, <i>F<sub>it</sub></i>*<sub>+</sub><sub>1</sub>, will be an increasing
function of the return to saving, γ<i><sub>i</sub></i>
( )
<i>I<sub>it</sub></i> and a decreasing function of the cost ofsaving η<i>i</i>
( )
<i>Iit</i> .<i>Fit</i>*+1will also be a decreasing function of the variance in the returnto saving σ<i>Fi</i> <i>Iit</i>
2
<sub>( )</sub>
<sub>and the level of risk aversion</sub> <i><sub>R</sub></i><i>i</i>.4 In this model, information
plays an important role in determining the level of formal saving. As outlined in
Section 1, we hypothesize that the social network that results from Women’s
Union membership transmits information on how to save formally and on the
various ways in which households can save to yield a return, thus filling an
information gap. According to our model, this information reduces the cost of
saving in formal financial institutions, η<i>i</i>
( )
<i>Iit</i> , increases the perceived returnγ<i>i</i>
( )
<i>Iit</i> , and reduces the perceived variance in returnsσ<i>Fi</i> <i>Iit</i>2
<sub>( )</sub>
<sub>. Each mechanism will</sub>lead to an increase in the level of formal saving.
4<i><sub>R</sub></i>
<i>i</i>represents the coefficient of relative risk aversion and since the model is restricted by the
</div>
<span class='text_page_counter'>(8)</span><div class='page_container' data-page=8>
3. EmpiricalConsiderations
Following from the theoretical model, the baseline, reduced form, savings
equation is given by:
(7) <i>F<sub>it</sub></i> <sub>=</sub>α β<i><sub>i</sub></i><sub>+</sub> <sub>1</sub><i>FS<sub>it</sub></i><sub>−</sub><sub>1</sub><sub>+</sub>b<sub>2</sub><b>CS</b><i><sub>it</sub></i><sub>−</sub><sub>1</sub><sub>+</sub>b<sub>3</sub><b>Z</b><i><sub>it</sub></i><sub>+</sub>β<sub>4</sub><i>s<sub>it</sub></i><sub>+</sub><i>v<sub>it</sub></i>,
where<i>Fit</i>is the level of formal savings of household<i>i</i>at time<i>t</i>;<i>FSit−</i>1is the stock of
formal savings at the beginning of the period;<b>CSit−</b>1is a vector of different types of
informal savings including cash held at home at the beginning of the period;<b>Zit</b>is
a vector of household and regional characteristics that proxy the cost of savings;
<i>sit</i>are losses to household income as a result of external shocks;<i>αi</i>are household
fixed effects to control for unobserved household heterogeneity; and<i>vit</i>is the time
varying unobserved error term.5<sub>The stocks of savings variables are included as a</sub>
measure of household wealth at the beginning of the period.
Information is transmitted through the social network formed by active
par-ticipation in Women’s Union meetings and we proxy the “quality” of the
infor-mation transmitted through the network using the observed savings behavior of
group members. We consider the networks with a greater level of formal savings to
be higher quality branches and so extend the reduced form to include the average
stock of formal savings of other members within the commune (computed
exclud-ing household<i>i</i>) and use two lags to ensure that this variable is exogenous to the
behavior of members in period<i>t</i>(<i>FSn−i</i>,<i>t−</i>2). Since it is also possible that branches
contain poor quality information we also include the average stock of informal
savings of members to proxy lower quality networks (<i>ISn−i</i>,<i>t</i>−2). This does not imply
that informal savings are undesirable but are sub-optimal from the perspective of
encouraging formal financial participation, and this takes account of the fact that
there will be heterogeneity in the quality of information that members of different
local branches of the Women’s Union possess. We consider the possibility that
both good and bad information can be shared through the social network that
results from active participation in Women’s Union meetings.
The revised reduced form is given by equation (8):
(8) <i>Fit</i> =α λ<i>i</i>+ 1<i>FSn i t</i>− −, 2+λ2<i>ISn i t</i>− −, 2+β1<i>FSit</i>−1+b2<b>CS</b><i>it</i>−1+b3<b>Z</b><i>it</i>+β4<i>siit</i>+<i>vit</i>.
According to our theoretical predictions we would expect:<i>λ</i>1>0 (members of
high-quality networks have higher levels of formal savings), <i>λ</i>2≤0 (members of
low-quality networks have lower levels of formal savings or are no different in
terms of their level of formal savings),<i>β</i>1>0 (households that already hold a high
stock of formal saving will have greater certainty about the returns and so will save
more in this form),<b>β</b>2<0 (households with a greater stock of other savings types
are more uncertain about formal savings and so will save less in this form).
The key challenge in estimating this model is controlling for omitted
vari-ables that are potentially correlated with the network effect as discussed by
Manski (1993, 2000), Brock and Durlauf (2001), and Aizer and Currie (2004).
5<sub>The model is estimated using a fixed effects estimator with clustered standard errors at the</sub>
</div>
<span class='text_page_counter'>(9)</span><div class='page_container' data-page=9>
First, there may be self-selection into the Women’s Union. While membership of
the Women’s Union in Vietnam is based on signing up to a set of socio-political
ideals rather than on availing of facilities offered by the group such as financial
advice or savings facilities, it may still be that there are unobserved
character-istics of members that are correlated with membership and savings behavior.
The consequence for the empirical model would be that the unobserved factors
that determine the household’s level of formal savings may be the same as those
that determine the probability that the household is an active member of the
Women’s Union. To control for these factors we use fixed effects estimation
to eliminate any unobserved household specific effects that may influence both
the level of formal savings and the probability that the household is an active
Women’s Union member. Moreover, since we are interested in the behavior of
members and not selection into the Women’s Union, we estimate the model for
active members only and run tests for sample selection bias using Wooldridge’s
(1995) approach.
Second, there may be simultaneity between individual behavior and the
behavior of Women’s Union members, also referred to as Manski’s (1993)
reflec-tion problem. We correct for reflexivity by defining the network variable as the
average stock of formal savings by other group members at time<i>t</i>−2, excluding
the stock of saving held by household <i>i</i>,<i>FSn−i</i>,<i>t−</i>2. Aizer and Currie (2004) use a
similar approach.
Third, the network effect may be confounded with correlated effects such
as behavioral changes due to common exogenous shocks. To control for these
effects we include the average level of savings within the commune in period <i>t</i>
(computed excluding the savings level of household <i>i</i>), the average stock of
savings in the district at the beginning of period <i>t</i>, and other time varying
commune characteristics such as the number of banks and the proportion of
poor households.
</div>
<span class='text_page_counter'>(10)</span><div class='page_container' data-page=10>
4. Data
Data are taken from the Vietnam Access to Resources Household Survey
(VARHS) implemented in 2006, 2008, and 2010 in 12 provinces in Vietnam. The
survey was developed in collaboration between the Development Economics
Research Group (DERG), Department of Economics, University of Copenhagen,
and the Central Institute of Economic Management (CIEM), the Institute for
Labour Studies and Social Affairs (ILSSA), and the Institute of Policy and
Strat-egy for Agriculture and Rural Development (IPSARD), Hanoi, Vietnam. The
full panel of 2200 households is spread over 456 communes and 131 districts.
Along with detailed demographic information on household members, the survey
includes sections on financial behavior, in particular in relation to savings and
borrowing. Due to the absence of total expenditure data we cannot use the
standard “income minus expenditure” measure of saving. Instead, we focus our
investigation on self-reported levels of saving.
We recognize that misreporting of financial information is a common
criti-cism of survey data of this kind. To ensure that the data collected are reliable, we
ask households about their stock of saving at the beginning of the year, at the end
of the year, and how much they saved during the year to check that they are
providing consistent information. For income data we ask separately about
income from different sources in different sections of the questionnaire and sum
these up to get our measure of household income. It is possible, however, that
some households’ financial information is measured with error. Measurement
error in our dependent variable (formal savings) will only affect the econometric
estimation if it is correlated with the regressors. Given that we control for
house-hold fixed effects, which absorbs any time invariant househouse-hold specific
measure-ment error, this will only be the case if the extent of misreporting for any given
household varies across different financial variables (different forms of saving or
income) or over time, which is unlikely. Moreover, it will not be correlated with the
social capital measure, given that this is computed net of the information on the
household in question.
The supply of institutional saving services for rural households is estimated to
cover 65 percent of the poorest quarter of the population (ILO, 2007).6<sub>This is also</sub>
reflected in our data which cover the more rural and remote provinces in Vietnam.
In 2006, 36 percent of communes included in the sample had a state bank located
in their commune while 19 percent had access to other types of credit organizations
including People’s Credit Funds and international organizations. However, 93
percent of the communes report having access to formal savings deposits through
institutions located outside of the commune. Access within communes increased
over the timeframe of our data, with 57 percent of communes having a state bank
in 2008 and 67 percent in 2010.
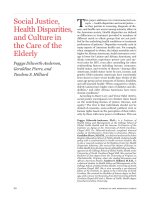
Table 1 provides a description of the savings behavior of households in our
sample. Total savings includes formal savings (i.e., postal savings, savings in
state-owned commercial banks, private banks, and credit organizations) and two
6<sub>Saving services are offered by five state-owned commercial banks, one social policy bank, one post</sub>
</div>
<span class='text_page_counter'>(11)</span><div class='page_container' data-page=11>
types of informal savings—savings in rotating savings and credit associations or
through private money lenders, and saving at home in the form of cash, gold, and
jewelry. The dominant form of saving is cash, gold, and jewelry held at home
(43 percent of households in 2006, 37 percent in 2008, and 52 percent in 2010). The
proportion of households with savings in formal financial institutions is very small
at around 5 percent each year, despite the extensive coverage of formal financial
institutions in these rural areas.
We define the network on the basis of whether individuals within
house-holds are<i>active</i>members of Women’s Union branches within communes. Active
members are those that participate in meetings on a regular basis and they amount
to approximately 50 percent of households in our sample in each year. Each
household member was asked whether they are a member of any groups,
organi-zations, or associations. They are then asked to specify the type of organization
from a list which includes as an option the Women’s Union. Individuals are then
asked: “Do you participate in meetings: (1) Almost Always; (2) Sometimes; (3)
Rarely/Never.” Households in which individuals respond “Almost Always” to
participation in Women’s Union meetings are considered to be members of the
network. Stone<i>et al</i>. (2003) combine many different measures of social capital to
define an individual’s social capital profile across multiple dimensions. In this
study, we isolate one aspect of social capital: the institutional and societal
rela-tionships established through Women’s Union membership. Our measure closely
aligns with Stone <i>et al</i>.’s (2003) operationalization of this dimension of social
capital—they use the number of group memberships an individual has and the
breadth of institutional ties.
An active organization is present in almost all communes. Table 1 describes
the savings behavior of active Women’s Union members. Members are more
TABLE 1
HouseholdSavingsBehavior
Total Savings (%) Formal (%) Informal (%) Home (%)
% hhs who save (2006) 53.8 4.9 12.9 43.4
% hhs who save (2008) 43.0 4.0 5.3 36.7
% hhs who save (2010) 60.7 5.7 10.5 52.4
<i>For saving households:</i> ’000 VND of which %: of which %: of which %:
Average (2006) 11,465 7.3 19.4 73.3
Average (2008) 17,062 8.0 10.2 81.8
Average (2010) 14,085 7.7 13.0 79.3
Women’sUnionMembership andSavings
Total Savings (%) Formal (%) Informal (%) Home (%)
% members who save (2006) 56.0 5.8 13.9 44.8
% members who save (2008) 46.9 3.7 5.1 40.7
% members who save (2010) 63.2 5.6 13.7 53.3
<i>For saving member households:</i> ’000 VND of which %: of which %: of which %:
Average (2006) 12,437 8.5 19.8 71.7
Average (2008) 15,640 6.5 9.3 84.2
Average (2010) 12,989 6.8 16.5 76.6
<i>Note</i>: All value figures are adjusted for inflation and are expressed in 2010 VND.
</div>
<span class='text_page_counter'>(12)</span><div class='page_container' data-page=12>
likely to save than other households in all years (see top panel of Table 1 for
comparison), although the difference is not statistically significant. The
compo-sition of savings of members is, on average, different to that of non-members,
suggesting that members and non-members do behave differently. These
differ-ences also vary over time, suggesting that the portfolio of savings of active
members of the Women’s Union is more changeable than the average behavior of
households in the sample. For example, in 2006 formal savings make up a greater
proportion of savings of members than for other households, while in 2008 and
2010 this proportion is slightly smaller for members than the average for all
households.
A description of all variables included in the model is presented in the online
Appendix, together with means and standard deviations.7<sub>Since lags are required</sub>
for the construction of the network variable, only data from 2008 and 2010 are
used.8<sub>The trends in the raw data reveal an increase in the level of savings of all</sub>
types, particularly formal saving. The stock of formal savings of Women’s Union
members (the network variable) is higher in 2010 than in 2008, suggesting that
the “quality” of the Women’s Union network increased. Consistent with this we
find that the stock of informal savings of Women’s Union members declined
between these years. The extent to which the savings behavior of Women’s Union
branches impacts on the savings behavior of its members is explored empirically
in Section 5.
5. EconometricResults
5.1. <i>Empirical Results</i>
Our theoretical model demonstrates that one mechanism through which
Women’s Union membership can impact on the financial decision-making of
households is through correcting for information asymmetries that prevent
house-holds from either accessing, or understanding the merits of depositing their savings
with, formal financial institutions. Social norms may lead group members to
behave in a similar way; however, we can not identify the exact mechanism
through which information spillovers occur. In our empirical analysis both herd
behavior or demonstration effects and actual learning are consistent with the
information channel as we capture it. Regardless of which mechanism is at work,
we hypothesize that the average behavior of members of a branch of the Women’s
Union will have an impact on the behavior of its active members. If so, there may
be a role for disseminating information on formal savings through the Women’s
Union.
7<sub>There is a lot of variation in the levels of savings and income of households as revealed by the large</sub>
standard deviations reported in the online Appendix. While there are a small number of outliers in the
data, the results of our analysis are robust to their exclusion.
8<sub>Our data are collected at two-year intervals but include the stock of savings at the beginning and</sub>
</div>
<span class='text_page_counter'>(13)</span><div class='page_container' data-page=13>
We estimate the model given in equation (8) to ascertain the relationship
between the “quality” of the network, in terms of its potential for disseminating
information regarding (or demonstrating the advantages of ) formal savings
behavior, and the savings levels of its members. All variables expressed in
Vietnamese Dong (VND) are scaled by 1,000 before inclusion in the model. The
model is estimated by taking a within-transformation of the data to eliminate
the time invariant household heterogeneity prior to the estimation of the
model.9 <sub>Standard errors are clustered at the household level and are robust to</sub>
heteroscedasticity.
As discussed in Sections 3 and 4, the network variables are measured as
the average stock of formal savings (to capture high-quality networks),
and informal savings (to capture low-quality networks), of active Women’s
Union members within the commune two years previously. For each household
member their own stock of savings is excluded from the computation of their
average stock measure. As highlighted by Stone <i>et al</i>. (2003), the structure of
networks may also be important and so we control for differences in the density
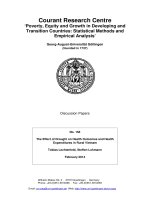
of groups. We estimate the model for group members only. Results are presented
in Table 2.
Column (1) reveals that being a member of a high-quality network has a
positive and significant effect on the savings level of individual members. This
result is robust to the inclusion of the interaction terms between the density of the
group and the network variables (column (2)), although the magnitude and
sta-tistical significance of the result is somewhat reduced. In this model we control for
household fixed effects, commune level characteristics, the average savings
behav-ior in the commune, and time varying household characteristics.10<sub>Moreover, given</sub>
our focus on group members, the identification of the network effect comes from
the variation within households, and consequently within groups, over time. This
result therefore provides support for the hypothesis that the savings behavior
of households is influenced by that of other group members. The coefficient of
0.19 implies that for every VND1 million increase in the stock of group formal
savings (excluding household member<i>i</i>), savings of household member<i>i</i>increase
by VND190,000 on average. We find no evidence that households in low-quality
groups are induced to save less.
Disaggregating by type of saving we find that being in a high-quality group
has a positive and significant effect on <i>formal</i> household savings (column (3)),
further supporting our hypothesis.11<sub>In this case, however, the result is not robust</sub>
to the inclusion of the interaction terms between group density and the network
variables (column (4)). Once interaction terms are included, being in a low-quality
9<sub>We estimate the fixed effects model using the econometric software package Stata V.10 using the</sub>
command<i>xtreg</i>.
10<sub>Results for the control variables are available on request.</sub>
11<sub>The equations for formal, informal, and home savings are estimated independently including the</sub>
</div>
<span class='text_page_counter'>(14)</span><div class='page_container' data-page=14></div>
<span class='text_page_counter'>(15)</span><div class='page_container' data-page=15>
group has a significant negative effect on formal saving. This suggests that network
effects matter for households’ choice of savings but also that the quality of the
network is an important factor.
While we are less concerned here about the influence that networks have on
informal savings and home savings, column (6) implies a negative marginal effect
of high-quality networks on informal saving at the mean (−0.003).12 <sub>Although</sub>
small in magnitude, this suggests that in high-quality networks households
save less informally (as one might expect), particularly in networks with fewer
members. This provides further support for the hypothesis that good information
on the merits of formal savings or good behavior can be transmitted through
high-quality networks. In columns (7) and (8), however, we find that members of
high-quality networks also save more in the form of cash held at home. This
suggests that the transmission of good information through the network could also
impact on less desirable forms of saving, such as cash saving. Alternatively, there
may be complementarities in saving types for those who save more formally as
they might also choose to save more cash.
Overall, we find that in high-quality networks members save more formally.
Another indicator of how productive savings are is what the household is actually
saving for. As a check on the validity of our results we consider the extent to which
the behavior of the network impacts on households’ reported reasons for saving.
In the VARHS, households report two reasons for saving. The options given
are: 1. Protection against bad harvest and other natural disasters; 2. Healthcare
expenses; 3. Cost of education; 4. Purchase of agricultural inputs; 5. Provision for
old age; 6. Accumulation for other big expenditures; 7. Profit-making investment;
8. Other. These are condensed into five categories for the purpose of our analysis:
risk coping, investment, education, retirement, and consumption. We estimate
fixed effects linear probability models for each category for group members,
including the same set of variables as in our core model. Results are presented in
Table 3.
The quality of the network is not found to have any effect on household
savings for risk-coping, education, or retirement, suggesting that precautionary
and lifecycle savings are not influenced by the behavior of groups. We find,
however, that members of high-quality networks are more likely to save for
productive investment purposes. This provides further support for our hypothesis
that informed group behavior can have a positive effect on the behavior of group
members, encouraging them to save formally and for productive purposes.
5.2. <i>Robustness Checks</i>
Given the empirical challenges in identifying the network effects (see
discus-sion in Section 3), we perform a range of robustness checks. First, we check that
the result is not driven by sample selection into group membership, that is, the
possibility that it is the characteristics of group membership that drive the positive
12<sub>The marginal effect takes into account the network effect and its interaction with the density of</sub>
</div>
<span class='text_page_counter'>(16)</span><div class='page_container' data-page=16>
relationship between formal group savings and household savings and not the flow
of information and peer group effects.
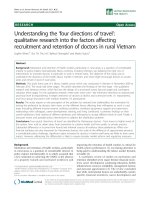
Table 4 (columns (1) to (4)) presents the results of Wooldridge’s (1995) sample
selection test for use with panel data. In the first stage, probit models of group
membership are estimated separately for 2008 and 2010, including all households
that could potentially be active Women’s Union members (i.e., all households that
contain at least one adult female). The determinants of group membership include
household characteristics, commune characteristics, and group characteristics.
For identification we also include an indicator of whether or not the household
has personal friends in office or in trusted positions within the commune. In both
first stage models this variable is statistically significant. The estimates are used
to construct an inverse Mills ratio for each observation in each year and this is
included as an additional regressor in the fixed effects savings model.13<sub>The inverse</sub>
Mills ratio is not statistically significant in the second stage regression, implying
that sample selection can be ruled out. Furthermore, our core results for total
savings and formal savings hold.
A second empirical concern relates to Manski’s (1993) reflection problem. To
overcome this problem we measure the quality of the network as the average stock
of savings two years prior to the year under consideration. This is computed
excluding information on the household in question. However, as an additional
robustness check we estimate the model for a reduced sample of households who
became active Women’s Union members in either 2008 or 2010 on the basis that
13<sub>Results for the first stage selection equations are available on request.</sub>
TABLE 3
Women’sUnionNetworkEffects onSavingsPurpose ofGroupMembers
Risk Invt Ed. Retire. Cons.
(1) (2) (3) (4) (5)
Network (formal) 0.003
(0.002)
0.005***
(0.002)
0.001
(0.002) −
0.002
(0.002) −
0.002
(0.002)
Network (informal) 0.002
(0.008)
0.005
(0.007) −
0.002
(0.008) −
0.005
(0.005)
0.006
(0.010)
Density 0.006
(0.006)
0.0004
(0.005)
0.009**
(0.004)
0.005
(0.003) −
0.012***
(0.004)
Network (formal) · Density −0.0001**
(0.00005) −
0.00004
(0.00004) −
0.00003
(0.00003) −
0.00003
(0.00003)
0.0001***
(0.00004)
Network (informal) · Density −0.0001
(0.0004) −
0.0003
(0.0003)
0.0001
(0.0004)
0.0003
(0.0003)
0.0005
(0.0005)
Household fixed effects Yes Yes Yes Yes Yes
R2<sub>within</sub> <sub>0.064</sub> <sub>0.096</sub> <sub>0.109</sub> <sub>0.046</sub> <sub>0.294</sub>
R2<sub>between</sub> <sub>0.014</sub> <sub>0.023</sub> <sub>0.021</sub> <sub>0.001</sub> <sub>0.098</sub>
R2<sub>overall</sub> <sub>0.019</sub> <sub>0.040</sub> <sub>0.034</sub> <sub>0.004</sub> <sub>0.137</sub>
Households 1433 1433 1433 1433 1433
Observations 2011 2011 2011 2011 2011
<i>Notes</i>: Standard errors are clustered at the household level and are given in parentheses.
*** denotes significance at the 1% level, ** denotes significance at the 5% level, * denotes significance
at the 10% level. All baseline controls are included along with time dummies. The density variable is
scaled by 100 for ease of illustration.
</div>
<span class='text_page_counter'>(17)</span><div class='page_container' data-page=17></div>
<span class='text_page_counter'>(18)</span><div class='page_container' data-page=18>
they could not have any influence on the group’s behavior two years previously.
Table 4 (columns (5) to (8)) reveals that the main result holds, even though the
sample size is greatly reduced. Being in a higher-quality network impacts on
overall savings levels (see column (5)) and the level of formal savings (see column
(7)) and in the case of formal savings is of an even greater magnitude.14
Third, if the observed effect is truly a within group effect, then the quality of
the local network should not have any effect on the savings behavior of
non-members. We estimate the model for only non-member households, including
households that could potentially be members (i.e., have at least one adult female
member). The results are presented in Table 5 (columns (1) to (4)) and reveal that
high-quality networks within a commune have no effect on the overall or formal
savings behavior of non-member households. Moreover, in communes with
low-quality networks (i.e., a greater level of informal savings), non-member households
save less formally. This is not surprising given that informal savings arrangements
between members of women’s groups are unlikely to be exclusive within
com-munes, which leads to higher levels of informal savings, and consequently lower
levels of formal saving, in the commune as a whole.
Fourth, we examine the possibility that high-quality savings behavior within
communes by non-members (i.e., higher levels of formal savings) could equally
have an effect on the savings of network members. This is conducted to check the
possibility that the network effect we observe is simply due to changes in general
market conditions or other exogenous factors affecting all households that are not
controlled for in the model. The quality of the non-member network is measured
as the average stock of formal savings of non-members two years previous to the
year of analysis. As revealed in Table 5 (columns (5) to (8)) there is no evidence to
suggest that high-quality non-member networks have any influence on the savings
behavior of member households. In contrast, we do find some spillover effects
where non-member networks are of lower quality (i.e., are characterized by a
higher stock of informal savings). This is consistent with our previous finding that
informal savings networks are likely to extend beyond group boundaries.
6. Conclusion
Savings at the household level in rural communities in developing countries
are hindered by the fact that financial markets are not particularly well developed
and many households either do not possess the information required to set up
formal deposit accounts or are uncertain about the returns to saving formally. As
a result, households often opt to hold their savings in the form of cash held at
home, an insecure form of saving that does not yield a return, or rely on other
informal savings possibilities. This is sub-optimal; formal savings are an important
means of financing productive investment.
In this study, we have explored the extent to which social networks formed by
active membership of the Women’s Union in rural Vietnam can play a role in
14<sub>This result is not robust to the inclusion of the interaction effects between the network variables</sub>
</div>
<span class='text_page_counter'>(19)</span><div class='page_container' data-page=19></div>
<span class='text_page_counter'>(20)</span><div class='page_container' data-page=20>
increasing formal savings where potential knowledge gaps exist. Accordingly, our
aim was to provide evidence of a potentially important impact of social capital in
economic decision making where information failures prevent economic agents
from behaving in an optimal way.
Our theoretical model predicts that by disseminating information through the
social networks formed by active participation at meetings, or through members
demonstrating good savings behavior, the Women’s Union can fill an information
gap on the merits of saving formally. This is achieved by reducing uncertainties
about the riskiness of returns and reducing the costs associated with opening a
savings account. The empirical evidence presented supports this prediction. In
particular, our analysis revealed that membership of high-“quality” branches of the
Women’s Union leads to higher levels of formal savings and higher levels of savings
for productive purposes. These findings are also robust to a range of alternative
specifications, samples, and tests that address the various empirical issues which
arise in identifying network effects. They include selection into group membership
and reflexivity between household and group behavior, amongst others.
More generally, our results suggest the Women’s Union can, at least to some
extent, fill the role of formal institutions in enhancing the knowledge of individuals
at local level. Targeting information on the benefits of saving in financial
institu-tions through organizainstitu-tions of this kind would be effective in increasing formal
savings at grassroots level. At the same time, ensuring that the information
dis-seminated by the Women’s Union is both accurate and desirable is important
given that behavioral effects are also found in low-quality networks.
To conclude, we found strong evidence that network effects matter for
house-hold savings behavior and we made every effort in our analysis to control for
unobserved factors that may influence the savings behavior of households and
networks simultaneously. We acknowledge there may still be unobserved time
varying factors that were not captured as is always the case with observational
data. Moreover, with observational data we cannot uncover the mechanisms
through which the network effect operates. Future research will address both of
these issues through the use of a carefully designed experiment and randomized
control trial techniques.
References
Aizer, A. and J. Currie, “Networks or Neighbourhoods? Correlations in the Use of Publicly-Funded
Maternity Care in California,”<i>Journal of Public Economics</i>, 88, 2573–85, 2004.
Akerlof, G. A., “A Theory of Social Custom of which Unemployment may be One Consequence,”
<i>Quarterly Journal of Economics</i>, XCV, 749–75, 1980.
Ballinger, T. P., M. G. Palumbo, and N. T. Wilcox, “Precautionary Saving and Social Learning Across
Generations: An Experiment,”<i>Economic Journal</i>, 113, 920–47, 2003.
Banerjee, A. V., “A Simple Model of Herd Behaviour,” <i>Quarterly Journal of Economics</i>, CVII,
797–818, 1992.
Banerjee, A. V. and E. Duflo, “The Economic Lives of the Poor,”<i>Journal of Economic Perspectives</i>, 21,
141–67, 2007.
Bertrand, M., E. F. P. Luttmer, and S. Mullainathan, “Network Effects and Welfare Cultures,”
<i>Quarterly Journal of Economics</i>, 115, 1019–55, 2000.
Bikhchandani, S., D. Hirshleifer, and I. Welch, “A Theory of Fads, Fashion, Custom, and Cultural
Change in Informational Cascades,”<i>Journal of Political Economy</i>, 100, 992–1026, 1992.
Bowles, S. and H. Gintis, “Social Capital and Community Governance,” <i>Economic Journal</i>, 112,
</div>
<span class='text_page_counter'>(21)</span><div class='page_container' data-page=21>
Brock, W. A. and S. N. Durlauf, “Interactions Based Models,” in J. Heckman and E. Leamer (eds),
<i>Handbook of Econometrics</i>, Vol. 5, North-Holland, Amsterdam, 2001.
Browning, M. and A. Lusardi, “Household Saving: Micro Theories and Micro Facts,”<i>Journal of</i>
<i>Economic Literature</i>, 34, 1797–855, 1996.
Coate, S. and M. Ravallion, “Reciprocity Without Commitment: Characterization and Performance of
Informal Insurance Arrangements,”<i>Journal of Development Economics</i>, 40, 1–24, 1993.
Cole, S., X. Giné, J. Tobacman, P. Topalova, R. Townsend, and J. Vickery, “Barriers to Household
Risk Management: Evidence from India,” Staff Report No. 373, Federal Reserve Bank of New
York, 2009.
Coleman, J., “Social Capital in the Creation of Human Capital,”<i>American Journal of Sociology</i>, 94,
95–120, 1988.
Deaton, A., “Saving and Liquidity Constraints,”<i>Econometrica</i>, 59, 1221–48, 1991.
———, “Household Saving in LDCs: Credit Markets, Insurance and Welfare,”<i>Scandinavian Journal</i>
<i>of Economics</i>, 94, 253–73, 1992.
Dupas, P. and J. Robinson, “Savings Constraints and Microenterprise Development: Evidence from a
Field Experiment in Kenya,” Working Paper 14693, NBER Working Paper Series, 2009.
Fafchamps, M., “Development and Social Capital,”<i>Journal of Development Studies</i>, 42, 118–98, 2006.
Fafchamps, M. and J. Pender, “Precautionary Saving, Credit Constraints, and Irreversible Investment:
Theory and Evidence from Semi-Arid India,”<i>Journal of Business and Economic Statistics</i>, 15,
180–94, 1997.
Fafchamps, M., C. R. Udry, and K. Czukas, “Drought and Saving in West Africa: Are Livestock a
Buffer Stock?”<i>Journal of Development Economics</i>, 55, 273–305, 1998.
Foster, A. D. and M. Rosenzweig, “Learning by Doing and Learning from Others: Human Capital and
Technical Change in Agriculture,”<i>Journal of Political Economy</i>, 103, 1176–209, 1995.
———, “Imperfect Commitment, Altruism and the Family: Evidence from Transfer Behaviour in
Low-Income Rural Areas,”<i>Review of Economics and Statistics</i>, 83, 389–407, 2001.
Gersovitz, M., “Saving and Development,” in H. Chenery and T. N. Srinivasan (eds),<i>Handbook of</i>
<i>Development Economics</i>, Vol. 2, North-Holland, New York, 1988.
Guiso, L., P. Sapienza, and L. Zingales, “The Role of Social Capital in Financial Development,”
<i>American Economic Review</i>, 94, 526–56, 2004.
ILO (International Labour Organization), <i>Expanding Access to Insurance and Savings Services in</i>
<i>Vietnam</i>, International Labour Organization, Hanoi, 2007.
Ligon, E., J. P. Thomas, and T. Worrall, “Informal Insurance Arrangements with Limited Commitment:
Theory and Evidence from Village Economies,”<i>Review of Economic Studies</i>, 69, 209–44, 2002.
Manski, C. F., “Identification of Endogenous Social Effects: The Reflection Problem,”<i>Review of</i>
<i>Economic Studies</i>, 60, 531–42, 1993.
———, “Economic Analysis of Social Interactions,”<i>Journal of Economic Perspectives</i>, 14, 115–36,
2000.
Olken, B., “Do Television and Radio Destroy Social Capital? Evidence from Indonesian Villages,”
<i>American Economic Journal: Applied Economics</i>, 1, 1–33, 2009.
Putnam, R. D.,<i>Making Democracy Work: Civic Traditions in Modern Italy</i>, Princeton University Press,
Princeton, NJ, 1993.
Rosenzweig, M., “Savings Behaviour in Low-Income Countries,”<i>Oxford Review of Economic Policy</i>,
17, 40–54, 2001.
Stone, W., M. Gray, and J. Hughes, “Social Capital at Work: How Family, Friends and Civic Ties
Relate to Labour Market Outcomes,” Research Paper No. 31, Australian Institute of Family
Studies, 2003.
Townsend, R. M., “Risk and Insurance in Village India,”<i>Econometrica</i>, 62, 539–91, 1994.
Udry, C. R., “Risk and Insurance in a Rural Credit Market: An Empirical Investigation in Northern
Nigeria,”<i>Review of Economic Studies</i>, 61, 495–526, 1994.
———, “Risk and Saving in Northern Nigeria,”<i>American Economic Review</i>, 85, 1287–300, 1995.
Wainwright, F. and C. Newman, “Income Shocks and Household Risk Coping Strategies: Evidence
from Vietnam,” Discussion Paper No. 358, IIIS Discussion Paper Series, 2011.
Wooldridge, J., “Selection Corrections for Panel Data Models under Conditional Mean Independence
Assumptions,”<i>Journal of Econometrics</i>, 68, 115–32, 1995.
SupportingInformation
Additional Supporting Information may be found in the online version of this article at the
publisher’s web-site:
</div>
<!--links-->