PHÂN TÍCH NGUYÊN TỐ VẾT LẮNG ĐỌNG TRONG KHÔNG KHÍ QUA RÊU BARBULA INDICA TẠI THÀNH PHỐ BẢO LỘC SỬ DỤNG KỸ THUẬT HUỲNH QUANG TIA X PHẢN XẠ TOÀN PHẦN
Bạn đang xem bản rút gọn của tài liệu. Xem và tải ngay bản đầy đủ của tài liệu tại đây (640.98 KB, 12 trang )
<span class='text_page_counter'>(1)</span><div class='page_container' data-page=1>
<b>ANALYSIS OF TRACE ELEMENT ATMOSPHERIC DEPOSITION </b>
<b>BY BARBULA INDICA MOSS AT BAOLOC USING THE TOTAL </b>
<b>REFLECTION X-RAY FLUORESCENCE TECHNIQUE </b>
<b>Nguyen An Sona*<sub>, Doan Phan Thao Tien</sub>b<sub>, Le Hong Khiem</sub>c<sub>, Nguyen Thi Minh </sub></b>
<b>Sanga<sub>, Nguyen Thi Nguyet Ha</sub>a<sub>, Pham Thi Ngoc Ha</sub>a<sub>, Pham Dang Quyet</sub>a<sub>, Nguyen </sub></b>
<b>Dinh Trunga<sub>, Ho Huu Thang</sub>d<sub>, Nguyen Truong Duong Cam</sub>a</b>
<i>a<sub>The Faculty of Physics and Nuclear Engineering, Dalat University, Lamdong, Vietnam </sub></i>
<i>b<sub>Nhatrang Institute of Technology Research and Application, Khanhhoa, Vietnam </sub></i>
<i>c<sub>The Institute of Physics of Vietnamese Academy of Science and Technology, Hanoi, Vietnam </sub></i>
<i>d<sub>Nuclear Research Institute, Lamdong, Vietnam </sub></i>
<i>*<sub>Corresponding author: </sub></i>
<b>Article history </b>
Received: April 7th<sub>, 2020 </sub>
Received in revised form (1st<sub>): May 28</sub>th<sub>, 2020 | Received in revised form (2</sub>nd<sub>): September 21</sub>st<sub>, 2020 </sub>
Accepted: September 24th<sub>, 2020 </sub>
<b>Abstract </b>
<i>In this investigation, the Total Reflection X-ray Fluorescence (TXRF) technique detected 24 </i>
<i>elements: Al, P, S, Cl, K, Sr, Sc, Ti, Mn, Fe, Co, Cu, Zn, As, Br, Ba, La, Eu, Tb, Dy, Ta, Pb, </i>
<i>Th, and U in Barbula indica moss collected at Baoloc (Vietnam) from November 2019 to </i>
<i>March 2020. Factor analysis was used to explain contamination sources at the sampling </i>
<i>sites. This study showed that the passive moss biomonitoring and TXRF techniques are </i>
<i>efficient and very suitable for detecting trace elements due to atmospheric deposition in </i>
<i>developing countries, especially Vietnam and some Asian countries. </i>
<b>Keywords</b>: Atmospheric deposition; Baoloc; Barbula indica; TXRF.
</div>
<span class='text_page_counter'>(2)</span><div class='page_container' data-page=2>
<b>PHÂN TÍCH NGUYÊN TỐ VẾT LẮNG ĐỌNG TRONG KHƠNG </b>
<b>KHÍ QUA RÊU BARBULA INDICA TẠI THÀNH PHỐ BẢO LỘC SỬ </b>
<b>DỤNG</b>
<b>KỸ THUẬT HUỲNH QUANG TIA X PHẢN XẠ TỒN PHẦN</b>
<b>Nguyễn An Sơna*<sub>, Đồn Phan Thảo Tiên</sub>b<sub>, Lê Hồng Khiêm</sub>c<sub>, Nguyễn Thị Minh </sub></b>
<b>Sanga<sub>, Nguyễn Thị Nguyệt Hà</sub>a<sub>, Phạm Thị Ngọc Hà</sub>a<sub>, Phạm Đăng Quyết</sub>a<sub>, Nguyễn </sub></b>
<b>Đình Trunga<sub>, Hồ Hữu Thắng</sub>d<sub>, Nguyễn Trương Dương Cầm</sub>a</b>
<i>a<sub>Khoa Vật lý và Kỹ thuật hạt nhân, Trường Đại học Đà Lạt, Lâm Đồng, Việt Nam </sub></i>
<i>b<sub>Viện nghiên cứu và ứng dụng công nghệ Nha Trang, Khánh Hòa, Việt Nam </sub></i>
<i>c<sub>Viện Vật lý, Hà Nội, Việt Nam </sub></i>
<i>d<sub>Viện Nghiên cứu hạt nhân, Lâm Đồng, Việt Nam </sub></i>
<i>*<sub>Tác giả liên hệ: Email: </sub></i>
<b>Lịch sử bài báo </b>
Nhận ngày 07 tháng 4 năm 2020
Chỉnh sửa lần 1 ngày 28 tháng 5 năm 2020 |Chỉnh sửa lần 2 ngày 21 tháng 9 năm 2020
Chấp nhận đăng ngày 24 tháng 9 năm 2020
<b>Tóm tắt</b>
<i>Trong nghiên cứu này, kỹ thuật huỳnh quang tia X phản xạ toàn phần (TXRF) được ứng dụng </i>
<i>đã xác định được 24 nguyên tố, bao gồm: Al, P, S, Cl, K, Sr, Sc, Ti, Mn, Fe, Co, Cu, Zn, As, </i>
<i>Br, Ba, La, Eu, Tb, Dy, Ta, Pb, Th, và U trên rêu Barbula Indica tại thành phố Bảo Lộc (Việt </i>
<i>Nam) từ tháng mười một năm 2019 đến tháng ba năm 2020. Kết quả cũng đã dự đốn những </i>
<i>nguồn ơ nhiễm mang lại. Ở nghiên cứu này cho thấy việc sử dụng mẫu rêu có sẵn, và kỹ thuật </i>
<i>TXRF là hiệu quả, rất thuận lợi để xác định sự lắng động các nguyên tố vết trong khơng khí </i>
<i>cho những quốc gia đang phát triển, đặc biệt là Việt Nam và các nước Châu Á. </i>
<b>Từ khóa: </b>Bảo Lộc; Rêu Barbula indica; Sự lắng đọng khơng khí; TXRF.
DOI:
Loại bài báo: Bài báo nghiên cứu gốc có bình duyệt
Bản quyền © 2020 (Các) Tác giả.
</div>
<span class='text_page_counter'>(3)</span><div class='page_container' data-page=3>
<b>1. INTRODUCTION </b>
Today, air pollution is a serious problem in developing countries, including
Vietnam. Air pollution is a result of industrialization and urbanization. The main sources
of environmental pollutants are development industry, mineral processing, farming, and
transport activity. Numerous studies using various moss species as indicators for
environmental pollution have been performed (Rühling & Tyler, 1968, 1969, 1970). Moss
acts as a biomonitoring station to detect multi-elemental atmospheric deposition. The
advantages of this method include easy implementation and low cost. Therefore, it is
affordable for developing countries.
The moss transplant technique was introduced by Gjengedal and Steinnes (1990),
who applied moss to determine trace elements in the air. Commonly, there are two moss
techniques: native species and active biomonitoring. Sucharová and Suchara (1998) used
native species in assessing temporal or spatial changes in atmospheric deposition of trace
elements in Bryophytes mosses. They determined the atmospheric loads of 13 elements
(Al, As, Cd, Co, Cr, Cu, Fe, Mo, Ni, Pb, S, V, and Zn). Mosses were also used for active
biomonitoring with wet and dry moss bags to examine trace element atmospheric
deposition. The moss bag technique is a simple, cost-effective, and eco-friendly tool for
air monitoring. Fernández and Carballeira (2000) have used transplanted mosses of the
species <i>Scleropodium purum</i> to detect levels of Co, Cr, Cu, K, Ni, Pb, Se, and Zn.
Most applications of the moss technique have been widely used for metal
deposition monitoring in Europe. The moss species that have been used include
<i>Pleurozium schreber</i>, <i>Hylocomium splendens</i>, <i>Scleropodium purum</i>, and <i>Hypnum </i>
<i>cupressiforme</i> (Frontasyeva et al., 2004; Frontasyeva and Harmens, 2019; Harmens et al.,
2010). These mosses are rarely found in Asia; instead, other moss types, such as <i>Hypnum </i>
<i>plumaeforme</i>, <i>Taxithelium instratum</i>, <i>Thuidium tamariscellum,</i> and <i>Barbula indica</i> were
used (Abdullah, Saat, & Hamzah, 2012; Doan Phan, Trinh, Khiem, Frontasyeva, &
Quyet, 2019; Khiem et al., 2020; Lee, Li, Zhang, Peng, & Zhang, 2005). Neutron
activation analysis, inductively coupled plasma mass spectrometry, and energy dispersive
X-ray fluorescence are multi-element analytical techniques that provide quantification at
low levels and have been used to analyze trace elements in moss samples. In this study,
we focused on the analysis of elements in moss using the total reflection X-ray
fluorescence (TXRF) technique, which offers even better detection limits than other
widely used multi-element detection techniques.
<b>2. MATERIALS AND METHODS </b>
<b>2.1. </b> <b>Sampling areas </b>
Baoloc, the second largest city of Lamdong province in the Central Highlands
region of Vietnam, is located at 11o32'52.73"N latitude and 107o48'27.79"E longitude. It
covers an area of around 232.56 km² and lies 846 m above sea level. Baoloc's climate is
</div>
<span class='text_page_counter'>(4)</span><div class='page_container' data-page=4>
2480 mm per year. Normally, Baoloc has two seasons: The dry season lasts six months
from November to May, and the wet season lasts from May to November.
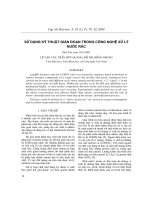
In this work, <i>Barbula indica</i> was chosen to study the atmospheric deposition of
trace elements. The moss samples were collected at the end of the rainy season from
November 2019 to March 2020 at 11 places in Baoloc (Fig. 1). The sampling points were
assumed to have different pollution levels due to various anthropogenic activities, such
as roads, farms, and the Tan Rai alumina refinery.
</div>
<span class='text_page_counter'>(5)</span><div class='page_container' data-page=5>
<b>2.2. </b> <b>Preparing moss samples </b>
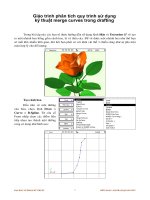
The <i>Barbula indica</i> moss morphology and a raw moss sample are shown in Fig. 2.
To minimize the influence of the substrate, moss samples were collected from the tree at
least 1.5 m above the ground and only the top, green part was used for analysis. The
collected moss samples were cleaned of soil particles, washed three times with distilled
water, and then dried at 40 oC for 50 h. The dried moss was crushed and homogenized to
a moss powder (~0.5 mm) using an analytical sieve shaker AS 300 control for 30 minutes,
followed by milling to a size smaller than 50 µm with a Retsch mixer mill MM 400.
<b> (a) </b> <b> (b) </b> <b> (c) </b>
<i><b>Figure 2. Side- and overhead-views of Barbula indica moss (a, b) </b></i>
<b>and raw moss sample (c) </b>
An amount of 0.5 g of fine moss powder was placed in a digestion vessel. After
adding 10 mL of concentrated HNO3, the sample was gently swirled, then left at room
temperature until the evaporation of nitrogen dioxide had ceased. The vessel was placed
into a microwave digestion system (MARS6) which has three periods of digestion: first,
the temperature inside the vessel was increased up to 220 oC in 15 min; second, the sample
was held at that temperature for 50 min; finally, it was cooled to room temperature.
When the digestion was completed, the digested solution was diluted to 10 mL
with distilled water. An aliquot of 1.35 mL sample was transferred to a polymer container
and added to 0.15 mL gallium internal standard liquid (10 ppm) until the sample reached
1 ppm gallium. The sample must be thoroughly homogenized by an automatic sample
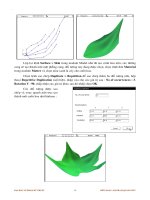
shaker. After thorough homogenization, 10 µl of the sample were transferred to a sample
carrier and then dried at 30 oC. Fig. 3 shows the TXRF sample.
<b> (a) </b> <b> (b) </b>
</div>
<span class='text_page_counter'>(6)</span><div class='page_container' data-page=6>
<b>2.3. </b> <b>TXRF technique </b>
The characteristic X-ray spectrum for each moss sample was determined with an
S2 PICOFOX™ TXRF spectrometer operated at 50 kV high voltage and a maximum tube
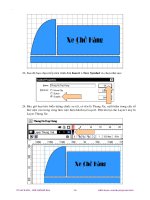
rating of 50 W. All 11 moss samples and the gain correction sample were placed into the
sample changer (Fig. 4). The TXRF spectrometer characteristics are described in detail
in Towett, Shepherd, and Cadisch (2013).
<b>Figure 4. Sample transfer to the TXRF spectrometer </b>
The necessary reset of the spectroscopic amplification is made with the gain
correction software function. In this process, a correction value is transferred to the
spectroscopic amplifier after a reference measurement having a known fluorescence
peak. For the gain correction, a suitable as mono-element standard sample was used.
The measurement time of 120 s for each sample, sufficient for the necessary statistics,
was established.
The quality of the results obtained with the TXRF technique is greatly impacted
by the accuracy of the instrument sensitivity curve. The sensitivity is determined by the
measurement of a Kraft sample (having 1 ppm of all 10 elements: Ti, V, Cr, Mn, Fe, Co,
Ni, Cu, Zn, Rb), for which the fluorescence intensity, standardized on mass, time, and
tube current, is detected by the instrument. The fit quality is a statistical parameter
reflecting the quality of the deconvolution. For all channels, the standardized sum of the
squares of the differences between the measured and calculated deconvoluted intensities
is calculated. The value of the fit quality should preferably be less than 10. High values
(>10) are an indication of misidentified or unidentified elements, respectively, or
inaccurate gain correction. The fit quality function is ∑ 1
𝛿<sub>𝑖</sub>2(𝑦𝑖+1− 𝑦𝑖)
2
𝑛2
𝑖=𝑛1 where <i>n1 is </i>
the first channel of peak <i>i</i> (the left channel), <i>n2 is the last channel of peak i</i> (the right
channel), <i>yi</i>+1 is the number of counts for channel <i>i</i>+1, <i>yi is the number of counts for </i>
channel <i>i</i>, and 𝛿<sub>𝑖</sub> = √𝑁𝑖 + 2𝑁𝐵𝐺 where <i>δi is the standard deviation for the peak area, Ni</i>is
the net peak area for element <i>i</i>, and <i>NBG</i>is the background area.
<b>3. RESULTS AND DISCUSSIONS </b>
</div>
<span class='text_page_counter'>(7)</span><div class='page_container' data-page=7>
moss samples are presented in Table 1, for which the errors in the concentrations are less
than 10%.
<b>Table 1. The concentration of trace elements in moss samples (in mg.kg-1<sub>) </sub></b>
El
Site
BL01 BL02 BL03 BL04 BL05 BL06 BL07 BL08 BL09 BL10 BL11
Al 2157.00 2154.00 2156.00 2156.00 4820.00 4581.00 4687.00 2320.00 1472.00 1455.00 1455.00
P 503.00 506.00 505.00 505.00 1048.00 839.00 591.00 803.00 978.00 1014.00 1014.00
S 689.00 678.00 684.00 684.00 2715.00 2568.00 2678.00 682.00 1154.00 1240.00 1240.00
Cl 767.00 741.00 754.00 754.00 927.00 857.00 987.00 750.00 897.00 970.00 970.00
K 2512.00 2478.00 2495.00 2495.00 2926.00 3540.00 3320.00 2489.00 8102.00 8199.00 8199.00
Sr 6.93 6.21 6.57 5.98 6.33 5.42 5.70 6.25 5.20 11.79 11.79
Sc 0.12 0.98 0.55 0.75 2.17 2.43 1.95 nd nd nd 0.86
Ti 143.00 168.00 156.00 156.00 320.00 350.00 340.00 147.00 47.00 46.00 46.00
M
n 46.00 42.00 44.00 44.00 70.00 74.00 82.00 39.00 68.00 74.00 74.00
Fe 924.00 911.00 918.00 918.00 5400.00 5064.00 5321.00 841.00 2540.00 2625.00 2625.00
Co nd 0.34 nd nd 6.21 5.46 4.72 nd 2.50 2.35 2.35
Cu 7.18 10.60 8.89 8.42 12.50 15.40 9.24 8.47 15.40 16.63 16.63
Zn 57.00 52.00 54.00 47.00 214.00 176.00 87.00 51.00 689.00 746.00 746.00
As 2.46 2.33 2.40 2.40 5.73 5.92 6.45 2.37 0.55 0.52 0.52
Br 2.73 1.97 2.35 2.35 3.42 4.12 3.72 2.22 2.78 2.47 2.47
Ba 18.64 12.56 15.60 15.60 26.58 22.78 23.47 14.59 4.58 5.18 5.18
La 3.58 2.45 3.02 3.02 14.78 17.89 23.96 2.83 1.02 1.36 1.36
Eu nd nd nd 0.34 5.45 6.54 5.89 nd 0.25 0.20 0.20
Tb nd nd nd 0.27 4.32 4.87 5.12 nd nd nd 0.47
Dy 0.18 0.23 0.21 0.21 3.21 4.27 3.87 nd 0.26 0.29 0.29
Ta nd nd nd 0.78 4.21 4.52 5.15 nd nd 0.45 0.37
Pb 2.74 3.54 3.14 3.14 6.54 6.87 5.98 3.27 17.63 18.03 18.03
Th 0.26 0.87 0.57 0.57 2.14 1.87 1.96 0.67 nd nd 0.34
U 0.77 0.73 0.75 nd 3.21 2.85 2.49 nd 0.45 0.74 0.74
Note: El–element
The mean concentrations of the elements in the moss samples from Baoloc
decreased as: K > Al > Fe > S > Cl > P > Zn > Ti > Mn > Ba > Cu > Pb > Sr > La > As
> Br > Co > Eu > Ta > Tb > Dy > U > Sc > Th.
</div>
<span class='text_page_counter'>(8)</span><div class='page_container' data-page=8>
as the ratio of the mean value of each heavy metal in a moss sample to the background
level, as in the equation (Hakanson, 1980): 𝐶𝐹<sub>𝑖</sub> = 𝐶𝑖
BGi where <i>Ci</i>is the mean value of the
<i>ith</i> element from the investigated area, and <i>BGi</i> is the average value of the three sample
sites which have the lowest concentration of the corresponding metal from the
investigated area.
The CF values comprise six levels: CF < 1: No contamination, 1 < CF ≤ 2:
Suspected contamination, 2 < CF ≤ 3.5: Slight contamination, 3.5 < CF ≤ 8: Moderate
contamination, 8 < CF ≤ 27: Serious contamination, and 27 < CF: Extreme contamination
(Fernández & Carballeira, 2001). Table 2 shows the contamination factors for 24 elements.
<b>Table 2. The contamination factors of trace elements in the moss samples </b>
El AL P S Cl K Sr Sc Ti Mn Fe Co Cu
CF 1.8 1.5 2.0 1.1 1.7 1.3 1.9 3.8 1.4 2.9 1.3 1.5
El Zn As Br Ba La Eu Tb Dy Ta Pb Th U
CF 5.3 5.4 1.3 3.0 5.5 7.9 0.8 5.9 2.6 2.7 2.2 1.8
A comparison of this result with those obtained in previous studies of <i>Barbula </i>
<i>indica</i> moss in Vietnam and moss in European countries (Barandovski, Stafilov, Sajn,
Frontasyeva, & Baceva, 2012) was carried out. The results of the comparison are listed
in Table 3.
<b>Table 3. Comparison of the mean trace element concentrations from atmospheric </b>
<b>deposition on Barbula indica moss at Baoloc with some previous work (in mg.kg−1<sub>) </sub></b>
Element
Baoloc
city our
work
Doan Phan et al., 2019 Khiem et al.,
2020 Barandovski
et al., 2012
Hue city Hoian city Hochiminh city Hanoi capital
Na 620.00 1310.00 930.00
Mg 1550.00 1620.00 1290.00 3866.66 1900.00
Al 2674.00 5800.00 3200.00 4800.00 10591.19 1900.00
Si 39595.76
P 755.00 1100.14 1100.00
S 1365.00 3238.92
Cl 852.00 1700.00 2100.00 780.00 1711.59
</div>
<span class='text_page_counter'>(9)</span><div class='page_container' data-page=9>
<b>Table 3. Comparison of the mean trace element concentrations from atmospheric </b>
<b>deposition on Barbula indica moss at Baoloc with some previous work (in mg.kg−1<sub>) </sub></b>
<b>(cont.) </b>
Element
Baoloc
city our
work
Doan Phan et al., 2019 Khiem et al.,
2020 Barandovski
et al., 2012
Hue city Hoian city Hochiminh City Hanoi Capital
Sc 0.89 1.09 0.80 1.81
Ti 174.00 271.00 205.00 524.00 691.60
V 12.20 5.11 8.08 3.50
Cr 11.00 6.80 19.90 26.73 3.50
Mn 60.00 74.00 88.00 77.00 170.95 130.00
Fe 2553.00 3720.00 4810.00 5430.00 6025.18 1500.00
Co 2.18 1.40 1.01 3.28
Ni 4.20 2.70 9.50 4.42 3.50
Cu 11.76 27.20 3.50
Zn 265.00 126.00 254.00 178.00 397.53 20.00
As 2.88 2.30 3.00 4.10 16.11
Se 1.40 0.70 0.39
Br 2.78 10.40 7.70 12.80 36.11
Kr
Rb 151.17
Sb 1.40 0.89 1.00
Cs 1.58 1.18 5.30
Ba 14.98 58.00 83.00 101.00 1545.55 34.00
La 6.84 3.10 2.24 5.60
Ce 6.20 4.20 11.70
Sm 0.51 0.35 1.15
Eu 1.72
Tb 1.37
Dy 1.18
Ta 1.41 0.09 0.07 0.15
Pb 8.08 231.55 4.60
Th 0.84 1.78 0.86 1.49
U 1.16 0.62 0.23 1.10
</div>
<span class='text_page_counter'>(10)</span><div class='page_container' data-page=10>
concentrations are higher than in Baoloc. The concentrations of Al, P, S, Cl, K, Ti, Mn,
Fe, Cu, Zn, As, Br, Ba, and Pb in Hanoi are higher than in Baoloc: 4.0, 1.5, 2.4, 2.0, 3.4,
4.0, 2.8, 2.4, 2.3, 1.5, 5.6, 13.0, 103, and 28.7, respectively, especially for barium and lead.
According to Pacyna and Pacyna (2002) and Cucu-Man, Mocanu, Culicov,
Steinnes, and Frontasyeva (2004), the main pollution sources in our study area can be
explained as follows:
• <i>Sample sites</i>: BL01, BL02, BL03, and BL04 are major roads where traffic
activity is high. In particular, BL01 and BL02 are at the entrance of Baoloc
pass; BL03 and BL04 are in the city center of Baoloc; BL10 and BL11 are in
the area between Baoloc city and Dilinh district (along 20th road); BL08, and
BL09 are the places where silk is produced. Notably, the pollution in these
places is affected by windblown dust and traffic emissions, especially
gasoline-burning vehicles, cars, and motorbikes.
• <i>Three special sample sites</i>: B05, B06, and B07 are near the Tan Rai alumina
refinery. All concentrations of trace elements, especially aluminum, are
higher there than at other moss sample sites in this work. That suggests the
pollution at these sites was effected by aluminum ore processing.
<b>4. CONCLUSIONS </b>
In this investigation, we applied the TXRF technique to determine trace element
concentrations from atmospheric deposits on <i>Barbula indica</i> moss samples and to
estimate the metal pollution in Baoloc. The TXRF technique is useful and suitable. The
result is expressed through the number of analytical elements. A total of 24 elements were
detected, including Al, P, S, Cl, K, Sr, Sc, Ti, Mn, Fe, Co, Cu, Zn, As, Br, Ba, La, Eu,
Tb, Dy, Ta, Pb, Th, and U. We compared our data with some previous research on trace
element atmospheric deposition on <i>Barbula indica</i> moss in Vietnam, and the results show
that the element concentrations at Baoloc are lower than other locales, although a little
higher than the concentrations found by Barandovski et al. (2012). Most of the elements
from atmospheric deposits in Baoloc are at the “suspected” to “slight” contamination
level. The air pollution sources of these elements are possibly due to traffic and aluminum
ore processing.
<b>ACKNOWLEDGMENTS </b>
This work is supported by the Ministry of Education and Training of Vietnam
under the project code: B2019-DLA-04.
<b>REFERENCES </b>
Abdullah, M. Z. B., Saat, A. B., & Hamzah, Z. B. (2012). Assessment of the impact of
petroleum and petrochemical industries to the surrounding areas in Malaysia using
</div>
<span class='text_page_counter'>(11)</span><div class='page_container' data-page=11>
<i>Monitoring and Assessment</i>, <i>184</i>, 3959-3969.
/10.1007/s10661-011-2236-y.
Barandovski, L., Stafilov, T., Sajn, R., Frontasyeva, M., & Baceva, K. (2012). Air
pollution study in Macedonia using a moss biomonitoring technique, ICP-AES
and AAS. <i>Macedonian Journal of Chemistry and Chemical Engineering</i>, <i>32</i>(1),
89-107.
Cucu-Man, S., Mocanu, R., Culicov, O., Steinnes, E., & Frontasyeva, M. (2004).
Atmospheric deposition of metals in Romania studied by biomonitoring using the
epiphytic moss hypnum cupressiforme. <i>International Journal of Environmental </i>
<i>Analytical Chemistry</i>, <i>84</i>(11), 845-854.
68152.
Doan Phan, T. T., Trinh, T. T. M., Khiem, L. H., Frontasyeva, M. V., & Quyet, N. H.
(2019). Study of airborne trace element pollution in Central and Southern Vietnam
using moss (Barbula indica) technique and neutron activation analysis. <i></i>
<i>Asia-Pacific Journal of Atmospheric Sciences</i>, <i>55</i>, 247-253.
/s13143-018-0065-4.
Fernández, J. A., & Carballeira, A. (2000). Differences in the responses of native and
transplanted to atmospheric pollution: A possible role of selenium. <i>Environmental </i>
<i>Pollution</i>, <i>110</i>(1), 73-78.
Fernández, J. A., & Carballeira, A. (2001). A comparison of indigenous mosses and
topsoils for use in monitoring atmospheric heavy metal deposition in Galicia
(Northwest Spain). <i>Environmental Pollution</i>. <i>114</i>(3), 431-441,
1016/S0269-7491(00)00229-3.
Frontasyeva, M. & Harmens, H. (2019). <i>Monitoring of atmospheric deposition of heavy </i>
<i>metals, nitrogen and pops in Europe using bryophytes</i>. Retrieved from
/>20monitoring%20manual%202020.pdf.
Frontasyeva, M. V., Galinskaya, T. Y., Krmar, M., Matavuly, M., Palov, S. S.,
Povtoreyko E. A.,… Stainnes, E. (2004). Atmospheric deposition of heavy metals
in northern Serbia and Bosnia-Herzegovina studied by the moss biomonitoring,
neutronactivation analysis and GIS technology. <i>Journal of Radioanalytical and </i>
<i>Nuclear Chemistry</i>, <i>259</i>, 141-147.
JRNC.0000015819.67830.60.
Gjengedal, E., & Steinnes, E. (1990). Uptake of metal ions in moss from artificial
precipitation. <i>Environmental Monitoring and Assessment</i>, <i>14</i>, 77-87.
Hakanson, L. (1980). An ecological risk index for aquatic pollution control: A
sedimentological approach. <i>Water Research</i>, <i>14</i>, 975-1001.
1016/0043-1354(80)90143-8.
</div>
<span class='text_page_counter'>(12)</span><div class='page_container' data-page=12>
deposition: Spatial patterns and temporal trends in Europe. <i>Environmental </i>
<i>Pollution</i>, <i>158</i>(10), 3144-3156.
Khiem, L. H., Sera, K., Hosokawa, T., Quyet, N. H., Frontasyeva, M. V., Trinh, T. T. M.,
… Tien, D. P. T. (2020). Assessment of atmospheric deposition of metals in Ha
Noi using the moss bio-monitoring technique and proton induced X-ray emission.
<i>Journal of Radioanalytical and Nuclear Chemistry</i>, <i>324</i>, 43-54.
10.1007/s10967-020-07066-z.
Lee, C. S. L., Li, X., Zhang, G., Peng, X., & Zhang, L. (2005). Biomonitoring of trace
metals in the atmosphere using moss (Hypnum plumaeforme) in the Nanling
Mountains and the Pearl River Delta, Southern China. <i>Atmospheric Environment</i>,
<i>39</i>(3), 397-407.
Pacyna, J. M., & Pacyna, E. G. (2002).An assessment of global and regional emissions
of trace metals to the atmosphere from anthropogenic sources worldwide.
<i>Environmental Reviews</i>, <i>9</i>(4), 269-298.
Rühling, Å., & Tyler, G. (1968). An ecological approach to the lead problem. <i>Botaniska </i>
<i>Notiser</i>, <i>121</i>, 321-342.
Rühling, Å. & Tyler, G. (1969). Ecology of heavy metals-a regional and historical study.
<i>Botaniska Notiser</i>, <i>122</i>, 248-259.
Rühling, Å. & Tyler, G. (1970). Sorption and retention of heavy metals in the woodland
moss Hylocomium splendens (Hedw.) Br. et Sch. <i>Oikos</i>, <i>21</i>(1), 92-97.
Sucharová, J., & Suchara, I. (1998). Atmospheric deposition levels of chosen elements in
the Czech Republic determined in the framework of the International
Bryomonitoring Program 1995. <i>Science of The Total Environment</i>, <i>223</i>(1), 37-52.
Towett, E. T., Shepherd, K. D., & Cadisch, G. (2013). Quantification of total element
concentrations in soils using total X-ray fluorescence spectroscopy (TXRF).
</div>
<!--links-->
<a href=' />