Ngoc -assignment-2-bar-chart
Bạn đang xem bản rút gọn của tài liệu. Xem và tải ngay bản đầy đủ của tài liệu tại đây (16.03 KB, 1 trang )
Hoàng Trần Bảo Ngọc – Bar chart assignment 2
Male
Female
15-24
52.8%
47.7%
35-44: 39,5 (lowest)
35-44: 52,5% (by
13%)
45-64~ 53%
(flutuated)
>= 65
46.7%
47.1%
Trend
↓
↓
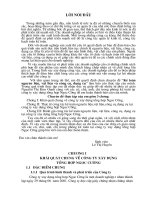
The picture compares the proportion of Austrailian men and women in
particular age groups doing physical activity frequently in 2010.
Overall, the rate of Australian men and women doing regular physical activity
had the same trend. Interestingly, the figure of men fluctuated stronger although it
had a higher beginning point.
In 15 to 24 age group, the percentage of men doing physical activity
repeatedly stood at 52,8%, which was followed by the figure of women, standing at
47.7%. In addition, man chose to do exercises had a lowest proportion in 35 to 44 age
group (39,5%), and there was a rocket in 65 and over age group. The older people
are, the more regularly man do physical activity.
A similar pattern could be seen in the percentage of Australian women doing
exercises daily. In particular, the figure was far higher, standing by even 13%. In 45 to
54 and 55 to 64 age groups, it fluctuated around 53%, and there had been plunge to
47.1% in 65 and over age group during the period.
(174 words)