Endophytic fungi from Oryza sativa L.: Isolation, characterization, and production of GA3 in submerged fermentation
Bạn đang xem bản rút gọn của tài liệu. Xem và tải ngay bản đầy đủ của tài liệu tại đây (958.62 KB, 14 trang )
Int.J.Curr.Microbiol.App.Sci (2020) 9(11): 1007-1020
International Journal of Current Microbiology and Applied Sciences
ISSN: 2319-7706 Volume 9 Number 11 (2020)
Journal homepage:
Original Research Article
/>
Endophytic Fungi from Oryza sativa L.: Isolation, Characterization, and
Production of GA3 in Submerged Fermentation
Anchal Tripathy1 and Chandi C. Rath2*
1
Department of Botany, College of Basic Science and Humanities,
Odisha University of Agriculture and Technology (OUAT), Bhubaneswar, India
2
Department of Life Sciences, Rama Devi Women’s University,
Vidya Vihar, Bhubaneswar, India
*Corresponding author
ABSTRACT
Keywords
Oryza sativa,
Endophytic fungi,
Submerged
fermentation, GA3,
Condition
Optimization, TLC,
FTIR
Article Info
Accepted:
10 October 2020
Available Online:
10 November 2020
In the present investigation, an attempt was made to isolate endophytic fungi from rice
plant (Oryza sativa L.). A total of 48 fungi were isolated from 288 segments, from 4
varieties (Gitanjali, Hiranyamayee, Khandagiri and Lalat) of rice plant (Oryza sativa L).
The coloniczation frequency of the endophytic fungi were observed to be 16.87% and
16.40% in leaf and stem respectively. All the isolates were screened for GA3 production
both qualitatively and quantitatively under submerged fermentation condition. Two
isolates OSLST-4 and OSLL-4 exhibited maximum GA3 yield were preferred to study the
effect of various physical (pH, temperature, incubation period) and nutritional (Different
media, salts, carbon sources, nitrogen sources) parameters on GA3 production. It was
observed that isolate OSLST-4 produced maximum amount of GA3 (96.821µg/ml) at pH-8,
temperature-30°C on 192hrs (8 days) of incubation under submerged fermentation in a
medium containing (5%) of NaCl, (0.5%) of sucrose and (0.5%) of sodium nitrate.
Whereas, the isolate OSLL-04 produced maximum amount of GA3 (78.656µg/ml) under
submerged fermentation in a medium containing (3%) of NaCl, (1%) of starch and (0.3%)
of ammonium chloride at pH-6, on 240 hrs (10th days) of incubation period at 25°C.
Extracellular production of GA3 into the medium by the isolates was confirmed by TLC &
FTIR analysis. Efforts are on, in our laboratory for further characterization of the isolates
to exploit their potential for PGP activities for sustainable agriculture.
Introduction
In recent times it has been proclaimed that
endophytic fungi can produce phytohormones
chiefly gibberellic acids (GAs) that enhance
crop growth and mitigate the pernicious effect
of abiotic stress (Khan et al., 2011).
Gibberellins are tetracyclic diterpenoid acids
that regulate various plant developmental and
physiological processes including seed
germination, seedling development stem and
leaf growth, floral initiation and flower and
fruit setting (Crozier, 2000; Davies, 2010).
Gibberellins also enhance other physiological
1007
Int.J.Curr.Microbiol.App.Sci (2020) 9(11): 1007-1020
process in plants such as root growth and root
hair development and inhibit floral bud
differentiation in woody angiosperms.
Though, 136 known gibberellins are reported
from bacteria, plant and even by fungi, GA1,
GA3, GA4 and GA7 are prominently bioactive.
Rice is considered as an cardinal food crop
universally, as rice offers food to almost half
of the world’s population and it’s
consumption has been gaining importance
with an escalation in the world’s population
(Lee et al., 2001; Gyaneswar et al., 2001).
Employment of plant micro-biota has
aptitudes to produce phyto-hormone like
constituents could be an substitute to not only
upsurges crop production but also to lessen
the plant disease phenomenon, diminish
chemical inputs and decrease emissions of
greenhouse gasses, for sustainable agricultural
practices. Several reports in literature stresses
colonization and isolation of endophytic fungi
from different parts of rice plant. Endophytic
fungi have mostly been reported for their
behaviour to enhance plant growth as it plays
pivotal role in plant physiology and host’s
protection against biotic and abiotic stresses
by producing various kinds of secondary
metabolites similar to phytohormones.
Phytohormone production by microbes totally
rely upon the processed parameters like pH,
temperature, incubation period, growth potential
and various nutritional conditions (Khan et al.,
2012; Wei et al., 2013). Selection of optimal
growth condition is necessary to outline the
strategies for industrial production of gibberellic
acids (GAs).
Computation of such potential would satisfy
dual benefits in the enhancement of crop growth
and sustainable agricultural yield. The current
study was therefore, carried out to evaluate the
potency of a novel GA3 producing endophytic
fungi isolated from four varieties of Oryza
sativa L. (Family-Gramineae or Poaceae, Asian
rice), and optimize the effect of various
physico-chemical parameters on the maximum
gibberellic acid production under submerged
fermentation.
Materials and Methods
Sample collection
Healthy (showing no visual symptoms) &
matured seedlings of four varieties
(Khandagiri,
Lalat,
Gitanjali
&
Hiranyamayee) of rice plants (Oryza sativa
L.) were collected from OUAT (Odisha
University of Agriculture and Technology,
Bhubaneswar, Odisha, India) field (Lat
20˚16'N, Long 85˚47'E). Seedlings were
transported to the laboratory aseptically in
sterile polythene bags and processed within
24 hours of collection.
Isolation of indigenous endophytic fungi
The four variability of rice seedlings were
rinsed gently under running tap water for five
minutes for removing dust and debris and
were then allowed to air dry. Before surface
sterilization the cleaned stems and leaves
were cut into 0.5×0.5 cm²size.Isolation and
Surface sterilization of endophytic fungi were
carried out according to the modified
immersion procedure described by (Bills and
Polishook, 1993; Strobel, 2002). Every set of
plant material was immersed consecutively in
70% ethanol for two minutes, followed by
immersion in 4% sodium hypochlorite for
four minutes and in 70% ethanol for 45
seconds, then dipping systematically thrice
with sterile distilled water. The surface
sterilized stems and leaves were then air dried
under laminar air flow chamber. The
sterilized plant segments were applied over
the surface of PDA (Potato dextrose Agar),
WA (water agar), RBA (Rose Bengal agar),
SDA (Sabourd’s Dextrose Agar), CDA
(Czapeck’s dox agar) and MEA (Malt extract
agar) plates supplemented with streptomycin
1008
Int.J.Curr.Microbiol.App.Sci (2020) 9(11): 1007-1020
(100mg/L) to prevent the growth of bacteria.
The petridishes were incubated at 28 ± 2˚C in
BOD incubator. Plates were supervised
repeatedly to check the growth of endophytic
fungi. Hyphal tips growing out from the edge
of the inoculated fragments were instantly
transferred into PDA slants, purified, and
preserved at 4˚C.Non-appearance of any
microbial growth form on the media plates
drenched with 60µl aliquots of final wash of
water displayed the effectiveness of surface
disinfection method (Schulz et al., 1993).
Identification of endophytic Fungi
The fungal isolates were identified based on
their morphological and reproductive
characters using the standard identification
manuals (Gillman, 1971; and Barnett &
Hunter 1998) by LCB (Lacto Phenol Cotton
Blue) staining technique of sticky tape
method.
Calculation of colonizing frequency
The colonization frequency of endophytic
fungi was calculated by using the formula
given by Fisher and Petrini (1987) as follows.
Colonization frequency was expressed as
(CF%) =(NC/NT)×100
(Where NC = Total number of plated segments
colonized by endophytic fungi, NT=Total
number of segments plated)
Preliminary & Secondary screening of
fungal isolates for gibberellic acid
production
beneath
submerged
fermentation
Czapeck’dox modified agar plate and were
allowed to incubate for proper growth. After
4-5days of incubation the preliminary
screening of isolates for gibberellic acid were
done by spraying the phosphomolybdic
reagent using the method of Grahmand
Henderson (1961).
Endophytic fungi that unveiled gibberellic
acid production activity in the preliminary
screening
were
subjected
to
spectrophotometric quantification following
the above said methodology using
Czapeck’dox media (CD Broth).After ten
days of incubation the concentration of
gibberellic acid in the culture broth was
determined spectrophotometrically using
phosphor-molybdic acid reagent. Briefly, 1 ml
of culture supernatant was taken in a
volumetric flask of 25 ml, mixed with 15 ml
of phospho molybdic acid reagent and kept in
a boiling water bath for one hr.
After one hr. the temperature of the flasks was
reduced to room temperature and then the
final volume was made up to 25ml with
distilled water. The absorbance was measured
at 780 nm using UV-Visible spectrophotometer (Systornics, 118). The two
isolates OSLST-4 and OSLL-4 that showed
maximum amount of GA3 production were
characterized further.
Condition optimization for maximum
production of GA3 by the isolates
Different physical and chemical parameters
were optimized for maximum production of
GA3 by the isolates (OSLST-4 & OSLL-4).
Optimization of physical parameters
All the endophytic fungal isolates were
screened for the production of gibberellic acid
by plate assay as well as spectrophotometric
method by using Follin-wu method (Grahm
and Henderson, 1961, Patil and Patil, 2014).
All the isolates were aseptically inoculated on
Effect of incubation period
production
on
GA3
To determine the optimal incubation period
for GA3 synthesis, the two fungal isolates
1009
Int.J.Curr.Microbiol.App.Sci (2020) 9(11): 1007-1020
(OSLST-4 & OSLL-4) were inoculated into
culture flasks (250ml) containing 100ml
Czapeck’dox broth (CDB) medium incubated
for 96hrs, 120hrs, 144hrs, 168hrs, 192hrs,
216hrs, 240hrs, 264hrs, 288hrs at 28 ± 1° C.
After 4th day of incubation, GA3 amount was
estimated up to 12th day at 24hrs increment
using spectrophotometric method as described
earlier.
Effect of temperature on GA3 production
Culture flasks containing 100 ml of CDB
inoculated with the isolates separately were
incubated at different temperatures (25, 30,
35, 40 and 45°C) upto 8th day and 10th day.
GA3 production was measured spectrophotometrically as described previously.
Effect of pH on GA3 production
For pH optimization, both the isolates
OSLST-4 & OSLL-4 were cultured separately
in 100ml of CDB at different pH (pH 4-12)
and the flasks were incubated at 300C and
250C and for 8th (192hrs) & 10th (240hrs) day
respectively. Production of GA3by the isolates
were quantified spectrophotometrically as
described above.
Optimization of chemical parameters
Effect of media on GA3 production
To determine the suitable media for GA3
synthesis, the two fungal isolates OSLST-4 &
OSLL-4 were inoculated into culture flasks
(250ml) containing 100ml of Different media
viz.
Potato
dextrose
broth
(PDB),
Czepeck’dox
broth(CDB),
Sabouraud’s
dextrose broth (SDB), Malt extract broth
(MEB), incubated at 30°C and 25°C for 8th
(192hrs) & 10th (240hrs) days respectively.
GA3 was estimated using the method of (Patil
and Patil, 2014) as described earlier.
Effect of
production
carbon
sources
on
GA3
Both the isolates were grown separately in
250ml conical flasks containing 100 ml of
CDB supplemented with different carbon
sources (sucrose, fructose, maltose, lactose,
and soluble starch) at varied concentration
(0.5%, 1%, 1.5%, 2%, 2.5%), and incubated
at 30°C and 25°C for 8th (192hrs) & 10th (240
hrs) days respectively. GA3 was estimated as
described previously (Patil and Patil, 2014).
Effect of different nitrogen sources on GA3
production
This experiment was designed to study the
effect of different nitrogen sources on GA3
production by the isolates. Both the isolates
were grown separately in 100ml CDB
supplemented with different nitrogen sources
(sodium nitrate, potassium nitrate, ammonium
chloride, calcium nitrate, and urea) at
different concentrations (0.1%, 0.3%, 0.5%,
1%) at 30°C and 25°C for 8th (192 hrs) and
10th (240hrs) days respectively maintaining
other parameters (physical and nutritional)
optimal. GA3 in the culture filtrate was
estimated as described previously.
Effect of NaCl on GA3 production
To determine the effect of NaClon GA3
synthesis, the two fungal isolates OSLST-4
and OSLL-4 were inoculated into culture
flasks
(250ml)
containing
100ml
Czapeck’dox
broth
(CDB)
medium
supplemented
with
various
NaCl
concentrations (1%, 3%, 5%, 7%, 10%) at
30°C and 25°C for 8th (192hrs) and 10th
(240hrs) day respectively keeping other
parameters constant.
GA3 amount was estimated following the
method of (Patil and Patil, 2014) as described
earlier.
1010
Int.J.Curr.Microbiol.App.Sci (2020) 9(11): 1007-1020
Himedia, Pvt, Ltd. Mumbai, India was used as
standard.
Gibberellic acid extraction and separation
Eight days old fermented broth (200 ml)was
taken filtered in Whatman filter paper (no.1)
and then centrifuged at 10000 rpm for 10
min., and the supernatant was collected,
acidified to pH 2-2.5 using 1N HCl. Equal
volume of ethyl acetate was added and shaken
vigorously for 10 minutes. The ethyl acetate
fraction was separated and re-extracted the
aqueous layer with 200 ml of ethyl acetate.
The ethyl acetate fractions collected and was
evaporated by a rotary evaporator (Heidolf,
USA) at 40°C.Residues dissolved in 2ml of
methanol for analytical purposes (TLC and
FTIR), was stored at 40C.
TLC analysis
The slurry of silica gel was poured on a TLC
plate, air dried, and the matrix was activated
by keeping the plates on hot air oven at 800C
for 1 hr. Plates were run using mobile phase
containing solvent isopropanol: ammonia:
water (10:1:1v/v/v).The organic extract (30µl)
was injected into the TLC plate and the
standard GA3 [(10mg/100ml (Himedia, Pvt,
Ltd)] dissolved in methanol was used as
reference by using the capillary tube and run
for two hour. The plates were removed,
sprayed with 3% sulphuric acid containing
50mg FeCl3 and heated in oven at 800C for
ten minutes. Plates were observed under UV
to detect the presence of greenish
fluorescence spots, confirming the presence
of GA3 in the extract (Cavel et al., 2016).
FTIR analysis
Further, the extracted GA3 was subjected to
FTIR analysis following the method of
Silverstein et al., (2014). The organic extract
of both the isolates were completely dried and
loaded to FTIR (Thermo nicolet-6700 FTIR
unit) at the transmission mode from 400-4000
cm-1. Commercial GA3 obtained from
Statistical procedure for data analysis
One way (ANOVA) with Tukey’s multiple
comparisons test for preliminary qualitative
analysis of fungal isolates, two way ANOVA
with Bonferroni multiple comparison spost
test for optimization of incubation days, pH,
temperature, carbon sources, nitrogen sources,
media, and salt stress for two isolates
(OSLST-4 and OSLL-4) on GA3 production
were carried out using Graph Pad Prism
software (version 5.0, San Diego, California
USA). All data are expressed as means of
triplicates (Mean ± SE) and values of P≤0.05
were considered as significant.
Results and Discussion
During the study, total 48 fungal strains were
isolated from 288 fragments(leaves and
stems)on six different media (MEA, SDA,
WA, PDA, RBA, CDA) of the four varieties
of Oryza sativa L. (Gitanjali, Hiranyamayee,
Khandagiri and Lalat) and were used to
examine their efficacy to yield gibberellic
acid in in-vitro condition. The colonization
frequency was highest in leaves (16.87%)
followed by stem (16.40%) presented in Table
1.
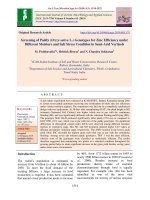
The present study results are in agreement
with the results of (Bhattarani et al., 2014 and
Radu et al., 2002) who have stated that
colonization frequency is observed higher in
leaves than in stem. The isolated strains were
distinguished primarily on the basis of
morphological characters. In the present
exploration, most fungal genera were
tentatively identified belonged to the class of
ascomycetes
(Penicillium,
Aspergillus,
Colletotrichum and Fusarium spp.). All the
endophytic fungal isolates were pure cultured
on PDA slants and were maintained at 40 C
for future use.
1011
Int.J.Curr.Microbiol.App.Sci (2020) 9(11): 1007-1020
Screening of GA3 production through
qualitative and quantitative method
Primarily, all the isolates were screened for
GA3 production by plate assay method, (Fig.
1) of which, 15 were positive and screened for
GA3 production quantitatively (Fig. 2), Two
isolates OSLST-4 and OSLL-4 that showed
better activities through this method were
characterized further.
Optimization of culture conditions of
optimum GA3 Production in submerged
fermentation
Optimization of physical parameters
Effect of incubation period
It was observed that the isolates OSLST-4and
OSLL-4produced maximum amount of
GA374.365µg/ml and59.490µg/ml on 8th and
10th days of incubation in CDB medium under
submerged fermentation condition (Fig. 3). In
corroboration Rangaswamy (2012) reported
GA3production on 8th day by Fusarium
moniliforme as observed in this study. In
contrast, Kahlon et al., (1986) observed 12
days as optimal incubation period for
production of GA3 by the same species.
However, Shukla et al., (2005) and Escamilla
et al., (2000) reported optimal production of
GA3 by microorganism varies from 10-18
days. Maximum production of GA3 with 8-10
days by our isolates is suggestive of that these
isolates could be an alternative for GA3
production industrially. Optimization of other
parameters were studied by incubating at 8th
and 10th days respectively specific to the
isolates.
Effect of temperature
Temperature plays an important role in
production of secondary metabolites by
microorganisms including growth hormones.
Hence, an experiment was designed to
optimize the temperature condition for
maximum production of GA3 by the isolates,
keeping other parameters constant. It was
reported that isolate OSLST-4 and OSLL-4
produced maximum amount of GA3
84.377µg̷ml and 61.207µg̷ ml respectively , in
the growth medium at 300 C and 250C
respectively (Fig. 4). Our above findings in
this investigation substantiate with the result
of several workers (Kumar and Lonsane,
1990; Pastrana et al., 1995; Cihangir and
Aksiiza, 1997; Tomasini et al., 1997;
Escamilla et al., 2000; Machado et al., 2002;
Corona et al., 2005) who observed maximum
production of GA3 between 250-340C by
microorganisms
in
different
media.
Observance of decline in GA3 production at
high temperatures could be due to alteration
and denaturation of enzyme action at high
temperature. Production of GA3 at different
temperatures by our isolates could find their
possibility to be used as PGP candidates
under diverse temperature in nature.
Effect of pH
Similarly, the effect of different pH on GA3
production by the two isolates were studied by
culturing the isolates at different pH in CDB.
The isolate OSLST-4 produced maximum
amount of GA3 (88.945 µg/ml) on 8th day of
incubation at 300C, at pH 8, whereas, the isolate
OSLL-4 produced maximum amount of GA3
(66.642µg/ml) on the 10th day of incubation at
250C, at pH 6 (Fig. 5). In agreement to our
observations (Patil and Patil, 2014), and (Sagar
and Desai, 2017) reported maximum GA3
production by fungi at pH 8.0. In addition,
Pandya and Desai (2013) also reported
maximum GA3 production by the isolate
Bacillus cerus at pH 6. In contrast to our
observations Bilkay et al., (2017) observed
highest GA3 production by A.niger and
F.moniliforme at pH 5.0 and 7.0 respectively.
Further characterization of other parameters
1012
Int.J.Curr.Microbiol.App.Sci (2020) 9(11): 1007-1020
was carried out a specific pH for the respective
isolates.
Optimization of chemical parameters
Media optimization
Production of GA3 by the two isolates was
studied under submerged condition using
(CDB, PDB, SDB, MEB) and culturing under
optimal physical conditions. It was observed
that both the isolates produced highest
amount of GA3 in CDB(Fig. 6) which could
be attributable to the low amount of glucose
in the above medium (Barborakova et
al.,2012). In agreement to our observations
Rangaswamy (2012) also reported maximum
production of GA3 in CDB medium.
Effect of different carbon sources
While CDB was supplemented with different
carbon sources at varied concentrations and
used to study the GA3 production by the
isolates under fermentation (optimized
condition) it was observed that OSLST-4
produced maximum amount of GA3
(96.821µg/ml) at 0.5% of sucrose and OSLL4 (77.512µg/ml), at1% soluble starch in the
medium (Fig. 7). Soluble starch being poly
saccharide demonstrated to be very
appropriate for Gibberellic acid production, as
this result harmony with the result reported by
Kumar (1987). In case of the first OSLST-4
our result reinforced with the result obtained
by Rangaswamy et al., (2012) i.e. sucrose was
the best carbon source at a final concentration
of 15g/lunder optimized condition, in contrary
with the result reported by Lale and Gadre
(2010) i.e. glucose was the supplementary
carbon source for the optimum production of
Gibberellic acid by microbes. In this case we
established that by breaking down of sucrose
and soluble starch by the isolates quickly
swapped to stationary phase and Gibberellic
production was observed.
Table.1 Colonization frequency of the isolates
Characters
Plant variety
Stem
Leaf
CF% of stem
CF% of leaf
Plant parts inoculated vs endophytic fungi occurrence
Gitanjali
Hiranyamayee
Khandagiri
Lalat
32/9
32/5
32/3
32/4
40/7
40/7
40/6
40/7
28.1%
15.6%
9.3%
12.5%
17.5%
17.5%
15%
17.5%
Table.2 Condition optimization for maximum synthesis of GA3 by the isolates
Condition
Media
Incubation
period
Temperature
pH
Carbon source
Nitrogen source
NaCl (%)
OSLST-4 (Aspergillus sp.)
Czapeck’s dox broth medium
192hrs(08th Day)
OSLL-4 (Colletotrichum sp.)
Czapeck’s dox broth medium
240hrs (10th Day)
300C
8
Sucrose (0.5%)
Sodium Nitrate (0.5%)
5
250 C
6
Starch (1%)
Ammonium chloride (0.3%)
3
1013
Int.J.Curr.Microbiol.App.Sci (2020) 9(11): 1007-1020
Fig.1 Screening of the isolates for GA3 production by plate assay method. A:OSLST4(Aspergillus sp.) B: OSLL-4 (Colletotrichum sp.)
A
B
Fig.2 Quantitative Screening for Gibberellic Acid activity by the isolates
Fig.3 Effect of incubation period on GA3 production of the isolates [OSLST-4(Aspergillus sp.)
and OSLL-4(Colletotrichum sp.)]
Fig.4 Effect of temperature on GA3 production by the isolates [OSLST-4 (Aspergillus sp.) and
OSLL-4 (Colletotrichum sp.)
1014
Int.J.Curr.Microbiol.App.Sci (2020) 9(11): 1007-1020
Fig.5 Effect of pH on GA3 production by the isolates [OSLST-4(Aspergillus sp.)
and OSLL-4 (Colletotrichum sp.)
Fig.6 Effect of different media on GA3 yield by the isolates
[OSLST-4 (Aspergillus sp.) and OSLL-4 (Colletotrichum sp.)
Fig.7 Effect of different carbon sources on GA3 production by the isolates. A: OSLST-4
(Aspergillus sp.) B: OSLL-4 (Colletotrichum sp.). Each value is the mean of three replicates
(n=3).Error bars showing the ±SE
(A)
(B)
1015
Int.J.Curr.Microbiol.App.Sci (2020) 9(11): 1007-1020
Fig.8 Effect of different nitrogen sources on GA3 production by the isolates. A: OSLST-4
(Aspergillus sp.) B: OSLL-4 (Colletotrichum sp.).Each value is the mean of three replicates
(n=3).Error bars showing the ±SE
(A)
(B)
Fig.9 Effect of NaCl on GA3 production by the isolates [OSLST-4 (Aspergillus sp.) and OSLL-4
(Colletotrichum sp.)
Fig.10 Characterization of GA3 by TLC. Both standard and extract showed similar RF value.
A: OSLST-4 (Aspergillus sp.) B: OSLL-4 (Colletotrichum sp.)
1016
Int.J.Curr.Microbiol.App.Sci (2020) 9(11): 1007-1020
Fig.11 FTIR spectra of GA3 produced by the isolates. A: A: OSLST-4 (Aspergillus sp.); B:
OSLL-4 (Colletotrichum sp.); C: Standard GA3
101
100
2031.64cm-1, 98.14%T
2169.31cm-1, 97.69%T
95
2
0
5
4
.
0
6
c
m
-
1
,
9
7
.
7
0
%
T
2154.48cm-1, 97.71%T
2112.98cm-1, 97.71%T
1989.15cm-1, 97.93%T
2195.26cm-1, 98.14%T
1954.77cm-1, 98.38%T
90
2854.16cm-1, 91.10%T
2958.66cm-1, 88.23%T
1381.21cm-1, 88.03%T
85
1445.65cm-1, 86.69%T
1639.97cm-1, 85.75%T
%T
2926.46cm-1, 85.50%T
1722.83cm-1, 82.58%T
1122.05cm-1, 82.52%T
80
1016.27cm-1, 79.19%T
1073.68cm-1, 79.66%T
1280.87cm-1, 77.61%T
75
3
3
3
7
. 4
2
c
m
-
1
,
7
6
. 5
0
%
T
70
65
5 2 5 .0 6 c m -1 ,
6 3 .6 3 % T
512.80cm-1,
63.63%T
559.20cm-1,
63.61%T
472.44cm-1,
63.45%T
487.94cm-1,
63.35%T
653.70cm-1,
62.20%T
610.68cm-1, 62.09%T
740.68cm-1, 65.82%T
461.82cm-1, 62.85%T
61
4000
3500
3000
2500
2000
1500
1000
500 450
cm-1
Name
OSL ST 4
Description
Sample 006 By OUAT CIF Date Tuesday, October 30 2018
Wavenumber(Cm-1)
A
102
100
2053.67cm-1, 98.51%T
2029.89cm-1, 98.59%T
2224.81cm-1, 98.59%T
1988.69cm-1, 98.66%T
2177.37cm-1, 98.74%T
2153.49cm-1, 98.75%T
2195.31cm-1, 98.86%T
890.80cm-1, 89.63%T
1714.17cm-1, 89.20%T
1920.27cm-1, 98.78%T
1370.22cm-1, 87.92%T
2008.90cm-1, 98.85%T
1115.66cm -1, 84.96% T
95
90
85
80
2
8
3
2
.
8
8
c
m
-
1
,
8
3
.
0
5
%
1288.96cm -1, 83.35% T
1076.19cm-1, 86.39%T
1449.03cm-1, 84.26%T
1411.59cm-1, 85.97%T
T
2944.82cm-1, 81.26%T
75
7
%T
4
5
. 2
6
c
m
-
1
,
7
5
5
9
5
. 2
. 6
4
3
c
%
T
3318.81cm -1, 73.67% T
70
m
- 1
,
6
9
. 0
4
%
T
65
60
55
50
45
40
35
1021.21cm-1, 28.49%T
30
27
4000
3500
3000
2500
2000
1500
1000
500 450
cm-1
Name
OSLL4
Description
Sample 007 By OUAT CIF Date Tuesday, October 30 2018
Wavenumber(Cm-1)
B
100
99
2105.99cm-1, 98.84%T
1989.68cm-1, 98.51%T
98
2152.94cm-1, 98.31%T
2324.20cm-1, 98.42%T
2183.05cm-1, 98.58%T
2054.42cm-1, 98.64%T
2169.93cm-1, 98.69%T
2203.74cm-1, 98.91%T
97
2968.29cm-1, 97.17%T
3445.11cm-1, 96.55%T
%T
96
1310.86cm-1, 96.90%T
1451.76cm-1, 96.94%T
1059.31cm-1, 96.61%T
1377.51cm-1, 96.64%T
716.74cm-1, 96.32%T
763.81cm-1, 96.10%T
1330.91cm-1, 95.98%T
744.09cm-1, 95.79%T
1251.23cm-1, 95.70%T
1263.07cm-1, 95.66%T 922.16cm-1, 95.57%T
862.84cm-1, 95.26%T
95
648.36cm-1, 95.83%T
542.22cm-1, 94.61%T
941.79cm-1, 95.73%T
455.03cm-1, 94.38%T
498.14cm-1, 94.51%T
975.96cm-1, 94.20%T
594.96cm-1, 93.96%T
524.12cm-1, 94.63%T
1103.24cm-1, 93.58%T
778.22cm-1, 93.31%T
691.90cm-1, 93.14%T
1127.75cm-1, 95.35%T
1191.69cm-1, 94.62%T
94
93
569.40cm-1, 94.83%T
92
1172.60cm-1, 92.03%T
891.16cm-1, 92.10%T
1021.67cm-1, 92.25%T
91
90
90
4000
1738.07cm-1, 90.02%T
3500
3000
2500
2000
1500
1000
500 450
cm-1
Name
Giberlic acid
Description
Sample 005 By OUAT CIF Date Tuesday, October 30 2018
Wavenumber(Cm-1)
C
Effect of different nitrogen sources
Effect of additional nitrogen supplementation
on gibberellic acid production was
premeditated. The maximum gibberellic acid
production of 95.390µg/ml was witnessed,
while the CDB medium was supplemented
with 0.5% sodium nitrate inoculated with the
isolate OSLST-4whereas, the maximum
gibberellic acid production of 78.656µg/ml
with 0.3% ammonium chloride inoculated
with the isolate OSLL-4 (Fig. 8). Our results
corroborated with the outcome of Sagar and
Desai et al., (2017) i.e who reported NH4Cl
(0.5%) as the outstanding nitrogen source for
GA3 production for the isolate K-37 in
contrast to the report also spotted by the same
author i.e. 0.5% urea was also good for
another isolate K-8. The results suggested that
with magnification in carbon and nitrogen
sources concentration the production of
GA3diminished significantly. This might be
endorsed to the fact that the low concentration
of carbon and nitrogen source in the medium
terminates exponential growth of microorganism but elicits secondary metabolism
(Escmilla et al., 2000).
1017
Int.J.Curr.Microbiol.App.Sci (2020) 9(11): 1007-1020
Effect of NaCl
The isolates OSLST-4 and OSLL-4 produced
maximum amount of GA3 under optimized
fermentation condition at 5% and 3% of NaCl
supplemented to CDB medium (Fig. 9) with
optimal C and N and physical parameters. In
agreement to our observations Rasulov et al.,
(2010) cited that salinity not only affects the
growth and development of microorganisms
but also regulates the secondary metabolite
production in the medium.
The maximum production of GA3 by the two
fungal isolates OSLST-4 and OSLL-4 were
observed in the Czepeak’s dox medium on 8th
day (192hrs) and 10th day (240hrs), at 300C
and 250C in pH 8 and 6, by using carbon
(sucrose 0.5% and starch 1%) and nitrogen
(sodium nitrate 0.5% and ammonium chloride
0.3%) sources, with NaCl concentration (5%
and 3%) respectively (Table 2).
Characterization of GA3 production by the
Isolates
TLC Analysis
The crude extracts of the isolates were
subjected to preparatory TLC. Standard GA3
procured from (Himedia, pvt. ltd, Mumbai,
India) was served as control. Both the extracts
and standard GA3 showed similar RF value of
0.7 confirming the presence of GA3 in the
extract (Fig. 10).
FTIR analysis
FTIR spectra revealed the broad spectrum
absorption band. The major characteristic
peaks achieved by FTIR in standard GA3 (Fig.
11) were at 1000-1260 cm-1 corresponds to
(C-O) group (stretching and asymmetrical
coupled vibration) i.e. the peak at 1127 cm-1.
The band at 1451cm-1 resembles to (C=C)
group(stretch consist of asymmetric type).
The peak at 1738cm-1 allied to (C=O)
stretching from carboxylic group. Further, the
peak perceived at 3445cm-1 corresponds to
(OH) group (intra-molecular hydrogen
bonding). For extracted GA3 of OSLST-4
(Fig. 11) the peaks were achieved at 1122cm-1
corresponds to (C-O) group, the peak found at
1722cm-1 attributed to (C=O) group, and the
peak endorsed to 3337cm-1 signposted the
presence of (OH) group. The peak observed at
1445cm-1 ascribed to (C=C) group (stretching
consist of asymmetric). For extracted GAs of
OSLL-4 (Fig. 11) the peaks were gained at
1115cm-1 (C-O), 1714cm-1 (C=O), the peak
observed at 1449cm-1 (C-C) group
(Asymmetric stretching), the peak observed at
3318cm-1 attributed to (OH) group.
The result of the infrared spectroscopy of the
extracted GA3 using FTIR presented that it
contained four out of four main characteristic
bands existent on the standard GA3 sample.
All the perceived characteristic FTIR peaks
communally confirm the presence of GA3 like
substance in the extract.
In conclusion through this scientific
investigation we place in record, isolation of
endophytic fungi from rice plant with the
ability for GA3 production. The isolates can
be exploited industrially for commercial
production of GA3 with further scientific
investigations. Though, it is a preliminary
endeavour, studies such as this is a
prerequisite to exploit the biotechnological
potential of microbes of special environment,
more specifically the endophytic fungi, for
production of growth promoting compounds.
Acknowledgement
The authors are thankful to HoD, Department
of Botany, College of Basic Science and
Humanities, OUAT, for providing laboratory
facility. The authors also deeply acknowledge
the help and encouragement of Director,
1018
Int.J.Curr.Microbiol.App.Sci (2020) 9(11): 1007-1020
College of Basic Science and Humanities,
OUAT, during the study.
References
Barborakova, Z., Labuda, R., Haubl, G.,
Tancinova, D., 2012. Effect of glucose
concentration and growth conditions on the
fungal biomass, pH of media and
production of Fumagillin by a nonpathogenic strain Penicillium scabrosum. J
Microbiol. Biotechnol. Food Sci. (1):466–
477.
Barnett, HL., Hunter, BB., 1996. Illustrated
Genera Of Imperfect Fungi. APS Press, St.
Paul, Minnesota, USA.
Bhattrani, S., Rana, p., Dhakal, M., Dinesh, B.,
2014. Diversity and Biological activities of
endophytic
fungi
from
Nepalese
Woodfordia fructicosa (Linn) Kurz. World
J of Pharmaceu. Sci.; 2(11):1591-1597.
Bilkay, IS., Karakoc, S., Aksoz, N., 2010. Indole3-acetic acid and gibberellic acid
production in Aspergillus niger. Turk. J.
Biol. 34: 313-318.
Bills, GF., and Polishook, JD., 1993. Microfungi
from Crpinus caroliniana. Can J Bot.,
69:1477-1482.
Cavell, BD., MacMillan, J., Pryce, RJ., Sheppard,
AC., 1967. Thin layer chromatography of
gibberellic acid. Phytochem. 6: 867-871.
Cihangir, N., and Aksiiza, N., 1997. Evaluation of
some food industry wastes for production
of gibberellic acid by fungal source. Env.
Technol; 18: 533-537.
Corona, A., Sanchez, D., Agosin, E., 2005. Effect
of water activity on gibberellic acid
production by Gibberella fujikuroi under
solid-state
fermentation
conditions.
Process Biochem; 40: 2655-2658.
Crozier, A., 2000. Biosynthesis of hormones and
elicitor molecules. In: Buchanan BB,
Gruissem W, Jones RL (eds) Biochemistry
and Molecular Biology of Plants MD:
American Society of Plant Physiologists,
Rockville, pp 850–929.
Davies, PJ., 2010. The Plant Hormones: Their
Nature, Occurrence, and Functions. In:
Plant Hormones. Davies PJ (ed) Springer,
Dordrecht, pp 1–15.
Escamilla, EM., Dendooven, L., Magafia, IP.,
Parra, R., and De La Torre, M., 2000.
Optimization of gibberellic acid production
by immobilized Gibberella fujikuroi
mycelium in fluidized bioreactors. J of
Biotechnol; 76: 147-155.
Fisher, PJ., and Petrini, O., 1987.Location of
fungal endophytes in tissues of Suaeda
fructicosa: a prelimnary study. Trans. Br.
Mycol. Soc., 89: 246-249.
Gilman, JC., 1971. A manual of soil fungi. Ames,
Iowa, Iowa State College Press.;p.450.
Gyaneshwar, P., James, E.K., Mathan, N., Reddy,
P.M., Reinhold-Hurek, B., Ladha, J.K..,
2001. Endophytic colonization of rice by a
diazotrophic strain of Serratia marcescens.
J. Bacteriol. 183, 2634-2645.
Henderson, J.H.M., Graham, H.D., 1961.
Reaction of giberllic acid and giberllins
with Folin-Wu Phospho molybdic Acid
Reagent and it’s use for quantitative assay
Plant Physio. The Carver Foundation,
Tuskegee Institute, Alabama pg 405-408.
Kahlon, S.S., Malhotra, S., 1986. Production of
gibberellic acid by fungal mycelium
immobilized in sodium alginate. Enz.
Microbial Technol., 8, 613-616.
Khan, AL., Hamayun, M., Kang, SM., Kim, YH.,
Jung, HY., Lee, JH., Lee, IJ., 2012.
Endophytic
fungal
association
via
gibberellins and indole acetic acid can
improve plant growth under abiotic stress:
an example of Paecilomyces formosus
LHL10. BMC Microbiol. 12:1.
Khan, AL., Hamayun, M., Kim, YH., Kang, SM.,
Lee, IJ., 2011. Ameliorative symbiosis of
endophyte (Penicillium funiculosumsp.
LHL06) under salt stress elevated plant
growth of Glycine max L. Plant
PhysiolBiochem. 49:852–861.
Kumar, PKR., and Lonsane, BK., 1990. Solidstate fermentation: physical and nutritional
factors influencing gibberellic acid
production. Applied Microbiol and
Biotechnol; 34: 145-148.
Kumar, PKR., 1987. Extraction of Gibberellic
acid from dry moldy bran produced under
solid state fermentation. Process biochem.:
139 – 143.
Lale, G., Gadre, R. 2010. Enhanced production of
gibberellin A4 (GA4) by a mutant of
1019
Int.J.Curr.Microbiol.App.Sci (2020) 9(11): 1007-1020
Gibberella fujikuroi in wheat gluten
medium. J Indus. Micro. Biotech., 37(3):
297-306.
Lee, D.H., Kim, Y.S., Lee, C.B., 2001. The
inductive responses of the antioxidant
enzymes by salt stress in the rice (Oryza
sativa L.). J. Plant Physiol. 158, 737-745.
Machado, CMM., Soccol, CR., and Pandey, A.,
2002. Gibberellic acid production by solid
state fermentation in coffee husk. Applied
Biochem and Biotechnol; 102: 179192.
Pandya, ND., and Desai, PV., 2013.Gibberellic
acid production by Bacillus cereus isolated
from the rhizosphere of sugarcane. J of
Pure and Applied Microbiol.7(4):32393242.
Pastrana, LM., Gonz~ilez, MP., Torrado, A., and
Murado, M A., 1995. A fed-batch culture
model for improved production of
gibberellic acid from a waste medium,
Biotechnology Letters; 17: 263-268.
Patil, G., and Patil, R., 2014. Isolation and
characterization
of
Actinomycetes
producing Gibberellic acid. Int. J. Res., 3:
1400-1403.
Prayitno, J., J. Stefaniak., J. McIver., J. J.
Weinman., F, B. Dazzo., J, K. Ladha., W,
Barraquio., Y, G, Yanni., and B, G, Rolfe.,
1999. Interactions of rice seedlings with
bacteria isolated from rice roots. Aust. J.
Plant Physiol. 26: 521–535.
Radu, S., Kqueeny., 2002. Prelimnary screening
of endophytic fungi from medicinal plant
in Malaysia for antimicrobial and
antitumour activity. Malaysian J. Med.Sci.;
92(2):23-30.
Rangaswamy, V., 2012. Improved production of
Gibberellic acid by Fusarium moniliforme.
J Microbiol Res 2(3): 51-55.
Rasulov, BA., 2010. Influence of bacteria of
Azotobacter genus on growth,development
and productivity of different wheat
varieties
in
associative
symbiosis.
Uzbekistan Biol journal.; 1(2): 17-25.
Sagar, A,. Desai. 2017. Isolation and
characterization of gibberellic acid (GA3)
producing rhizobacteria from sugarcane
roots. Bioscience Discovery. 8(3): 488494.
Schulz, BU., Wanke, S., and Draeger, HJ., 1993.
Endophytes from herbaceous plants and
shrubs:
effectiveness
of
surface
sterilization methods. Mycol Res., 97:
1447-1450.
Shukla, R., Chand, S., Srivastava, AK., 2005.
Batch kinetics and modelling of gibberellic
acid production by Gibberella fujikuroi.
Enzyme Microb Tech.;36:492-497.
Silverstein, R. M., Webster, F. X., Kiemle, D.J.,
Bryce
D.L.,
2014.
Spectrometric
identification of organic compounds. John
Wiley and Sons Inc.,New Jersey US.
Strobel GA.2002. Microbial Gifts from rain
forests.Can J Plant Path., 24: 14-20.
Tomasini, A., Fajardo, C., and Barrios, Gonzfiles
J., 1997. Gibberellic acid production using
different solidstate fermentation systems,
Word J of Microbiol and Biotechnol; 13:
203-206.
Wei, Z., Liang, X., Pendlowski, H., Hillier, S.,
Suntornvongsagu, K., Sihanonth, P., Gadd,
GM., 2013. Fungal biotransformation of
zinc silicate and sulfide mineral ores.
Environ Microbiol. 15:2173–2186.
How to cite this article:
Anchal Tripathy and Chandi C. Rath. 2020. Endophytic Fungi from Oryza sativa L.: Isolation,
Characterization,
and
Production
of
GA3
in
Submerged
Fermentation.
Int.J.Curr.Microbiol.App.Sci. 9(11): 1007-1020. doi: />
1020