Financial analysis and decision making
Bạn đang xem bản rút gọn của tài liệu. Xem và tải ngay bản đầy đủ của tài liệu tại đây (3.37 MB, 428 trang )
FINANCIAL
ANALYSIS AND
DECISION MAKING
This page intentionally left blank.
FINANCIAL
ANALYSIS AND
DECISION MAKING
Tools and Techniques to Solve
Financial Problems and Make
Effective Business Decisions
DAVID E. VANCE, MBA, CPA, JD
McGraw-Hill
New York Chicago San Francisco Lisbon London Madrid
Mexico City Milan New Delhi San Juan Seoul
Singapore Sydney Toronto
Copyright © 2003 by The McGraw-Hill Companies, Inc. All rights reserved. Manufactured in the
United States of America. Except as permitted under the United States Copyright Act of 1976, no part
of this publication may be reproduced or distributed in any form or by any means, or stored in a database or retrieval system, without the prior written permission of the publisher.
0-07-141559-9
The material in this eBook also appears in the print version of this title: 0-07-140665-4
All trademarks are trademarks of their respective owners. Rather than put a trademark symbol after
every occurrence of a trademarked name, we use names in an editorial fashion only, and to the benefit
of the trademark owner, with no intention of infringement of the trademark. Where such designations
appear in this book, they have been printed with initial caps.
McGraw-Hill eBooks are available at special quantity discounts to use as premiums and sales promotions, or for use in corporate training programs. For more information, please contact George
Hoare, Special Sales, at or (212) 904-4069.
TERMS OF USE
This is a copyrighted work and The McGraw-Hill Companies, Inc. (“McGraw-Hill”) and its licensors
reserve all rights in and to the work. Use of this work is subject to these terms. Except as permitted
under the Copyright Act of 1976 and the right to store and retrieve one copy of the work, you may not
decompile, disassemble, reverse engineer, reproduce, modify, create derivative works based upon,
transmit, distribute, disseminate, sell, publish or sublicense the work or any part of it without
McGraw-Hill’s prior consent. You may use the work for your own noncommercial and personal use;
any other use of the work is strictly prohibited. Your right to use the work may be terminated if you
fail to comply with these terms.
THE WORK IS PROVIDED “AS IS”. McGRAW-HILL AND ITS LICENSORS MAKE NO GUARANTEES OR WARRANTIES AS TO THE ACCURACY, ADEQUACY OR COMPLETENESS OF
OR RESULTS TO BE OBTAINED FROM USING THE WORK, INCLUDING ANY INFORMATION THAT CAN BE ACCESSED THROUGH THE WORK VIA HYPERLINK OR OTHERWISE,
AND EXPRESSLY DISCLAIM ANY WARRANTY, EXPRESS OR IMPLIED, INCLUDING BUT
NOT LIMITED TO IMPLIED WARRANTIES OF MERCHANTABILITY OR FITNESS FOR A
PARTICULAR PURPOSE. McGraw-Hill and its licensors do not warrant or guarantee that the functions contained in the work will meet your requirements or that its operation will be uninterrupted or
error free. Neither McGraw-Hill nor its licensors shall be liable to you or anyone else for any inaccuracy, error or omission, regardless of cause, in the work or for any damages resulting therefrom.
McGraw-Hill has no responsibility for the content of any information accessed through the work.
Under no circumstances shall McGraw-Hill and/or its licensors be liable for any indirect, incidental,
special, punitive, consequential or similar damages that result from the use of or inability to use the
work, even if any of them has been advised of the possibility of such damages. This limitation of liability shall apply to any claim or cause whatsoever whether such claim or cause arises in contract, tort
or otherwise.
DOI: 10.1036/0071415599
Contents
Chapter 14
Working Capital and Cash Budgeting 217
Working Capital 217
Cash Budgeting 218
Opening a New Facility 221
Line of Credit 226
Seasonal Cash Demand 228
Managing Working Capital 230
Summary 248
Chapter 15
Master Budgets and Variance Analysis 251
Basic Budgets 252
Master Budgets 253
Master Budgets Versus Financial Statements 259
Supplemental Budgets 261
Summary 261
Chapter 16
Pricing Theory 263
Cost-Centered Pricing 263
Market-Centered Pricing 265
Engineered Cost 269
Price Elasticity 270
Product Life Cycle 272
Transfer Pricing 273
Opportunistic Pricing 275
Microeconomics Pricing 277
Summary 286
Chapter 17
Advanced Cost Concepts and Allocation of Resources 289
Cost Drivers 289
Activity-Based Costing 291
ix
For more information about this title, click here.
CONTENTS
PREFACE
xi
ACKNOWLEDGMENTS
xv
Chapter 1
Financial Statements and Accounting Concepts 1
Income Statement 1
Balance Sheet 5
Statement of Cash Flows 10
Accounting Definitions 13
Generally Accepted Accounting Principles 14
Summary 17
Chapter 2
Financial Ratios and Other Measures of Performance 19
Measurement of Operating Performance 19
Measures of Financial Performance 30
Risk Measurement 38
Cautions on Ratios 47
Summary 48
Chapter 3
Factors Determining Interest Rates and Required
Debt Yields 51
Components of Interest: Risk-Free Rate of Return, Default, Liquidity,
and Maturity Risk Premiums 52
Effect of Supply and Demand on Interest Rates 56
Summary 65
Chapter 4
Forecasting Yield and Risk 67
Forecasting with A Priori Probabilities 68
v
Copyright 2003 by The McGraw-Hill Companies, Inc. Click Here for Terms of Use.
vi
Contents
Forecasting with Historical Data 75
Using Expected Values and Standard Deviations to Make Decisions 77
Portfolio Theory 81
How to Use Required Rate of Return 85
Summary 85
Chapter 5
Time Value of Money 87
Four Classes of Time Value Problems 87
Future Value 88
Future Value: Annual Growth Rates 90
Future Value Formula 90
Present Value Theory and Mathematical Formula 91
Present Value Using Tables 92
Present Value of an Annuity 94
Loan Payments 94
Loan Amortization Schedules 96
Mathematical Formula for Present Value of an Annuity 98
Future Value of an Annuity 98
Mathematical Formula for Future Value of an Annuity 99
Summary 100
Chapter 6
Bond Valuation 101
Bond Valuation 101
Callable Bonds 104
Convertible Bonds 106
Bond Yield 107
Yield to Call 112
Interpolation Theory 114
Summary 116
Chapter 7
Leases 119
Operating Versus Capital Leases 119
Imputed Interest Rates 120
Contents
vii
Effect of Deposits and Prepayments on the Imputed Interest Rate 122
Capitalizing Leases 125
Summary 128
Chapter 8
Stock Valuation 129
Stock Valuation 129
Computing Stock Value 132
Stock Yield 136
Stock Valuation Based on Cash Flow 136
Stock Valuation Based on Earnings 138
Stock Valuation Based on Sales 140
Summary 142
Chapter 9
Cost of Capital 143
Cost of Debt Capital 143
Cost of Preferred Stock Capital 144
Cost of Common Equity 145
Cost of New Common Equity Capital 148
Cost-Free Capital 151
Weighted Average Cost of Capital (WACC) 151
When Should New Common Stock Be Issued? 154
Cost of Leased Capital 158
Marginal Cost of Capital 158
Decision Rules for the Optimal Capital Budget 160
Summary 162
Chapter 10
Capital Budgeting 165
Methods for Evaluating Capital Projects 166
Payback Method 166
Discounted Payback Method 168
Net Present Value 170
Internal Rate of Return 171
viii
Modified Rate of Return 175
Comparison of Capital Budgeting Methods 178
Summary 178
Chapter 11
Cash Flow Estimation for Capital Budgeting 181
Capital Budgeting Ground Rules 181
Capital Budgeting Format 183
Replacement Equipment 185
Inflation and Price Pressure 185
Spreadsheet Modeling 185
Summary 187
Chapter 12
Product Costing 189
Cost Versus Expense 189
Financial Accounting Versus Managerial Accounting 190
Unallocated Manufacturing Overhead 193
Expenses Versus Inventory 197
Full Absorption Cost of Purchased Merchandise 197
Make or Buy Decisions 198
Managerial Accounting 199
Gross Profit Versus Contribution 201
Summary 203
Chapter 13
Break-Even Analysis and Modeling 205
Break-Even Analysis 205
Modeling Profit 208
Sales Volume Break-Even 210
Relevant Range 212
Reality Testing 212
Break-Even and Risk 213
Summary 216
Contents
Contents
x
Job Costing 293
Cost Drivers as a Method for Overhead Allocation 297
Traditional Overhead Allocation 298
Joint Products: Two Product Problem 299
Theory of Constraints 300
Profit Ladder 303
New Product Selection 307
Summary 310
Chapter 18
Labor Costs 313
Overtime 313
Turnover Costs 315
Workers’ Compensation 316
Unemployment Compensation Taxes 319
Summary 321
APPENDIXES
323
Appendix A: Future Value Interest Factor: FVIF(i, n) 324
Appendix B: Future Value Interest Factor for an Annuity:
FVIFA(i, n) 326
Appendix C: Present Value Interest Factor: PVIF(i, n) 328
Appendix D: Present Value Interest Factor for an Annuity:
PVIFA(i, n) 330
Appendix E: Chapter Exercises 332
Appendix F: Exercise Answers 383
INDEX
399
PREFACE
Financial analysis is about shaping the future. It provides the tools
management needs to make sophisticated judgments about complex and challenging business issues. As a corporate controller,
chief financial officer, and retired CPA, I found that outside auditors, purchasing managers, accountants, and corporate executives
were making bad decisions because they didn’t understand how
to apply financial analysis to real-world situations. One example
was a company president who was signing leases with a 24% imputed interest rate because neither he nor his auditors understood
how to analyze leases.
Three principles guide this book: (1) it should get to the point
without forcing the reader to wade through a lot of text, (2) there
should be plenty of examples, and (3) the rationale for each analytical technique should be plainly stated.
In this book, we provide an overview of the three main financial statements: income statement, balance sheet, and statement
of cash flows, and we discuss the major landmarks in each. We discuss financial ratios and other measures of performance that management can use to detect problems and isolate their root cause.
Interest rates are a factor in a number of decisions, including
the required rate of return on a project, expansion, refinancing,
lease versus buy decisions, and others. We discuss the factors that
cause interest rates to rise or fall and what can be done about them.
The world is complicated, and things never unfold exactly according to plan. We discuss measures of risk in terms of yield or
output and ways to manage that risk.
In the chapter on the time value of money, we discuss the accumulation of future wealth in terms of both a single investment
and periodic investments. We also find the present value of investments, that is, the value in today’s dollars of cash that will not
be received until some future date. The principles discussed can
be applied to savings, loans, mortgages, leases, annuities, and capital budgeting decisions. This chapter also provides the formulas
xi
Copyright 2003 by The McGraw-Hill Companies, Inc. Click Here for Terms of Use.
xii
Preface
needed to create computer programs or spreadsheets tailored to
the needs of individual businesses.
The chapter on bond valuation demonstrates how the value
of bonds rises as interest drops, and how the value of bonds drops
as interest rates rise. This has implications for both investments
and issuance of bonds. We also discuss bond yield to maturity and
yield to call.
The chapter on leases builds on the time value of money principles and integrates the effect of deposits, prepayments, and application fees to find the real cost of leasing in such a way as to
make leases with different terms comparable to each other and to
other financing sources.
A number of methods to value stocks are discussed along with
the strengths and weaknesses of each. Stock valuation is important
for investing, deciding on convertible bond terms, and initial public offerings.
The cost of capital is the composite cost of all sources of capital used by a company. It is used as a benchmark for determining
whether management is creating or destroying wealth, and in making decisions about investments in new projects or acquisitions.
The marginal cost of capital is the cost of incremental blocks of capital, which can be compared to the return on projects to determine
the optimum capital budget.
In the chapter on capital budgeting, we discuss five methods
for analyzing capital projects, that is, projects for which the payback is stretched out over several years. These methods include (1)
payback, (2) discounted payback, (3) net present value, (4) internal
rate of return, and (5) modified internal rate of return. We also
discuss decision rules for ranking projects for each method of analysis. There is also a chapter on estimating cash flow for capital
budgeting.
Correct product costing is critical to decisions about pricing,
make versus buy, and production volumes. We discuss full absorption costing, which is used for valuing inventory, and the cost
of goods sold, and we discuss variable costing. Each approach to
costing is used to make a different class of decision.
We discuss break-even analysis, a technique that can be expanded to address issues of production volume, target profits, and
Preface
xiii
overhead targets. It can also be used to model strategic decision
options and test the reasonableness of each.
Cash is oxygen to a company, and cash budgeting and working capital management are important keys to assure that a company has enough cash. We discuss the cash demand of opening a
new facility, cash required for accounts receivable and inventory
to support sales growth, and working capital as a source of cash.
Operating budgets are an important tool for management to
guide a company’s progress, but traditional budgets often fail to
account for changes in sales volume. Master budgets, on the other
hand, are designed to be flexible as sales volume changes. This flexibility improves variance analysis and helps improve placement of
responsibility.
Most finance books concentrate on costs, but few discuss pricing in any depth even though correct pricing decisions are crucial
to a company’s financial health. We discuss a number of price setting techniques as well as the effects and strategic implications of
supply and demand, market segmentation, product differentiation,
and product life cycle.
We also discuss a number of financial analysis and decisionmaking techniques that don’t fit neatly into any of the foregoing
categories. These include cost drivers, activity-based costing, and
job costing. We discuss two approaches to resource allocation: the
theory of constraints and the profit ladder. We also discuss issues
arising when discontinuing old products and selecting new products for introduction.
Finally, we discuss labor costs. Labor is one of the largest costs
of any company, but it can be significantly reduced without layoffs by managing overtime, turnover, workers’ compensation, and
unemployment costs. We discuss techniques for better management of these areas and quantify the impact of improvements.
In sum, this book embraces a broad range of financial analyses and can be used as a primer by finance, accounting, and general management on the tools and techniques to solve financial
problems and make effective business decisions.
Dave Vance
This page intentionally left blank.
ACKNOWLEDGMENTS
I would like to thank the more than 300 corporate managers and
graduate and undergraduate students who have used, commented
on, and vetted various versions of this text. Their comments, questions, and criticisms have helped sharpen explanations and make
sample problems more realistic. Their relentless probing of why
things work as they do has shifted the focus of the book from the
theoretical to the practical. Anything good about this book I owe
to them. The faults are my own.
xv
Copyright 2003 by The McGraw-Hill Companies, Inc. Click Here for Terms of Use.
This page intentionally left blank.
CHAPTER
1
Financial Statements and
Accounting Concepts
H
ow does a company make money? A company can succeed only
if it identifies and meets its customers’ needs. It must also make a
profit, but is that enough? Not quite. A company can make a profit
every year and still run out of cash.
This chapter discusses three financial statements that provide
a good understanding of company performance: (1) the income
statement, (2) the balance sheet, and (3) the statement of cash flows.
We will also define some of the terms accountants use and the philosophy underlying why accountants do what they do.
If you have a strong accounting background, you may want
to skip this chapter. However, if you have no accounting background, or if it has been a long time since your last accounting
course, take a few minutes to review this chapter. It will provide
an overview of the accounting concepts that support financial decision making.
INCOME STATEMENT
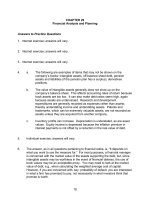
Consider the income statement of the Gladstone Book Store (Figure 1–1). Last year it had revenue of $1,000,000. Revenue is another
name for sales. The books they sold cost them $500,000. This is
called the cost of goods sold (COGS). The difference between revenue and COGS is called gross profit. Gross profit is the amount
1
Copyright 2003 by The McGraw-Hill Companies, Inc. Click Here for Terms of Use.
CHAPTER 1
2
FIGURE
1–1
Gladstone Book Store Income Statement
GLADSTONE BOOK STORE
Income Statement
For the year ended 12/31/2002
Revenue
Cost of goods sold
Gross profit
Advertising, sales, and marketing
Store operations
Depreciation
Total operating expense
1,000,000
500,000
500,000
50,000
350,000
10,000
410,000
Operating profit
90,000
Interest
25,000
Earnings before tax
65,000
Taxes
15,000
Net income
50,000
generated from the sale of books before operating expenses are subtracted. Gladstone has a gross profit of $500,000.
Expenses are separated into cost of goods and operating expenses because they have different characteristics. Cost of goods
sold tends to increase in rough proportion to sales, whereas operating expenses should not increase in proportion to sales.
Gross profit allows us to compute gross margin, which is gross
profit divided by revenue. The relationship between revenue,
COGS, gross profit, and gross margin is given in Eq. 1–1.
Gross profit
Revenue Ϫ COGS
Gross margin ϭ ᎏᎏᎏ ϭ ᎏᎏ
Revenue
Revenue
(Eq. 1–1)
Gross margin represents the percentage of each dollar available for operating expenses, financing costs, taxes, and profit after
COGS are subtracted from revenue. Gross margin is important because it can be used to help forecast gross profit as revenue rises
or falls. The gross margin for Gladstone Books is
Financial Statements and Accounting Concepts
3
$500, 000
$1,000,000 Ϫ $500,000
Gross margin ϭ ᎏᎏᎏ ϭ ᎏᎏ ϭ 50%
$1,000,000
$1,000,000
Operating expenses are sometimes called overhead. It includes things like advertising, sales, and marketing costs; salaries
and rent for store operations; and depreciation. Gladstone’s operating expenses were $410,000.
Operating profit is gross margin less operating expenses. Operating profit is a measure of the fundamental performance of a
company, independent of a company’s financing or tax structure.
It is also called earnings before interest and taxes (EBIT). Gladstone’s operating profit was $90,000.
Since interest is tax deductible, it is subtracted from operating profit before taxes are computed. Gladstone’s earnings before
taxes (EBT) were $65,000. On an income statement, taxes mean
taxes on income. Real estate, franchise, or other taxes not related
to income are included in either the cost of goods sold, if they are
related to the purchase or manufacture of a product, or the operating expenses, if they are not. Gladstone’s income taxes were
$15,000.
Net income is income after all expenses, including interest and
taxes, are subtracted. It is the amount available for distribution of
profits or to increase retained earnings. Gladstone’s net income is
$50,000.
The Gladstone Book Store example uses a number of important terms. Having crisp definitions for these terms will be important as we discuss decision making in this and other chapters. The
terms are as follows:
Cost of goods sold Cost of goods sold are all the costs necessary to make a product or to deliver a service. It also includes
the cost to make an item ready for sale. In Gladstone, the cost of
goods sold (COGS) includes the cost of books, the cost of transportation if Gladstone paid for it, and any other work that had to
be performed to prepare the goods for sale. Suppose, for example,
books had to be uncrated by store employees; the labor for uncrating would become part of the COGS. Other names for cost of
goods sold are cost of products sold (COPS) or cost of services
(COS).
4
CHAPTER 1
Gross profit Gross profit is the amount of revenue left over
after the cost of goods sold is subtracted. Gross profit increases
more or less linearly with increases in revenue. Conversely, as revenue drops, the gross profit available to cover operating expenses,
interest, taxes, and profit drops as well.
Gross margin Gross margin is simply the ratio of gross profit
to revenue. In Gladstone, gross margin is 50%, that is, gross profit
of $500,000 divided by revenue of $1,000,000. Gross margin is important because it can be used as a performance measure. It is also
important because it can be used as an estimator for break-even
analysis, budgets, and other analytical techniques.
Overhead Overhead, also called operating expenses, is all expenses not included in the cost of goods sold except interest and
taxes.
Earnings before tax Earnings before tax (EBT) is revenue
less all expenses except income taxes.
Taxes Only taxes assessed on income are included in this income statement line.
Net income Net income is the amount of income available to
the owners or shareholders of the business.
Performance Standards
Suppose a company has a 50% cost of goods sold and a 50% overhead cost. How do we know whether 50% cost of goods sold is
good or bad? How do we know whether overhead costs are out of
control or as good as can be expected?
Ratios for other companies are summarized and published by
Robert Morris Associates (RMA) and by Dun & Bradstreet. Ratios
are provided by industry, as determined by SIC (standard industrial classification) code, and by the size of business in terms of revenue. RMA and D&B reports are available in most libraries. A U.S.
Department of Commerce manual, available in most libraries,
cross-references industries and SIC codes.
Financial Statements and Accounting Concepts
5
Another way to determine whether a company’s cost of goods
sold, overhead, or gross margin is appropriate is through benchmarking. Benchmarking is the process of gathering the financial
statements of the best companies in an industry, and computing
their financial ratios.
Closing the Books and the Income Statement
At the end of each accounting period, say, a year, sales and expense transactions are summarized into categories like revenue,
cost of good sold, and overhead. Certain period-end adjustments,
for example, depreciation, are added or subtracted as appropriate,
and the result of these transactions for a period are then formatted
into an income statement.
After the income statement is formatted, revenue and expense
accounts are zeroed out by transferring their balances to a profit
account. Profits are then transferred (added to) retained earnings,
as are losses, if any.
BALANCE SHEET
A balance sheet has three major sections: assets, liabilities, and equity. Assets are all the things a business has to make money with.
Liabilities are the money it owes to others, and equity is what
would be left over if all assets were sold at their stated value and
all debts were paid off. Another way to think about a balance sheet
is that assets are the resources a company has, and liabilities and
equity are the means for financing those resources. These have a
critical relationship because assets must always equal liabilities plus
equity.
Assets ϭ Liabilities ϩ Equity
(Eq. 1–2)
Figure 1–2, the Balance Sheet for Gladstone Books, shows that
it has assets of $181,000 at the end of 2002. It also had liabilities of
$88,200, and equity of $92,800.
Assets At its simplest, assets are everything a company has at
its disposal to use: real estate (whether or not financed), furniture,
CHAPTER 1
6
FIGURE
1–2
Balance Sheet for Gladstone Books
GLADSTONE BOOK STORE
Balance Sheet
For the year ended of 12/31/2002
2002
Cash
Accounts receivable
2001
29,600
9,400
2,400
7,400
120,000
90,000
Current assets
159,000
99,800
Plant and equipment
22,000
7,000
181,000
106,800
9,800
800
21,000
7,500
6,100
15,000
Leases—current portion
3,600
3,600
Current liabilities
35,200
32,200
Bank Loan—long term
Inventory
Total assets
Accounts payable
Accrued payroll
Bank Loan—current portion
45,000
48,000
Leases—long term
8,000
8,800
Total liabilities
88,200
89,000
Paid in capital at par
1,000
1,000
Retained earnings
91,800
16,800
Total equity
92,800
17,800
181,000
106,800
Liabilities and equity
fixtures, machinery, cash, securities, accounts receivable, and
inventory.
Liabilities Liabilities are money owed to others. Examples of
liabilities include mortgage balances, bank loans, accounts payable,
accrued payroll (wages earned by employees at the financial statement date, but have not yet been paid to them), and lease capital
balances (the present value of lease payment obligations).
Financial Statements and Accounting Concepts
7
Equity Equity is the amount that would be left over if all assets
were sold at book value, and all liabilities were paid off. Equity includes invested capital and retained earnings. Retained earnings is
the sum of all the profits and losses from the time the business was
formed to the present, less dividends paid. Net income increases
retained earnings; losses reduce retained earnings.
Note that the income statement is a summary of revenue and expenses in a year. In contrast, a balance sheet is a snapshot at a point
in time.
Current Assets, Current Liabilities,
and Working Capital
Assets and liabilities are divided into current and noncurrent accounts. Current assets include cash and anything expected to be
converted to cash within a year. Examples include accounts receivable, inventory, and securities held for investment purposes.
Current liabilities are debts that will come due within a year.
Examples include accounts payable, accrued payroll, lines of credit,
and the principal portion of bank and lease payments that must be
paid within a year.
The reason for segregating assets and liabilities into current
and noncurrent accounts is to help determine whether a company
has the capacity to pay its bills. If more bills come due in a year
than a company can pay, serious consequences could follow, including bankruptcy.
We will see that most transactions in the course of normal
business affect current assets and current liabilities. Therefore,
these accounts are often called working capital accounts. Net working capital is current assets less current liabilities, as shown in
Eq. 1–3.
Net working capital ϭ Current assets Ϫ Current liabilities
(Eq. 1–3)
The amount of net working capital is a measure of whether a
company can pay its bills as they become due. If it is zero or negative, the company is in trouble. If the company has a lot of net
CHAPTER 1
8
working capital, it means they should have no trouble paying their
bills.
Gladstone’s net working capital can be computed as follows:
Net working capital ϭ $159,000 Ϫ $88,200 ϭ $70,800
One of the problems with using net working capital is that we
know zero or negative amounts are always bad, but we can’t tell
from this one calculation whether $70,800 is good. It might be terrific for a million-dollar bookstore, but dangerously close to zero
for a billion-dollar company. In the next chapter, we will discuss
ratios and other techniques to determine whether a company is at
risk.
Relationship Between Income Statement and
Balance Sheet
What is the relationship between the income statement and the balance sheet? Suppose Gladstone bought a book for $11 and sold it
for $20. This activity would cause a series of transactions to be generated in the accounting system. If the book were purchased on
credit, we would have to reflect the fact that Gladstone created a
liability. On the other hand, it also acquired an asset, the book,
which would become part of its inventory.
Accounting transactions are often represented by journal entries. A journal entry identifies the accounts that are affected by a
transaction and the amount of the effect. Transactions are debits,
which mean the left side, and credits, which mean the right side.
Think of the accounting equation (Eq. 1–2): assets are on the left,
or debit side of the equal sign, and liabilities and equity are on the
right side of the equal sign. So purchase of an $11 book on credit
can be represented by the following journal entry:
Debit
Inventory
Accounts payable
Credit
$11
$11
We have increased our assets, and we financed that increase
in assets by increasing a liability, accounts payable.