Assessing the effects of climate change on forest cover in dai tu district thai nguyen province
Bạn đang xem bản rút gọn của tài liệu. Xem và tải ngay bản đầy đủ của tài liệu tại đây (2.2 MB, 73 trang )
THAI NGUYEN UNIVERSITY
UNIVERSITY OF AGRICULTURE AND FORESTRY
KENNETH JOSHUA ZARATE KUA
TOPIC TITLE:
KENNETH JOSHUA Z. KUA
ASSESSING THE EFFECTS OF CLIMATE CHANGE ON FOREST
KENNETH JOSHUA Z. KUA
COVER IN DAI TU DISTRICT, THAI NGUYEN PROVINCE
KENNETH JOSHUA
Z. KUA
BACHELOR
THESIS
REMOTE SENSING GLOBAL VARIATIONS: EFFECTS OF
Study Mode:
CLIMATE
CHANGEFull-time
PARAMETERS ON FOREST COVER AND
Major:
Environmental
Science
and
Management
VEGETATION IN DAI TU DISTRICT,
THAI
NGUYEN
PROVINCE
Faculty:
Batch:
International Programs Office
K45 – AEP
Thai Nguyen,
20/11/2017
REMOTE SENSING GLOBAL
VARIATIONS:
EFFECTS OF
CLIMATE CHANGE PARAMETERS ON FOREST COVER AND
VEGETATION IN DAI TU DISTRICT, THAI NGUYEN PROVINCE
1
Thai Nguyen, 20/09/2017
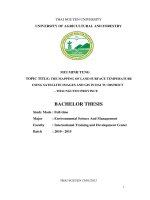
DOCUMENTATION PAGE WITH ABSTRACT
Thai Nguyen University of Agriculture and Forestry
Degree Program Bachelor of Environmental Science and Management
Student name
Kenneth Joshua Zarate Kua
Student ID
DTN1454290056
Assessing the Effects of Climate Change on Forest Cover in
Thesis Title
Dai Tu District, Thai Nguyen Province
Supervisor
Abstract:
Th.S. Nguyễn Văn Hiểu
List of Figures
1
Varying temperature and precipitation patterns and rising concentrations of
List of Tables (if necessary)
2
atmospheric carbon dioxide (CO₂) are unquestionably urging noticeable changes
List of Abbreviations
3
in natural and modified forests. Remote Sensing (RS) and Geographic Information
PART I. INTRODUCTION
4
System (GIS) approaches for monitoring forest cover is one of the most prominent
1.1. Research rationale 4
tool due to the increasing environmental problems that the Earth is facing. The aim
The unpredictable and changing environment
of this thesis is to assess the effects of climate change on forest cover in Dai Tu
awdawdawdawdawdawdawdawdawdawdawdawdawdawdawda
district, Thai Nguyen province. Landsat 5 TM images of 10th June 1993 and 10th
dddddddawdawdaawdadwawdawdawdawdawd been a serious
June 2004, and Landsat 8 OLI image of 6th June 2017 of Dai Tu district were
topic all around the world, drawing the interests of intellectual
utilized for supervised classification by using ArcGIS software. Cross-tabulation
humans to investigate its influence in different aspects
change matrices were established to assess the land-cover changes for the 1st period
(Ravindranath 2008, p. 1). The effects of climate change are
(1993 – 2004) and the 2nd period (2004 – 2017). The results from the land-cover
predominated by rising temperatures, varying precipitation
change analysis showed that, from the first period, the forest cover had decreased
patterns and sea level increase, these impacts are capable to
by 10.43% of the study area. While, the second period had decreased by 12.53% of
disturb different kinds of ecosystems and worst, damaging
natural resources (such as forests, fertile lands and minerals).
The inevitable losses of natural resources are most likely threat
to human survival. Scientific studies show proven prediction of
ii
the study area. These changes were a byproduct from the expanding agricultural
areas and some human interventions (such as urbanization and mining activities)
that resulted to deforestation. Moreover, regression analysis was performed to
investigate the relationships between the mean values of vegetation indices (NDVI
and FAPAR) and climate change parameters (SMI and LST) including the forest
cover data that were extracted from the land-cover classification. The result of the
analysis proves that, climate change parameters have significant relationships to
the changing forest cover (r² = < 0.80) of Dai Tu district.
Keywords:
climate change; forest cover; remote sensing; Landsat; landuse/land-cover
Number of pages: 56
Date of
20/11/17
Submission:
iii
ACKNOWLEDGEMENT
Firstly, I humbly acknowledging my God, "Jesus Christ", who is the “Son of God”
that I believe in. Without His constant provision of love and grace, I might not have had
the positive outlook to keep and press toward especially while working on with my thesis.
I am using this opportunity to consider everyone who supported me throughout my
life and academics. I may not include you all here, but I would like to say, “thank you very
much!”.
This piece of work couldn’t be possible without the help and support of some
dedicated and considerate people:
I'd like to show my sincere gratitude and appreciation to my thesis supervisor Dr.
Nguyễn Văn Hiểu for offering his research center for me to work on. Also for the immense
support and valuable recommendations.
I am acknowledging the Advanced Education Program (AEP) of Thai Nguyen
University of Agriculture and Forestry (TUAF) and staffs for building, teaching,
encouraging and inspiring me throughout my college life, which helped me to have a
brighter future.
Many thanks to my good friends (Anne, Katleen, Ekang, Tina, Carlo, Colleene, Jelo,
Real, Nicole, Anh Kiet, and Kuya Jose) for the positive vibes that helped me a lot
emotionally during the majority of my tiring days.
I greatly appreciate the members of GeoInformatic Research Center (GIRC) for the
cares and concerns, which made me feel comfortable and special while doing my research.
I am deeply fascinated to mention my beloved brothers and sisters in Jesus Christ
the Refiner’s Fire (JCRF) church and the Refiner’s Christian School (RCS). Thank you for
all, without you, I might not have achieved a higher purpose.
Words can’t express my deepest thankfulness to Mishel Rañada, for the unceasing
support and compliments that boost me to do my best. Many thanks, Mishel, for the
insights, which you have shared for the betterment of my thesis.
I am grateful beyond reasonable doubt and willingly dedicating this thesis to my
family (Mommy Vec, Daddy Bong, Kuya Kien, Kezia Baby, Ate April, Tita Cherry, Tita
Ester, Tito Eddie, Tito Edison, Tita Lau, Tita Leoni, Lola Paking) for the support not
merely financial but also in lots of different aspects.
The Researcher,
Kenneth Joshua Zarate Kua
iv
TABLE OF CONTENTS
List of Figures ...................................................................................................................... 1
List of Tables ....................................................................................................................... 2
List of Abbreviations ........................................................................................................... 3
PART I. INTRODUCTION ................................................................................................ 5
1.1.
Research Rationale ................................................................................................. 5
1.2. Research Objectives ............................................................................................... 8
1.2.1
Main Objective ....................................................................................... 8
1.2.1
Specific Objectives................................................................................. 8
1.3.
Research Questions and Hypothesis ...................................................................... 9
1.4.
Scope and Limitations .......................................................................................... 10
1.5.
Definition of Terms .............................................................................................. 11
PART II. LITERATURE REVIEW .................................................................................. 16
2.1.
Land-Use and Land-Cover (LULC) ..................................................................... 16
2.2.
Land-use research studies .................................................................................... 17
2.3.
Remote sensing and GIS techniques for LULC change ....................................... 18
2.4.
Forest vegetation monitoring using RS and GIS techniques ................................ 19
2.5.
Remote sensing climate change effects on forest vegetation ............................... 20
PART III. METHODOLOGY ........................................................................................... 23
3.1.
3.2.
Materials .............................................................................................................. 23
3.1.1
Time and place of research .................................................................. 23
3.1.2
Remotely sensed study area ................................................................. 23
3.1.3
Software used ....................................................................................... 23
3.1.4
Satellite data used ................................................................................. 23
Methods ................................................................................................................ 25
3.2.1
Satellite image pre-processing ............................................................. 25
3.2.2
Supervised classification ...................................................................... 26
3.2.3
Accuracy assessment ............................................................................ 26
3.2.4
Change rate analysis ............................................................................. 27
3.2.5
Vegetation indices and climate change parameters ............................. 27
3.2.6
Establishing relationship ...................................................................... 29
PART IV. RESULTS ........................................................................................................ 30
v
4.1.
Study area ............................................................................................................ 30
4.1.1. Geography ............................................................................................. 30
4.1.2. Topography ........................................................................................... 31
4.1.3. Hydrology ............................................................................................. 31
4.1.4. Climate and weather .............................................................................. 31
4.1.5. Socio-economic activities ..................................................................... 32
4.1.6. Population ............................................................................................. 32
4.2.
Land-cover analysis ............................................................................................. 33
4.2.1. Land-cover classes ................................................................................ 34
4.2.2. Land-cover maps ................................................................................... 34
4.3.
Land-cover area proportion ................................................................................. 35
4.4.
Accuracy Assessment results ............................................................................... 38
4.5.
Land-cover change analysis ................................................................................ 38
4.5.1. Land cover change cross-tabulation ...................................................... 38
4.5.2. Land-cover gain-loss ............................................................................. 40
4.6.
Visualization of vegetation indices and climate change parameters ................. 41
4.6.1. NDVI maps ........................................................................................... 41
4.6.2. FAPAR maps ........................................................................................ 42
4.6.3. SMI maps .............................................................................................. 43
4.6.4. LST maps .............................................................................................. 44
4.7.
Linear relationships ............................................................................................. 45
Part V. DISCUSSIONS AND CONCLUSIONS .............................................................. 47
Part VI. RECOMMENDATIONS ..................................................................................... 49
Part VII. REFERENCES ................................................................................................... 49
APPENDIX A.................................................................................................................... 57
APPENDIX B .................................................................................................................... 58
APPENDIX C .................................................................................................................... 59
APPENDIX D.................................................................................................................... 60
APPENDIX E .................................................................................................................... 61
APPENDIX E .................................................................................................................... 62
APPENDIX F .................................................................................................................... 63
APPENDIX G.................................................................................................................... 64
vi
LIST OF FIGURES
Figure 1: The overall methodological framework for assessing the effects of climate
change on forest cover ....................................................................................................... 25
Figure 2: Maps and locations for Dai Tu district, Thai Nguyen province, Vietnam ....... 30
Figure 3: Land-cover classification maps for years 1993; 2004; and 2017 ..................... 34
Figure 4: Illustrates the proportion of land-cover classes by area (km²) and percentage
(%), in year 1993 ............................................................................................................... 35
Figure 5: Illustrates the proportion of land-cover classes by area (km²) and percentage
(%), in year 2004 ............................................................................................................... 36
Figure 6: Illustrates the proportion of land-cover classes by area (km²) and percentage
(%), in year 2017 ............................................................................................................... 36
Figure 7: Comparison of land-cover proportion by percentage (%) years 1993; 2004; and
2017 ................................................................................................................................... 37
Figure 8: Land-cover gain – loss in km² for the 1st period (1993 – 2004) and 2nd period
(2004 – 2017)..................................................................................................................... 40
Figure 9: NDVI maps of Dai Tu district in years 1993; 2004; and 2017 ......................... 41
Figure 10: FAPAR maps of Dai Tu district in years 1993; 2004; and 2017 .................... 42
Figure 11: SMI maps of Dai Tu district in years 1993; 2004; and 2017.......................... 43
Figure 12: LST maps of Dai Tu district in years 1993; 2004; and 2017.......................... 44
Figure 13: Graphical relationship between (a) FC and SMI, (b) FC and LST, (c) NDVI
and SMI, (d) NDVI and LST, (e) FAPAR and SMI, (f) FAPAR and LST ...................... 46
1
LIST OF TABLES
Table 1. Details of the satellite data used in the study...................................................... 24
Table 2. Illustrates the characteristics of Landsat bands that were used for calculating
vegetation indices and climate change parameters ............................................................ 28
Table 3. Land-cover classes definitions and the criteria used to identify classes ............. 33
Table 4: Land-cover classes conversion in area (km²) from 1993 – 2004 period ............ 38
Table 5: Land-cover classes conversion in area (km²) from 2004 – 2017 period ............ 39
Table 6: Statistical relationship between vegetation indices and climate change
parameters in Dai Tu district in years 1993; 2004; and 2017 ........................................... 45
2
LIST OF ABBREVIATIONS
AEV
Area of Ephemeral Vegetation
AVHRR
Advanced Very High-Resolution Radiometer
CO₂
Carbon Dioxide
DEM
Digital Elevation Model
ETM
Enhanced Thematic Mapper
FAO
Forest and Agriculture Organization
FAPAR
Fraction of Absorbed Photosynthetically Active
Radiation
GCP
Ground Control Points
GIS
Geographic Information System
LST
Land Surface Temperature
LULC
Land-use and Land-Cover
MODIS
Moderate Resolution Imaging Spectrometer
NDVI
Normalized Difference Vegetation Index
NFI
National Forest Inventory
3
NOAA
National Oceanic and Atmospheric
Administration
REDD
Reducing Emissions from Deforestation and
forest Degradation
RS
Remote Sensing
SMI
Soil Moisture Index
SPOT
Système Pour l'Observation de la Terre
TM
Thematic Mapper
UK
United Kingdom
UNFCCC
United Nations Framework Convention on
Climate Change
USGS
United States Geological Survey
UTM
Universal Transverse Mercator
WGS
World Geodetic System
4
PART I. INTRODUCTION
1.1.
Research Rationale
The unpredictable and changing environment has been a serious topic all around the
world, drawing the interests of various scientists, citizens, and policymakers to investigate
its influence on different aspects (Ravindranath and Ostwald, 2008). Shako (2015)
reportedly demonstrated the climate change parameters, such as temperature, precipitation,
rainfall, soil moisture, vegetation cover, sea level, sunshine hours, atmospheric pressure,
wind velocity, etc. Slight changes in these parameters affect each other directly or
indirectly (Palmate et al., 2014). These effects are capable to disturb different kinds of
ecosystems and worst, damaging natural resources (e.g. forests, fertile lands, minerals,
etc.). The inevitable losses of natural resources are unquestionably a threat to human
survival. According to the United Nations Framework Convention on Climate Change
(UNFCCC, 2006), demonstrates proven prediction of some catastrophic events of climate
change, which are subsequent droughts and heavy rainfall conditions, decreased in the
terrestrial forest, loss of biodiversity, food and water scarcity that can result in increased
risk of hunger.
Forest occupies one-third of the Earth’s surface and serves as an essential resource
for Earth’s inhabitants. Furthermore, Forests give protection for the natural disasters (e.g.
floods, landslides, tsunamis, etc.), preserve the quality of the soil, provide habitats for
animals, increase the biodiversity, progress the economic growth (producing raw materials
such as woods and medicines), and functions globally as a prevention for climate change
5
by means of lessening global warming through carbon sequestration (Baumann et al., 2014;
Kim et al., 2014).
Unfortunately, according to Food and Agriculture Organization (FAO, 2012),
forests have been continuously and rapidly depleting worldwide. Recent studies claim that
forest depletion has been a serious issue regarding global variations. To prove that, recent
report from Chakravarty et al. (2012), demonstrates that world forest cover lost from 1990
to 2000 was approximately 0.20% and from 2000 to 2010 was approximately 0.13%. She
also outlines that North and South Africa were leading countries that had the highest rates
of deforestation from 1990 to 2010 with average approximately to 0.62% - 0.66%.
Moreover, FAO has shown that since 1990, the total amount of forest that had been lost
was equivalent to 129 million hectares, which are approximately the size of South Africa.
It is widely known that deforestation described as clearing out massive Earth’s
forests and potentially damages the quality of the land. Deforestation has a lot of negative
impacts on the environment and to the diverse ecosystems. It is the primary cause of soil
erosion that leads to loss of habitats for many species and sedimentation of water bodies
(Chakravarty et al., 2012).
For many years until now, degradation of the forest has been widespread due to
human interventions (intentional) and natural factors (unintentional) (FAO, 2012). Human
interventions to the forest comprise of expansion in agricultural area, urban development,
commercial logging, illicit cutting, grazing, construction of dams/reservoirs and barrages,
etc. (Torahi and Rai., 2011; Ghebrezgabher et al., 2014). On the other hand, natural factors
6
consist of climate change (e.g. forest fires, hurricanes, and droughts), pests and diseases,
etc. Furthermore, eliminating trees in the forest can damage the forest canopy structure,
which blocks the sun-rays and keeps the moisture of the soil. The decrease in forest canopy
can result to increase in heat that can be harmful to plants and animals and dry out the soil
moisture content, which leads to deficiency in available water in the soil. Consequently, it
will be hard for trees to uptake water, which can result to wilting. Former forests became
barren deserts because of this occurrence (Singh, 1989; Ghebrezgabher et al., 2014; Nyssen
et al., 2004).
Forest monitoring has increasingly become a vital factor in environmental planning.
FAO (2012) uses the term “National Forest Inventory” (NFI) as the collection of forest
analyzed data including field measurements and remote sensing data. It is also mentioned
as the thorough process of evaluating forest data for appropriate interpretation and
preparation. Countries that are members of Reducing Emissions from Deforestation and
forest Degradation (REDD+) program are responsible to report their forest data, which are
requirements for REDD+ reporting.
Change detection is defined as a process of identifying and monitoring the
differences in the state of an object or phenomenon by observing it at different times
(Singh, 1989). Remote Sensing (RS) and Geographic Information System (GIS) techniques
for monitoring forest cover are one of the most important tools due to the increasing
population growth and human interventions to the forests. Remote sensing research is
increasingly becoming widespread due to the environmental issues (e.g. climate, land and
7
forest change) that the Earth is facing. The remarkable features of remote sensing include
its fast ability to provide precise and useful data, broad range, capability to scope
inaccessible areas, repetitive monitoring of dynamic changes, quick data processing using
software, etc. (Singh, 1989; Ozdogan et al. 2010; Polidori, 2011).
Dai Tu district (located about 100 km north of Hanoi) is a mountainous area
covering 57,618 ha in the northwest of Thai Nguyen province. Together with the lack of
easily accessible and reliable data has shown the need for high-resolution remote sensing
analysis for the region. Therefore, the purpose of this paper is to extract and analyze the
forest cover of Dai Tu district over the past three decades and establish a linear regression
with vegetation indices and climate change parameters.
1.2.
Research Objectives
1.2.1. Main Objective
The primary objective of this study was to assess the effects of climate change on
forest cover in Dai Tu district, Thai Nguyen province by using remote sensing and GIS
techniques.
1.2.2. Specific Objectives
The specific objectives of this study correspond to:
1.
To Identify land-cover classes within Dai Tu district and their corresponding areas
(km²) and spatial distribution
8
2.
To prepare classified maps of Dai Tu district for years 1993, 2004, and 2017.
3.
To assess land-cover change during 1993 – 2004 (1st period) and 2004 – 2017
(2nd period).
4.
To prepare maps for vegetation indices (NDVI and FAPAR) and climate change
parameters (SMI and LST) in Dai Tu district for further investigation and visualization.
5.
To establish the relationship between forest cover, vegetation indices and climate
change parameters.
1.3.
Research Questions and Hypotheses
This thesis is designed to address the following questions:
1.
What are the land classes within Dai Tu district and their changes in areas (km²)
during 1993 – 2004 (1st period) and 2004 – 2017 (2nd period)?
2.
Does mining activities in Dai Tu district expanded?
3.
Does expansion in agricultural areas had caused deforestation?
4.
Is there a reduction or expansion of forest coverage in the study area within the
given times?
5.
Does GIS methods (integrated with this study) prove beyond reasonable doubt its
capabilities of spatial analysis of the forest cover change?
9
6.
Does remote sensing image manipulation applicable for locating, identifying and
quantifying forest cover change?
7.
Does climate change effect negatively on forest cover?
Alternative Hypothesis: Climate change parameters (independent variables) have
significant linear relationships between vegetation indices and forest cover data
(dependent variables). Therefore, r² is not equal to zero (r² ≠ 0).
Null Hypothesis: Climate change parameters (independent variables) don’t have
significant linear relationships between vegetation indices and forest cover data
(dependent variables). Therefore, r² is equal to zero (r² = 0).
1.4.
Scope and Limitations
The main limitation of this research is the actual validation of the remote sensing
data, field work is usually limited because of time, cost and difficulty in reaching some
places. This study only considered the use of remote sensing images and Google Earth
software for analyzing changes. This thesis also suffered from lack of clear clouds and haze
for satellite images in the interested area. In result, chosen years were limited due to some
unfavorable disturbances. Moreover, due to lack of fund to afford higher resolution images,
Landsat series freely provided by the United States Geological Survey (USGS) satellites
images had been used. This research clearly consists of certain limitations, nevertheless,
images without clouds and haze in the study area had been chosen to observe, which are
Landsat 5 TM images of 10th June 1993 and 10th June 2004, and Landsat 8 OLI image of
10
6th June 2017 of Dai Tu district. Landsat 5 and 8 provided by the USGS are high-resolution
images with 30m spatial resolution, which are suitable for this investigation. Furthermore,
this study only analyzed Soil Moisture Index (SMI) and Land Surface Temperature (LST)
for climate change parameters, because of lack or no available data for the study area.
1.5.
Definition of Terms
These following definitions were established for the purpose of clarification and further
understanding of the given terms of the study.
Land-cover is widely recognized as a remote sensing data, which can be examined of how
much area of land is covered by forests, wetlands, agriculture, impervious surfaces, water
bodies and other land types.
Land-use reflects how people use and interact with a certain land (e.g. development,
recreational, conservation, agricultural, etc.).
Forest-cover consists of vegetation or tree cover more than 5 m in height with more than
two species, and the canopy or crown ranges from 10% to 40% for open forest and above
40% for closed forest.
Change detection is defined as a process of identifying and monitoring the differences in
the state of an object or phenomenon by observing it at different times.
Satellite image pre-processing is referred as an image restoration and rectification, which
is intended to correct for the sensor and platform specific radiometric and geometric
distortions of data. Satellite image pre-processing examples are geometric correction,
11
radiometric correction, atmospheric correction, topographic normalization, etc.
Radiometric correction is an image pre-processing technique, which is necessary due to
variations in image illumination and viewing geometry, atmospheric conditions, and sensor
noise and response.
Supervised classification is a process of selecting sample pixels in an image that are
representative of specific classes and then apply the image processing software to use these
sample pixels as references for the classification of all other pixels in the image.
Maximum likelihood classifier is one of the most popular methods of classification in
remote sensing, in which a pixel with the maximum likelihood is classified into the
corresponding class.
Universal Transverse Mercator (UTM) is a conformal projection that uses a 2dimensional Cartesian coordinate system to give locations on the surface of the Earth.
WGS84 is an Earth-centered, Earth-fixed terrestrial reference system and geodetic datum.
It is also based on a consistent set of constants and model parameters that describe the
Earth's size, shape, and gravity and geomagnetic fields.
Climate change parameters are key factors in measuring climate change, such as
temperature, precipitation and biomass.
Accuracy assessment is known as an approach in image classification, which usually
examines the precision level between the classified image and the reference image (the
original image).
12
Confusion matrix or also known as error matrix is recognized as a tool for accuracy
assessment. A confusion matrix cross-tabulation can be described as a table that includes
a section of statistics prepared in rows and columns, which symbolizes the number of pixels
(that are assigned to the reference image to be analyzed and compared to the classified
image) that represent a particular type of class.
Producer’s accuracy is described as a percentage of correctness determined by looking
on the classified image and predicting if pixels for every classes are correctly placed from
the reference image.
User’s accuracy is described as a percentage of correctness determined by looking on the
classified image and predicting if pixels for every classes are positioned in the same area
as if using a map to identify a location.
Kappa Coefficient is described as a percentage of correctness between estimated model
and the real truth. For further comprehension, in case the pixel statistics contained in a
confusion matrix produce a result considerably much better than choosing a random pixel.
The Kappa Coefficient formulation is shown in the Appendix G, Equation 1.
Overall accuracy or also known as the average accuracy is the overall accuracy of every
class quantified through the percentage of every test sample for that class. Therefore, the
overall accuracy is usually greater than the value of Kappa coefficient.
NDVI or Normalized Difference Vegetation Index (NDVI) is spectral index that can be
examined by means of remote sensing methods and indicate perhaps the observed area
13
contains high quantity of vegetation or not. NDVI calculation is shown in the Appendix G,
Equation 2.
FAPAR or the Fraction of Absorbed Photosynthetically Active Radiation (FAPAR) is
widely-known as the fraction of the arriving solar radiation from the Photosynthetically
Active Radiation spectral region that can be consumed by a photosynthetic organism,
basically explaining the light consumption throughout an integrated vegetation canopy.
This kind of biophysical distinction is definitely associated with the primary productivity
of the natural photosynthesis and several models apply it to calculate the intake of carbon
dioxide of plants. FAPAR equation is demonstrated in Appendix G, Equation 3.
LST or the Land Surface Temperature (LST) is commonly the radiative complexion
temperature of the land surface, as calculated on the way to the remote sensor. LST can be
described as the combination of vegetation and bare soil temperatures. LST affects the
division of energy between soil and vegetation, and as well as determining the surface air
temperature. LST formulation is indicated in Appendix G, Equation 4.
SMI or the Soil Moisture Index (SMI) considers the water that can be found in the upper
10cm of soil. SMI is regarded as an indicator of drought and soil moisture content. The
function of SMI is founded on the scientific parameterization of the association of LST and
NDVI. The equation for SMI is presented in Appendix G, Equation 5.
Vegetation Index is a spectral transformation of two or more bands designed to enhance
the contribution of vegetation properties and allow reliable spatial and temporal inter-
14
comparisons of terrestrial photosynthetic activity and canopy structural variations. NDVI
and FAPAR are examples for vegetation index.
Linear relationship is a statistical term used to describe the relationship between a
variable and a constant. Linear relationships can be expressed in a graphical format where
the variable and the constant are connected via a straight line or in a mathematical format
where the independent variable is multiplied by the slope coefficient, added by a constant,
which determines the dependent variable.
15
PART II. LITERATURE REVIEW
2.1.
Land-Use and Land-Cover (LULC)
Land is one of the basic element and a primary resource to support human activities
(Young, 1998). Due to the increasing population of human and the progression of
technology, humans are labeled as the most powerful instrument when it comes to shaping
the environment. On a global scale, the majority of land-cover are influenced by human
activities (Frimpong, 2011).
The idea of “land-use” was first applied by British geographer named Stamp
(1948). Stamp explained that “land-use” is how humans interact to a particular land.
Therefore, the term land-use became known as a human activity or a land that reflects
human activities. For example, development, recreational, management, conservation,
agricultural and other activities. Furthermore, Stamp developed “Land Utilization Survey”.
It was performed in the 1930s with the concept of “a field-to-field analysis of the whole
nation, covering every acre and tracking its use”.
Later on, FAO (1998) identifies land-use as “preparations, activities, and inputs
humans perform in a certain land-cover type to create, change or maintain it”. Furthermore,
Lambin et al. (2006) define land-use as the manipulation of humans because of their
purpose to utilize a land. Thus, these claims molded the term “land-use” and established
an understanding of what describes “land-cover”. Land-cover is widely recognized as a
remote sensing data, which can be analyzed of how many parts of a land is covered by
forests, wetlands, agriculture, impervious surfaces, water bodies and other land types.
16
2.2.
Land-use research studies
Land-use study can be utilized for the purpose of examining “human interventions
to the terrestrial ecosystems”. Colonization of human being to different ecosystems (e.g.
forests, landscapes) in order to manipulate them can certainly be examined through
interpersonal and economic activities, which affect the ecosystems or by inspecting the
modifications to those ecosystems (Krausmann, 2001). Moreover, land-use studies
likewise employed for environmental science studies (Fischer-Kowalski and Haberl, 2007)
concerning the recognized environmental issues (climate change, deforestation, the
decrease of biodiversity, and so on).
Land-use change models are approaches to assist the investigation of the causes and
effects of land use transformations. Land-use models are capable to support land use
planning and policy. Various land use models are existing, formulated from distinctive
disciplinary backgrounds (Verburg et al., 2004).
O'Connell et al. (2007) study regarding the connection in agricultural land-use
management and flooding in the United Kingdom (UK). Because of the “run-off” problem
in the local agricultural systems of UK, they created a model approach, which used to
delineate back the downstream of run-off onto its sources.
Moreover, Tong and Chen (2002) examined the hydrological effects of land-use to
the watershed in Miami River Basin. They established the statistical and spatial approach
to examine the factors that affect the watershed. In result, statistical analysis had shown a
17
significant relationship between land-use and in-stream water quality, such as nitrogen,
phosphorus, and fecal coliform.
2.3.
Remote sensing and GIS techniques for LULC change
Past studies by way of assessing LULC change that includes excessive efforts
shown the needs for the support regarding the advancement of technologies especially
using satellite sensors, to assist the long-run investigation of LULC change. As outlined by
Miller et al (1998), remote sensing and GIS provide the most accurate methods to examine
and analyze different patterns of modifications in a land by having the scope to observe
these transformations in numerous and different times. Satellite data turned out to be the
primary tool to measure LULC change with the capabilities to observe them repetitively
within a short-intervals of time (Mas, 1999).
According to the case study of Hieu (2014) on “Land use changes assessment using
spatial data: a case study in Cong river basin - Thai Nguyen City - Viet Nam”, several
forest areas in Vietnam had changed for various purposes. For instance, urbanization (e.g
establishing new industrial parks, public areas, mining), agriculture activities and other
activities associated with socio-economic purposes.
Yang (2001) illustrates that the information about land-use change is necessary for
updating land cover maps and the supervision for natural resources. Based on the
summarization of the approaches on change information extracted from the remotely
sensed data, the study encourages the method of change detection based on remote sensing
18
information and model approach. He states that, the foundation for research on how the
change relations of natural and human activity have a connection on each other.
2.4.
Forest vegetation monitoring using RS and GIS techniques
Forests at a global scale are experiencing a different state of deforestation. Remote
sensing and GIS techniques have shown potential capabilities to monitor and detect forest
changes in a spatial and temporal scale (Coppin and Bauer, 1996). An additional
remarkable quality of RS data is that it provides a way of quickly discovering and
interpreting different forest types, a job that would end up being tedious and timeconsuming applying the traditional ground surveys (Canada Centre for Remote Sensing
Tutorials, 2008). Data are obtainable at different scales and settles to fulfill regional as well
as local preferences. Species detection can be carried out by way of multispectral,
hyperspectral, as well as air photo data interpretation. These imageries and the extracted
data can be integrated into a GIS to further examine the slopes, possession boundaries, and
so on.
Miwei (2009) examined short-lived vegetation located in Poyang Lake by using
Moderate Resolution Imaging Spectrometer (MODIS) satellite imagery. The analysis
examined the variation Area of Ephemeral Vegetation (AEV) by studying time compilation
of MODIS imagery and inspecting how these differences relate to variations in
hydrological conditions.
19