SHA541 printable
Bạn đang xem bản rút gọn của tài liệu. Xem và tải ngay bản đầy đủ của tài liệu tại đây (387.03 KB, 49 trang )
SHA541: Price and Inventory Controls
Copyright © 2012 eCornell. All rights reserved. All other copyrights, trademarks, trade names, and logos are the sole property of their respective owners.
1
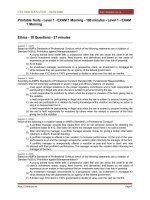
This course includes
• Nine self-check quizzes
• Two discussions
• Eleven tools to download and
use on the job
• One Ask the Expert interactive
• One video transcript file
Completing all of the coursework should take
about five to seven hours.
What you'll learn
Estimate the marginal value of
capacity
Evaluate the effects of price, length
of stay, demand, and availability
controls on revenue
Incorporate uncertainty into current
and future pricing decisions
Analyze the effects of multiple
resource controls- rate and length of
stay controls
Course Description
This course provides a rigorous foundation in traditional revenue management control of room and rate availability. You
will begin by exploring inventory control, focusing on controlling rate but not length of stay (LOS). You will then add
uncertain demand and discuss traditional availability controls (e.g., minimum LOS). Finally, you will explore optimization
and illustrate methods for full rate and availability control. This foundation is necessary if you want to develop your own
Copyright © 2012 eCornell. All rights reserved. All other copyrights, trademarks, trade names, and logos are the sole property of their respective owners.
2
revenue management systems or to engage effectively and fully with commercially available revenue management
systems.
Chris Anderson
Associate Professor, School of Hotel Administration, Cornell University
Chris Anderson is an associate professor at the Cornell School of Hotel Administration. Prior to his appointment in 2006, he
was on faculty at the Ivey School of Business in London, Ontario Canada. His main research focus is on revenue
management and service pricing. He actively works with industry, across numerous industry types, in the application and
development of RM, having worked with a variety of hotels, airlines, rental car and tour companies as well as numerous
consumer packaged goods and financial services firms. Anderson's research has been funded by numerous governmental
agencies and industrial partners and he serves on the editorial board of the Journal of Revenue and Pricing Management
and is the regional editor for the International Journal of Revenue Management . At the School of Hotel Administration, he
teaches courses in revenue management and service operations management.
Start Your Course
Copyright © 2012 eCornell. All rights reserved. All other copyrights, trademarks, trade names, and logos are the sole property of their respective owners.
3
Module Introduction: Single Resource Pricing and Control
Revenue management is used to sell the right unit to the right customer, at the right price, at the right time. In this module
you discover techniques to maximize revenue by controlling price or duration of stay. You examine revenue controls first
assuming your demand is certain and then assuming demand is uncertain. You then evaluate upgrading and upselling to
customers.
After completing this module, you will be able to:
Use fundamental approaches to demand control
Determine appropriate capacity or inventory levels when demand is uncertain
Maximize expected revenue when there are uncertain levels of demand
Calculate when upgrading contributes the most revenue
Copyright © 2012 eCornell. All rights reserved. All other copyrights, trademarks, trade names, and logos are the sole property of their respective owners.
4
Read: Parking Lot Dilemma
You can think of revenue management as analogous to parking your car on a very busy shopping day. In the U.S. a day
called "Black Friday" is one of the busiest shopping days of the year, and parking spaces can be hard to find. Imagine it's
Black Friday-you are driving through the parking lot and immediately see a parking spot. You may think, "Great, it's a spot,
I can park my car, get to the store, and buy my new Gucci bag." But then you might think, "Well, this parking spot is far
away from the store. I wonder if I can find a closer spot?" You face a dilemma: Should you park your car in the first spot
you find, or should you continue to drive and look for a spot closer to the store entrance?
You look down the rows and do not see any other parking spaces closer to the store. Now it's really a difficult decision. If
there are any closer spots, they are unknown to you. Should you take the first parking spot, or should you continue to look
for a closer spot? Chances are that if you drive down the lot and circle back to the first spot, the driver behind you will
have parked his or her car in that spot. In other words, if you don't take this spot, somebody else will, and it will be gone.
As a revenue manager, you make many decisions in settings similar to this one. From a revenue management
perspective, the question you would ask yourself is: "Should I accept the early discount request (take the first parking
spot), or should I wait for a later arriving, higher paying request (continue to look for a closer spot)?" If you leave the first
revenue opportunity, somebody else may take it. There may be a better revenue opportunity in the near future-or there
may not.
Copyright © 2012 eCornell. All rights reserved. All other copyrights, trademarks, trade names, and logos are the sole property of their respective owners.
5
Read: Review of Revenue Management
Key Points
"RevPAR" is revenue per available room
"RASM" (a similar measure) is revenue per available airline seat mile
Uses of Revenue Management
When we think about revenue management (RM), basically we're trying to maximize revenue per available time-based
inventory unit. We calculate variations on this all-inclusive measure differently in different contexts, and we use these
calculations in all applications of revenue management to analyze a business's ability to maximize its revenue capacity.
Necessary Conditions for Revenue Management
The revenue management process can be applied to any business that has a relatively fixed capacity, a perishable
inventory, and demand that varies over time.
Fixed capacity
In our parking lot dilemma, the number of parking spaces in the lot is fixed; when they are all filled with cars,
there is no more capacity. Consider a hotel that has sold all its rooms for a particular night. They cannot add any
more rooms instantly, and thus they cannot accept any more guests.
Perishable inventory
If the inventory is not used within a timeframe, then we lose a revenue opportunity. The hotel room that is not
sold on Wednesday, November 14, is a lost opportunity on November 15.
Time-variable demand
Demand varies by time of year, time of day, and by the length of customer stays or use. For example, a business
traveler commonly stays in a hotel for one or two nights during the week, rather than over the weekend. The time
used in midweek and the length of stay may be one to three days. Leisure travelers, on the other hand, generally
stay over the weekend and often for many consecutive days. The time they use includes a weekend and the
length of stay may be four to seven days.
Revenue Management Objectives
When we discuss RM for hotels we talk about RevPAR-revenue per available room. RevPAR is simply the average selling
price or average daily rate (ADR) times what fraction of our inventory is used (occupancy). Thus, if our average daily rate
is €100 and 15 of our 20 of rooms are occupied our RevPAR would be €75. Maximizing RevPAR is analogous to
maximizing revenue - sometimes at the expense of ADR as a firm may make more total revenue while selling to some
guests at lower values.
Another example is the equivalent RevPAR for an airline-RASM revenue per available seat mile. The airline can choose to
Copyright © 2012 eCornell. All rights reserved. All other copyrights, trademarks, trade names, and logos are the sole property of their respective owners.
6
fly a plane from and to different locations. Passengers may fly from Ithaca, New York to Philadelphia (about 200 miles) or
from Ithaca to Detroit (about 500 miles). Where they choose to fly influences the revenue per available seat mile.
Segmentable Market
To fully use RM, we must be able to segment our market and set prices according to different cutomer types. The
objective is to expand our market and increase our revenue potential in two ways. We want to charge higher prices to
market segments that do not respond to changes in price level. And we want to lower prices to market segments that will
respond to a price reduction by increasing their purchases enough to more than offset the revenue reduction occasioned
by the discount.
Strategic Levers of RM
Different combinations of duration, price, and reach can be used as strategic levers in the revenue management process.
Duration, how long someone uses your capacity, can be predictable or unpredictable. Using duration controls,
such as a minimum length of stay, a firm can maximize overall revenue over all time periods.
Variable pricing requires two basic considerations. One is the prices charged and the second is who pays which
price. With variable pricing people pay different prices, such as weekday rates or senior rates. This lever can be
used to control demand.
Reach is how a company sells to its customers. This can be property direct, through an online travel agent, or
via the call center. Reach is not just about how you perform the transaction, but how you create a stimulant and
create business. We may have 50 percent property direct, but much of it may have originated from an Internet
search followed by booking property direct.
All three of these strategic levers are linked to segmentation and in essence how well we utilize these levers dictates how
well we are segmenting our market (and increasing our revenue).
Copyright © 2012 eCornell. All rights reserved. All other copyrights, trademarks, trade names, and logos are the sole property of their respective owners.
7
Watch: Price and Duration Controls
Learn how variable pricing and capacity management can be used to enhance profitability.
Copyright © 2012 eCornell. All rights reserved. All other copyrights, trademarks, trade names, and logos are the sole property of their respective owners.
8
Tool: Demand Control for Rooms Review
Download the Tool
Completed Chart
On the previous page you developed a demand-control chart for using trigger points of 70% and 100%. In the attached
document are the occupancy percentages, minimum rates, and hot and cold periods we determined for the hotel. If you
had trouble with this quiz exercise on the previous page, please review the completed chart and try the quiz again.
Copyright © 2012 eCornell. All rights reserved. All other copyrights, trademarks, trade names, and logos are the sole property of their respective owners.
9
Read: Demand Controls in Other Business Areas
Key Points
Demand control can be useful in the absence of historic data
Demand controls can help you manage parts of your hotel beyond the rooms
Demand control is a relatively straightforward and simple form of inventory control. It was commonly used in the early
stages of inventory control (specifically by hotel and cruise lines), but most industries have moved beyond this form of
control. It is still useful in some situations, however. One example is firms that realize they have revenue opportunities,
particularly in non-room areas, but do not have sophisticated systems to evaluate them. Demand control is also useful
when the company does not have a large amount of historic data.
Demand control charts are relatively simple to construct. Tables 1 and 2 show sample charts for parts of a hotel not
normally actively managed for revenue. They display aggregate utilization of meeting space, first by day of week and
month, and then by monthly average. At the aggregate level, use of meeting space should be fairly easy to summarize for
any property, but as the first two tables show, it provides a wealth of information.
Days of Week
Month
Sun.
Mon.
Tues.
Wed.
Thurs.
Fri.
Sat.
Average by Month
January
0%
0%
0%
40%
25%
0%
100%
24%
February
25%
0%
0%
200%
0%
25%
75%
46%
March
0%
13%
0%
25%
40%
40%
40%
23%
April
30%
0%
25%
63%
25%
25%
50%
31%
May
0%
25%
20%
0%
0%
100%
50%
28%
June
0%
25%
25%
25%
50%
40%
100%
38%
July
40%
0%
25%
0%
0%
0%
60%
18%
August
25%
25%
40%
20%
0%
38%
100%
35%
Copyright © 2012 eCornell. All rights reserved. All other copyrights, trademarks, trade names, and logos are the sole property of their respective owners.
10
September
125%
75%
25%
100%
100%
40%
140%
86%
October
40%
20%
60%
0%
25%
100%
50%
42%
November
25%
25%
50%
40%
30%
100%
80%
50%
December
20%
25%
0%
25%
0%
80%
40%
27%
Average by Day
28%
19%
23%
45%
25%
49%
74%
37%
Atrium Ballroom
Occupancy Percentage
Table 1
Days of Week
Room
Sun.
Mon.
Tues.
Wed.
Thurs.
Fri.
Sat.
Average by Room
Atrium Ballroom
52%
38%
71%
48%
81%
89%
100%
68%
ECC
44%
63%
44%
39%
56%
56%
44%
49%
Plaza Meeting
28%
53%
72%
69%
83%
81%
61%
64%
67%
42%
42%
44%
62%
89%
85%
60%
Stamford Ballroom
100%
63%
56%
72%
100%
89%
100%
83%
Stamford Meeting
22%
23%
42%
41%
44%
43%
39%
36%
Raffles Ballroom
All Ballrooms
Occupancy Percentage
Table 2
Table 3 moves beyond utilization and includes revenue. Here the control chart summarizes revenue per available square
foot (a metric similar to RevPAR)-a combination of both revenue and utilization.
Copyright © 2012 eCornell. All rights reserved. All other copyrights, trademarks, trade names, and logos are the sole property of their respective owners.
11
Days of Week
Room
Sun.
Mon.
Tues.
Wed.
Thurs.
Fri.
Sat.
Average by Room
Atrium Ballroom
$0.36
$0.06
$0.24
$0.15
$0.34
$0.46
$0.66
$0.32
ECC
$0.36
$0.21
$0.25
$0.29
$0.30
$0.65
$0.42
$0.35
Plaza Meeting
$0.21
$0.32
$0.27
$0.22
$0.34
$0.38
$0.39
$0.30
$4.81
$1.90
$2.47
$4.17
$2.35
$5.59
$7.71
$4.14
Stamford Ballroom
$1.11
$0.49
$0.28
$0.48
$0.70
$0.79
$1.18
$0.72
Stamford Meeting
$0.21
$0.09
$0.16
$0.15
$0.17
$0.14
$0.18
$0.16
Raffles Ballroom
All Ballrooms
Revenue Per Available Sq. Ft.
Table 3
We can use all three of these tables in the same manner-separating periods into low, medium, and high performance (for
example, by utilization or occupancy, or by revenue per available square foot)-to indicate appropriate strategies to improve
revenues. Once a firm evaluates historic performance, it can take appropriate managerial efforts to improve revenue.
Specifically, during low-performing or cold periods, firms should try to increase volume through discounts, promotions, or
bundling with other services. Conversely, during high-performance or hot periods, firms need to focus on high-yielding
customers, restricting availability of discounts or ensuring that if customers want access to meeting space during peak
periods, they also occupy hotel rooms.
In general this technique can be summarized as:
Hot:
Increase volume at higher prices
Increase throughput of customers
Discontinue discounts
Cold:
Increase volume (at all prices)
Increase number of customers
Copyright © 2012 eCornell. All rights reserved. All other copyrights, trademarks, trade names, and logos are the sole property of their respective owners.
12
Read: The Newsperson Review
On the previous page you calculated the number of papers that Marie should stock to maximize her profitability. We know
that as long as the probability that Marie can sell a newspaper is greater than .60 that newspaper is going to cover its fixed
costs and actually make a profit.
If she stocks 0-3 papers she will be profitable but it will not maximize her profitability. If she stocks 5-10 papers the
probability of selling this number of papers is less than her break-even probability (.60). To maximize profit and minimize
loss she should stock 4 papers.
# Days
Demand
Relative Frequency Probability Probability
(Total days the demand
(Number of papers sold)
Probability Sales=x
Sales x
Sales > x
was sold)
Sum
0
4
0.04
0.04
.96
1
7
0.07
0.11
.89
2
9
0.09
0.2
.80
3
12
0.12
0.32
.68
4
13
0.13
0.45
.55
5
17
0.17
0.62
.38
6
13
0.13
0.75
.25
7
10
0.1
0.85
.15
8
7
0.07
0.92
.08
9
5
0.05
0.97
.03
10
3
0.03
1
.00
100
Copyright © 2012 eCornell. All rights reserved. All other copyrights, trademarks, trade names, and logos are the sole property of their respective owners.
13
Read: Expected Marginal Revenue
One principle of revenue management is that as the level of available capacity increases, the marginal expected revenue
from each additional unit of capacity declines. If we offer only one unit of capacity for sale, the probability of selling it is
very high and it is very unlikely that we will have to offer a discount to sell it. Thus, the expected revenue estimate for that
first unit is quite high. However, with each additional unit of capacity that we offer for sale, the probability that it will sell
goes down a little (and the pressure to discount it goes up). Eventually we are offering so much capacity that the
probability of selling the last additional unit is close to zero, even if we practically give it away.
We refer to revenue multiplied by the probability that we sell the unit (probability that demand is greater than or equal to
our supply) as that unit's expected marginal revenue (EMR). Figure 1 displays this decreasing expected marginal revenue,
which reflects the decreased chance of selling each additional unit. We can use the EMR estimate to determine how to
best utilize our capacity.
Revenue × Probability of selling = EMR
For example, we may sell our units of inventory (rooms, seats, rental cars, and so on) at two prices-an undiscounted rate
of €450 and a discounted rate of €275. Customers may make reservations at the discounted rate as long as it is available.
At some point, we decide to stop taking reservations at €275 and start selling at €450.
Figure 2 shows the EMR of our inventory priced at €450 (€450 times the probability that we sell all remaining units
Copyright © 2012 eCornell. All rights reserved. All other copyrights, trademarks, trade names, and logos are the sole property of their respective owners.
14
allocated at €450). When there are 25 units available the EMR of the 25 th unit is €275 (the EMR starts at €450 and slowly
decreases as we attempt to sell more units at €450). In other words the probability that demand is greater than or equal to
25 times €450 equals €275 or P [demand 25 ] * 450 = 275. When the EMR reaches €275, we are indifferent to selling
units at €450 or €275. If we have 100 units to sell, we should sell the first 75 at €275. When there are 25 left, we should
stop selling at €275 and start selling at €450. Later in the course we formalize the EMR concept and use it to control
inventory.
Copyright © 2012 eCornell. All rights reserved. All other copyrights, trademarks, trade names, and logos are the sole property of their respective owners.
15
Watch: Customer Segmentation and Demand Controls
Copyright © 2012 eCornell. All rights reserved. All other copyrights, trademarks, trade names, and logos are the sole property of their respective owners.
16
Watch: Class Protection
Copyright © 2012 eCornell. All rights reserved. All other copyrights, trademarks, trade names, and logos are the sole property of their respective owners.
17
Read: Welcome to Ideal Car Rental
Peter Carter is the owner and operator of an Ideal Car Rental franchise, part of a countrywide car-rental system. In the
four years since opening, the franchise has progressed nearly as far as could be hoped for, with annual revenues of
almost €750,000. Peter operates in three locations: Nice, Marseille, and St. Tropez.
Nice
This fleet consists of economy (24), midsize (14), and luxury (14) cars rented at a daily rate of €26, €28, and €32,
respectively. The customer pays no mileage charge. Peter knows that his customers are somewhat price-sensitive, and
keeps his prices competitive with the major chains.
The cost of leasing and insuring the fleet of cars is a major component of total costs. The costs of leasing the three sizes of
car are €260, €280, and €300 per month. Commercial insurance costs are €80, €86, and €90 per month. Few of the
operating costs vary directly with sales revenue. The only variable costs are those associated with cleaning and servicing
returned cars prior to their next rental. Peter estimates that the variable portion of his costs is close to €2/car/day rented,
and is about the same for each type of car. Virtually all other costs, including labor, are fixed, and can be considered
overhead. His monthly costs at the Nice location are summarized in this table.
Nice Location
Economy Midsize Luxury
Total # of cars
24
14
14
Lease cost
€256
€280
€300
Insurance
€80
€86
€90
Total
€336
€366
€390
-
-
-
Daily rental price
€26
€28
€32
Variable costs
€2
€2
€2
Net
€24
€26
€30
-
Peter feels that the potential for rapid expansion has now been exhausted, since he has captured a 25% market share
despite the presence of several competitors, including Hurts, Avits, and Nationete. Future growth in sales, he predicts, will
be in line with the economic and demographic growth of the area.
Peter has decided to devote his attention to improving his profitability rather than continuing to expand his marketing
efforts. He is concerned that his operation is not as profitable as it could be, in spite of his reliable staff and the fact that
operating costs are similar to those of other car rental agencies. Starting with the Nice location, Peter wants to
systematically evaluate his fleet to determine how many of each type of car he should carry, striking a reasonable balance
between utilization rates (directly related to contribution to fixed costs) and the possibility of running out of stock with the
subsequent loss of revenue. He has daily records of the numbers of each class of car rented. He hopes the information
will be useful.
Copyright © 2012 eCornell. All rights reserved. All other copyrights, trademarks, trade names, and logos are the sole property of their respective owners.
18
Watch: Ideal Car Rental-Types of Cars
Copyright © 2012 eCornell. All rights reserved. All other copyrights, trademarks, trade names, and logos are the sole property of their respective owners.
19
Tool: Ideal Car-Last Profitable Car
Download the Tool
Ideal Car spreadsheet
In the previous exercise you evaluate Ideal's midsize fleet to determine how many cars they should stock. If you had
difficulty with the exercise, please click the link on the right to download the Ideal Car spreadsheet and view how the
answers were calculated.
Copyright © 2012 eCornell. All rights reserved. All other copyrights, trademarks, trade names, and logos are the sole property of their respective owners.
20
Ask The Expert: Upgrading/Upselling Opportunities
Copyright © 2012 eCornell. All rights reserved. All other copyrights, trademarks, trade names, and logos are the sole property of their respective owners.
21
Tool: Ideal Car Rental-Upgrading
Download the Tool
Review Spreadsheet
In the last practice exercise you determined how many cars Peter should keep for "true" luxury customers. If you had
trouble with the exercise, please click the link on the right to download and review the spreadsheet with the completed
analysis and try the quiz again.
Copyright © 2012 eCornell. All rights reserved. All other copyrights, trademarks, trade names, and logos are the sole property of their respective owners.
22
Module Introduction: Multiple Resources Pricing and Control
Managers in hospitality and other industries often face decisions that are best made simultaneously rather than
sequentially. For example, hotel operators must decide on rate, length of stay, availability, and so on. In this module you
explore the value of simultaneous decision making for revenue management. You practice using the Excel tool, Solver, to
help automate the decision process.
After completing this module, you will be able to:
Identify the value of simultaneous decision making for revenue management
Build a model to optimize revenue
Determine the marginal value of a unit when constraints are relaxed
Optimize revenue using availability controls
Use the marginal value of rooms to determine rate and length-of-stay controls
Copyright © 2012 eCornell. All rights reserved. All other copyrights, trademarks, trade names, and logos are the sole property of their respective owners.
23
Watch: Simultaneous Decision Making
Optimization, or simultaneous decision making (SDM), is a modeling approach for settings where prior decisions affect the
outcomes of current decisions, and therefore decisions are best made simultaneously rather than sequentially. This
framework breaks the decision problem into three main pieces- objective, decision variables (what you need to decide), and
constraints (things that limit the decisions you make).
Copyright © 2012 eCornell. All rights reserved. All other copyrights, trademarks, trade names, and logos are the sole property of their respective owners.
24
Read: Meet Snap Électrique
For over a decade, Snap Électrique has been an industry leader in designing, developing, and manufacturing
computer-related electronics. They are presently considering manufacturing four new products-LCD touch screens,
integrated audio systems, voice and audio processors, and custom kiosks. They want you to help them evaluate these
prospects in terms of maximizing profit from the resources they currently have available.
The resources required to produce these products are electronic components, non-electronic components, and assembly
hours. The chart below shows the resources (supply on hand and cost per unit) and the amount needed to produce each
product. For example, Snap has a supply of 4700 electronic units, which cost €7/unit, 4500 non-electronic units which cost
€5/unit, and 2500 hours of available assembly time at a cost of €10/hour. Every 1 LCD touch screen they manufacture
uses 3 electronic components, 2 non-electronic units, and 1 hour of assembly at a total cost of €41. Using these resources
also reduces the amount available to manufacture other products.
Number of resources needed to make product
Resources
Electronic (unit)
Supply of
Cost of
LCD touch
Integrated audio
Voice & audio
Custom
resources
resources
screens
systems
processors
kiosks
4700
€7
3
4
4
3
4500
€5
2
2
4
3
2500
€10
1
1
3
2
Selling price
€70
€80
€150
€110
Cost per unit
€41
€48
€78
€56
€29
€32
€72
€54
Non-electronic
(unit)
Assembly (hour)
Contribution per
unit
If they were shortsighted decision-makers, to maximize profits they would use a sequential approach-they would simply
opt to make as many as possible of whatever produces the most revenue. Given that the voice and audio processors
(V&A processors) contribute the most revenue, they would maximize processor production by determining which resource
(electronic, non-electronic, or assembly) limits their production. To determine this, divide the total supply by the number of
units needed to produce the final product. The result is the number of that specific product that can be manufactured,
given the supply.
For example, Snap has 2500 hours of assembly available, and each V&A processor uses 3 hours. This limits production
to 833 processors (2500/3). But if they maximize production of V&A processors, Snap will use all of its available assembly
hours and have electronic (342 units) and non-electronic (292 units) components left in their supply.
Resources
Electronic (units)
Supply of resources
4,700
Number resources used to
Number needed for
manufacture 833 V&A
V&A processor
processors
4
Remaining resources
after production
3,332
1,368
(833*4)
(4,700-3,332)
Copyright © 2012 eCornell. All rights reserved. All other copyrights, trademarks, trade names, and logos are the sole property of their respective owners.
25