Use of landsat satellite image for mapping land cover change case study at yen bai commune ba vi district ha noi city
Bạn đang xem bản rút gọn của tài liệu. Xem và tải ngay bản đầy đủ của tài liệu tại đây (1.12 MB, 75 trang )
MINISTRY OF AGRICULTURE AND RURAL DEVELOPMENT
VIETNAM NATIONAL UNIVERSITY OF FORESTRY
--------------o0o----------------
STUDENT THESIS
USE OF LANDSAT SATELLITE IMAGE FOR MAPPING
LAND COVER CHANGE: CASE STUDY AT YEN BAI
COMMUNE, BA VI DISTRICT , HA NOI CITY
Major: Natural Resources Management
Code: D850101
Faculty: Forest Resource and Environmental Management
Student: Nguyen Thi Minh Huyen
Student ID: 1453092352
Class: K59B - Natural Resources Management
Course: 2014 - 2018
Advanced Education Program
Developed in collaboration with Colorado State University, USA
Supervisor: Assoc. Prof. Tran Quang Bao
Hanoi, 2018
1
ACKNOWLEDGEMENT
This thesis would not have been possible without the support and help from my
teachers, friends, families and several people. I would like to express my special appreciation
of following people who supported with my sincere gratitude:
I would like to express my sincere thanks and appreciation to my supervisor Assoc.Prof.
Tran Quang Bao for is untiring and excellent guidance, valuable suggestion in my dilemmas.
His comment and advices have helped me to finish my thesis
Further, I would like to thank the People’s Committee of Yen Bai for support and
giving me the chance to study in here. I also thank the local authorities and farmers in Yen
Bai Commune for providing valuable information and data of the area.
I wish to thank the Center of Laboratory and Practice of Vietnam Forestry University
for providing me with survey instrument (GPS Garmin) for field survey. I also thank my
friends for their enthusiastic help in the process collected data in field survey.
Last but not least, my everlasting gratitude goes to my parents who always encouraged
and supporting me all the time.
Ha Noi, 08, October 2018
2
TABLE OF CONTENTS
ACKNOWLEDGEMENT ..............................................................................................................................
TABLE OF CONTENTS ................................................................................................................................
ABBREVIATIONS ........................................................................................................................................
LIST OF TABLE ............................................................................................................................................
LIST OF FIGURE...........................................................................................................................................
ABSTRACTS.................................................................................................................................................
Chapter I ...................................................................................................................................................... 1
Introduction ................................................................................................................................................. 1
Chapter II .................................................................................................................................................... 3
LITERATURE REVIEW .......................................................................................................................... 3
2.1. Geographic Information system ..................................................................................................... 3
2.1.1. Definitions ................................................................................................................................... 3
2.1.2. Origins and evolutions of GIS ...................................................................................................... 3
2.1.3. Function of GIS ............................................................................................................................ 3
2.2. Remote sensing technology (RS) ..................................................................................................... 4
2.2.1. Definition .................................................................................................................................... 4
2.2.2. The basic principal of Remote sensing ........................................................................................ 4
2.2.3. Applications of Remote Sensing ................................................................................................. 5
2.3. Features and specifications of the Landsat image ......................................................................... 5
2.4. Studies of application of Remote sensing and GIS to detect land use and land cover ............. 10
2.4.1. In the world ............................................................................................................................... 10
2.4.2. In Viet Nam ............................................................................................................................... 11
Chapter III................................................................................................................................................. 12
GOAL, OBJECTIVES AND METHODLOGY ..................................................................................... 12
3.1. Goal and objectives ........................................................................................................................ 12
3.1.1. Goal ........................................................................................................................................... 12
3.1.2. Specific objectives ..................................................................................................................... 12
3.2. Methodology ................................................................................................................................... 12
3.2.1. Interview data ........................................................................................................................... 13
3.2.2. Reference materials................................................................................................................... 14
3
3.2.3. Integration multi-temporal Landsat data and GIS .................................................................... 14
CHAPTER IV............................................................................................................................................ 21
NATURAL CONDITION, THE RESOURCES, SOCIAL AND ECONOMIC CONDITIONS ....... 21
4.1. Natural condition ........................................................................................................................... 21
4.1.1. Geographic location .................................................................................................................. 21
4.1.2. Topography, geomorphology.................................................................................................... 22
4.1.3. Climate and weather ................................................................................................................. 22
4.1.4. Hydrology .................................................................................................................................. 23
4.2. The resources.................................................................................................................................. 23
4.2.1. Land resources .............................................................................................................................. 23
4.2.2. Forest resources............................................................................................................................ 24
4.3. Social and economic conditions .................................................................................................... 24
4.3.1. Ethnic composition and population distribution ...................................................................... 24
4.3.2. Health and education ................................................................................................................ 24
4.3.3. Traffic ........................................................................................................................................ 25
4.4. The situation of production development of Yen Bai Commune .............................................. 25
4.4.1. Manufacturing industry, handicraft .......................................................................................... 27
4.4.2. Services – Trade ........................................................................................................................ 27
CHAPTER 5 .............................................................................................................................................. 28
RESULT AND DISSCUSSION ............................................................................................................... 28
5.1. Current status and management of land use in Yen Bai Commune, Ba Vi District ................ 28
5.1.1. Status of land use in Yen Bai commune, Ba Vi District ............................................................. 28
5.1.2. Land use management .............................................................................................................. 29
5.2. Construct thematic maps over time and evaluate the accuracy of maps. ................................. 31
5.2.1. Thematic map for the period of 2004 – 2017 ........................................................................... 31
5.2.2. Evaluate the accuracy of the map............................................................................................. 34
5.3. Changes in land use area, causes and factors affecting the management of land use in Yen
Bai commune, Ba Vi district, Hanoi. ................................................................................................... 37
5.4. The driven force effect to change activity using the land in Yen Bai Commune ..................... 41
5.5. Solutions to improve the management effectiveness of land use in the study area .................. 43
CHAPTER 6 .............................................................................................................................................. 45
CONCLUSION, LIMITATIONS AND RECOMMENDATIONS....................................................... 45
4
6.1. Conclusion ...................................................................................................................................... 45
6.2. Limitations ...................................................................................................................................... 46
6.3. Recommendation............................................................................................................................ 46
REFERENCES ..............................................................................................................................................
APPENDICES ...............................................................................................................................................
5
ABBREVIATIONS
ETM +: Enhanced Thematic Mapper Plus
IR: Infrared
GIS: Geographic Information System
LULC: Landuse/landcover
MSS: Multi-Spectral Scanner
NIR: Near Infrared
SWIR: Shortwave Infrared
TM: Thematic Mapper
6
LIST OF TABLE
Table 2.1. ETM + sensor characteristic parameters………………………………………… 7
Table 2.2. Table of the main application of Landsat…………………………………………. 8
Table
2.3.
OLI,
TIRS
sensors
characteristic
parameters
of
Landsat
8………………………….9
Table 3.1. Satellite images used for the study……………………………………………... 16
Table 3.2. Ground control points (GCPs) and land cover classes……………………………16
Table 3.3. Description of land cover classification…………………………………………. 18
Table 5.1. The area of land use types in Yen Bai Commune in 2015……………………… 29
Table 5.2. Assess the accuracy of land cover change mapping in 2017…………………….. 34
Table 5.3. Assess the accuracy of land cover change mapping in 2013…………………….. 34
Table 5.4. Assess the accuracy of land cover change mapping in 2010……………………..34
Table 5.5. Assess the accuracy of land cover change mapping in 2007…………………….. 35
Table 5.6. Assess the accuracy of land cover change mapping in 2004…………………….. 35
Table 5.7. The area of cover in Yen Bai Commune from 2004 to 2017…………………... 36
Table 5.8. The change of land cover in period of 2004 – 2017…..…………………………..46
7
LIST OF FIGURE
Figure 3.1. Overview flowchart of study objects .......................................................................... 13
Figure 3.2 Flowchart of methodology for image classification and change mapping .................. 15
Figure 3.3. The distribution of sample points in the study area…..………………………….19
Figure 4..1. Location of study site ................................................................................................ 21
Figure 5.1. The main land use in Yen Bai Commune in 2015......Error! Bookmark not defined.
Figure 5.2. Map of land cover in Yen Bai Commune from 2004 to 2017Error! Bookmark not defined.
Figure 5.3. The area of land cover type in Yen Bai Commune from 2004 - 2017 ....................... 36
Figure 5.4. Map of land used changed in period 2004 – 2017………………………..……...38
Figure 5.5. Map of land cover change between period ................................................................ 39
Figure 5.6. The reason cause the land use change ....................................................................... .40
8
ABSTRACTS
The aim of this thesis was to monitor land cover change in period of time from 2005 to
2017 in Yen Bai Commune, Ba Vi District. Beside that, investigating the current land use and
management, identifying the key drivers of land cover change and proposing better solution
for land management in this study site are the specific object. This thesis was applied GIS to
deal with the data from the current map 2004 - 2017 with focus on 3 types: forest, agricultural
land and other land (residential, bareland, water, etc). In order to construct the map of
landuse/landcover change, the landsat images from 2004 – 2017 is downloaded. In this thesis
the Iso cluster unsupervised classification to identify the land cover change is used by using
the Images Classification tool in ArcGis on is a method of identifying, grouping, and labeling
features in an imagine according to their spectral values. The statistic indicates that from
2005 to 2017, the area of forest decreased by 451.17 ha. The agricultural also decreased but
slightly, only 69.39 ha. In the contrast, the other land increased by 520.66 ha. The reasons for
the change in land use types are mostly by urbanization, population growth, different purpose
of land use, etc. In Yen Bai, there has some problem such as deforestation for personal aim,
awareness of people, loose in management, etc that cause bad affect. Some suggestions
should be proposed to solve this problem.
Keywords: GIS, landuse/land cover change, unsupervised classification, remote sensing.
9
Chapter I
Introduction
Landuse/landcover (LULC) changes plays a major role in study of global change.
Landuse/land cover and human/ natural modifications have largely resulted in deforestation,
biodiversity loss, global warming and increase of natural disaster – flooding (Dwivedi et al,
2004). These environmental problems are often related to LULC changes. Therefore,
available data on LULC changes can provide critical input to decision – making of
environmental management and planning the future (Prenzel, 2004).
The growing population and increasing socio-economic necessities creates a pressure
on landuse/landcover. This pressure result in unplanted and uncontrolled changes in LULC
(Seto, 2002). The LULC alterations are generally caused by mismanagement of agricultural,
urban, range and forest lands which lead to severe environmental problems such as
landslides, floods etc.
Remote sensing and GIS are powerful tools to derive accurate and timely information
on the spatial distribution of landuse/landcover changes over large area (Rogana, 2004). GIS
provides a flexible environment for collecting, storing, displaying and analyzing digital data
necessary for change detection (Demers, 2005). Remote sensing imagery is the most
important data sources of GIS. Satellite imagery is used for recognition of synoptic data of
Earth’s surface (Ulbricht, 1998). Landsat Multispectral Scanner (MSS), Thematic Mapper
(TM), and Enhanced Thematic Mapper Plus (ETM+) data have been broadly employed in
studies towards the determination of land cover since 1972, the staring year of Landsat
program, mainly in forest and agriculture areas (Campell, 2007).
Yen Bai Commune is a mountainous commune, in the southeast of Ba Vi District
Interacting between hills and slopes and ladders. This terrain is favorable for growing fruit
1
trees and perennial trees. In the past years, the commune has gradually changed the
agricultural structure in the direction of commodity production, the land use purpose of
people in the commune has also changed.
With the requirement to update information quickly and accurately on the dynamics of
land use types, the use of remote sensing data in combination with GIS technology for image
processing and mapping has become a method of practical significance and high scientific.
Based on that practice, I have implemented the topic " Use of Landsat 8 Satellite Image for
mapping land cover change: Case study at Yen Bai Commune, Ba Vi District , Ha Noi
City” to use remote sensing technology in the establishment of land use change map to serve
the local land use management research.
2
Chapter II
LITERATURE REVIEW
2.1. Geographic Information system
2.1.1. Definitions
According to Burrough (1986), GIS is a powerful tool box, used to store and receive
arbitrary, change and display spatial data form the real world for the special target.
According to the Environment System Institute (ESRI), “a geographic information
system (GIS) integrates hardware, software, and data for capturing, managing, analyzing, and
displaying all forms of geographically referenced information.” (ESRI, 2009)
2.1.2. Origins and evolutions of GIS
GIS is exploited in the 1960s form a mapping initiative work. Canadian forest
management, GIS continues to be developed through the research of the researchers at the
university and the government of Canada, the US and other countries aimed to introduce the
geography of the Earth using a System computer database, display it on the terminal of the
computer and mapping out the paper. GIS market expanded strongly in the early 1980s
thanks to the trade journals, conferences and professional collaboration to proclaim to the
world about the benefits of GIS. Today, there are hundreds of websites posted online GIS
data on the World Wide Web. Anyone can use the web browser can access and view GIS
data.
2.1.3. Function of GIS
“GIS has 4 main functions: data entry, manages, analyze and display geographic data
management” (Nguyen Kim Loi, 2007).
Data entry is the process of creating a database to GIS, is the data encryption
process form data can be read and stored in the computer.
3
Data management: for attribute data managed by the relational model, data
managing spatial data in vector and raster model.
Data analysis: GIS can analyze data combined spatial and attribute at the same time,
the group is composed of 4 main functions: maintaining and analyzing spatial data,
only maintenance and analysis of data attributes, meta-analysis of spatial data and
attributes, export formats.
Display of data: GIS can allow the data stored and displayed complete information
separately, at different rates; the level of detail of information is only limited by the
storage capacity of the hardware and software methods that used to display.
2.2. Remote sensing technology (RS)
2.2.1. Definition
“Remote sensing is the art, science, talking less about an object without having to touch
the object.” (Ficher, 1976)
“Remote sensing is the science of extracting information from an object, measured from
a distance away from the object does not need to come into contact with it. Energy is
measured in the current generation of remote sensing electromagnetic energy emitted from
the object of interest…” (DA Land Grete, 1978).
2.2.2. The basic principal of Remote sensing
Remote sensing study objects by interpreting and separating information from air data
snapshot, or by satellite image interpretation numeric. The data below format photographs
and digital imagines are obtained based on the recognition of radiation energy (photo frames
and imagine) and wave feedback (photo radar) emitted from objects when surveying. Energy
in the form of electromagnetic spectrum, situated on different spectrum bands, and for
information about an object from multiple angles will help decipher objects for more
accurately.
4
2.2.3. Applications of Remote Sensing
Currently, remote sensing has been widely applied in many fields, many areas below is
different and introduces the main application:
Climate and atmospheric gas studies (characterized ozone, clouds, rain, temperature,
and atmospheric gas). Hurricane and climate research through data collection
meteorological satellite.
Research plants, forest Imagine Sensing provides research covers global
government botanists by day, season, year, month and phased. Plant is the first
object that satellite remote sensing imagine information required. On remote sensing
we can calculate biomass, maturity and index-based pest plants, forest fires can
study through satellite imagine.
Hydrological study: water surface and the flow system is shown very clearly on
satellite images and possible freezing of them. Satellite image data, is recorded
during floods, the data used to calculate the disaster area and the ability to forecast
floods.
Research others planets: the data obtained from satellite remote sensing allowed
study the stars and the moon. This confirms that remote sensing is a technology has
immense applications beyond Earth.
2.3. Features and specifications of the Landsat image
The Landsat program consists of a series of optical/infrared remote sensing satellite for
land observation. The program was first started by The National Aeronautics and Space
Administration (NASA) in 1970.
The first satellite in the series, LANDSAT – 1 was
launched in 1972. The satellite had a designed life expectancy of 1 year but it ceased
operation only on January 1978. LANDSAT-2 was launched on 22 January 1975 and three
additional LANDSAT satellite were launched in 1978, 1982 and 1984 (LANDSAT – 3, 4, 5).
5
LANDSAT – 6 was launched on 1993 but the satellite failed to obtain orbit. A new satellite
LANDSAT - 7 was launched in 1999. The LANDSAT- 8 satellite was successfully launched
into orbit on February 12, 2013, with the task of tracking the evolution of forests and
ecosystems on Earth.
In Landsat images, there have 3 sensors:
MSS (Multi-Spectral Scanner), on LANDSAT – 1 to 5. The resolution of the MSS
sensor was approximately 80m with radiometric coverage in four spectral bands
from visible green to the near-infrared (IR) wave lengths. Only the MSS sensor on
LANDSAT – 3 had fifth in the thermal – IR.
TM (Thematic Mapper), first operational on LANDSAT – 4. TM sensors primarily
detect reflected radiation from the Earth surface in the visible and near – infrared
(IR) wavelengths, but the TM sensors provides more radiometric information than
the MSS sensor. The wavelength range for the TM sensor is from the visible (blue),
through the mid – IR, into the thermal – IR portion of the electromagnetic spectrum.
The TM sensor has a spatial resolution of 30m for the visible, near – IR, and mid –
IR wavelengths and a spatial resolution of 120m for the thermal – IR band.
ETM + (Enhanced Thematic Mapper Plus), is carried on board LANDSAT 7. The
ETM + instrument is an eight – band multispectral scanning radiometer capable of
providing high – resolution imagine information of the Earth’s surface. Its spectral
bands are similar to those of TM, except that the thermal band (band 6) has an
improved resolution of 60m (versus 120 in TM). There is also an additional
panchromatic band at 15m resolution.
6
Table 2.1. ETM + sensor characteristic parameters
Color spectrum
Band
Wavelength (µm)
Resolution (m)
Blue
1
0.45 - 0.52
30
Green
2
0.52 – 0.60
30
Red
3
0.63 – 0.69
30
Near Infrared (NIR)
4
0.76 – 0.90
30
Shortwave Infrared (SWIR) 1
5
1.55 – 1.75
30
Thermal IR
6
10.4 – 12.5
60
Shortwave Infrared (SWIR) 2
7
2.08 – 2.35
30
Panchromatic
8
0.52 – 0.9
15
(landsat.usgs.gov)
Landsat image is applied in many fields, from monitoring of forest changes to the
establishment of maps of forest status, current land use. Landsat satellites have seven
different color bands, each representing a different part of the electromagnetic spectrum, and
the parameters are as follows.
7
Table 2.2. Table of the main application of Landsat
Spectrum
Application
Blue – Band 1
Applied research shoreline, distinguishing plants and soil, forest mapping
(0.45 – 0.52µm)
and identification of other objects
Green – Band 2
Used to measure the peak reflectance spectrum of plant continent, identify
(0.52 – 0.60µm)
vegetative state, identifying other objects.
Red – Band 3
Used to define zones help absorb chlorophyll botanical classification,
(0.63 – 0.69µm)
identifying other objects.
Near Infrared
Used to define plant types, status and biomass, soil moisture.
(0.76 – 0.90µm)
Short-wave
Used to determine the moisture content of vegetation and soil, the study
infrared
of mineral rock, snow and clouds separated.
(1.55 – 1.75µm)
Thermal infrared
Used to determine when plant is shocked, soil moisture and temperature
(10.4 – 12.5µm)
mapping.
Panchromatic
With lower resolution and spectral continuity, this channel’s image is
channel
used to overlay with other photo channels, thereby measuring the exact
(2.08 – 2.35µm)
drawing objects.
(Climategis.com)
The Landsat 8 carries two sensors: Operational Land Imager (OLI) and Thermal
Infrared Sensor (TIRS). These sensors are designed to improve efficiency and reliability over
previous generation Landsat sensors. Landsat 8 captures images with a total of 11 spectral
channels, including 9 shortwave and 2 longwave channels.
8
Table 2.3. OLI, TIRS sensors characteristic parameters of Landsat 8
Band
Wavelength (µm)
Resolution
Band 1 – Ultra Blue (coastal/aerosol)
0.435 – 0.451
30
Band 2 – Blue
0.452 – 0.512
30
Band 3 – Green
0.533 – 0.590
30
Band 4 – Red
0.636 – 0.673
30
Operational
Band 5 – Near Infrared (NIR)
0.851 – 0.879
30
Land Imager
Band 6 – Shortwave Infrared (SWIR)
1.566 – 1.615
30
2.107 – 2.294
30
Band 8 – Panchromatic
0.503 – 0.676
15
Band 9 – Cirrus
1.363 – 1.384
30
Band 10 – Thermal Infrared (TIRS) 1
10.60 – 11.19
100
Band 11 – Thermal Infrared (TIRS) 2
11.50 – 12.51
100
LANDSAT 8
(OLI) and
1
Thermal Infrared Band 7 – Shortwave Infrared (SWIR)
Sensor (TIRS)
2
(landsat.usgs.gov)
Color bands can be combined to help visualize color data. There are many ways to
combine color bands and each has its own pros and cons.
The Landsat satellite images have good spectral resolution, which is suitable for digital
image processing, allowing for a wide range of imaging products that are not available in the
same method. Landsat digital images are released in both digital and video formats with
varying levels of processing and geometry to make it easy to use.
9
2.4. Studies of application of Remote sensing and GIS to detect land use and land cover
In recent years, we have facing with growing population and climate change and the
issue about the environment and natural resources are paid to great concern worldwide.
Moreover, with strong development of modern technology, it is recognized the significant
role of LULC in management of natural resources and environment. Therefore, leading to
more and more number of studies of LULC were carried out by researchers, scientist,
managers; especially in current changing climate.
2.4.1. In the world
There are many researches in GIS and remote sensing in land use management in the
world:
The study of predicting of land area change and cover in Patna district, Bihar, India by
Varun Narayan Mishara and Praveen Kumar Rai. The subject uses a Landsat image with the
method of unsupervised the image to classify the object.
Study Report: "Mapping and Analysis of Land Use Changes by Remote Sensing and
GIS: Case Study of the Simly Basin, Islamabad, Pakistan" by Amna Butt; Rabia Shabbir;
Sheikh Saeed Ahmad and Neelam Aziz. This study employs the highest supervised
classification algorithm in ERDAS to visualize the change in land cover / use observed in the
Simly river basin in Pakistan using multi-satellite data from Landsat 5 and SPOT 5 for the
year 1992 and 2012. The river basin is divided into 5 main uses / layers as follows:
Agriculture, bareland /soil, Settlement, Plants and water. Land cover / land use maps and land
use maps were created using the ArcGis 10 software with an auditable classification.
Research on "Use of Remote Sensing to Evaluate Land Use / Coverage Changes and Its
Impact on Wind Erosion in Southern Iran" by Mahrooz Rezaei; Corresponding author;
10
Abdolmajid Sameni and Seyed Rashid, Fallah Shamsi and Harm Bartholomeus, published in
PeerJ magazine in 2016. Research using Landsat ETM and Landsat 8 images.
2.4.2. In Viet Nam
In Vietnam, there are many studies and researches using RS and GIS to monitor LULC,
construct map; and detect the forest cover change, which support considerably to
management of natural resources and environment.
Application of multi-temporal Landsat and GIS in assessing of coastal mangroves in
Tien Yen district, Quang Ninh province in the period of 1994 - 2015 by Dr. Nguyen Hai Hoa.
Landsat image data with image classification method by the method of unsupervised
classification.
"Remote sensing application and GIS application for analyzing and evaluating the
current status of urban land use in District 2, Ho Chi Minh City" by Tran Thi Hai Ha. The
data used is the SPOT satellite image. With SPOT images, the resolution of this image is very
high at 5x5m, 6 times higher than Landsat image and double with Sentinel image. However,
SPOT images must be paid. Topic used a variety of software to classify such as ENVI,
Mapinfo 7.5, Arcview GIS 3.5.
The topic "Research on remote sensing and application of GIS technology in mapping
the current state of natural resources in service of environmental protection planning at
provincial level". Nguyen Quoc Khanh. SPOT satellite images are considered to be the main
document in the study on the mapping of natural resources for provincial environmental
protection planning of this topic. With the method of using NDVI and the method of
supervised classification.
11
Chapter III
GOAL, OBJECTIVES AND METHODLOGY
3.1. Goal and objectives
3.1.1. Goal
The primary aim of this study is to monitor land cover change in Yen Bai Commune
during the period of research by using multi – temporal Landsat imagery data. The findings
of study will contribute better management solution for staffs of Yen Bai Commune, Ba Vi
Province.
3.1.2. Specific objectives
Objective 1: Investigate the status current of land cover and its management schemes in
Yen Bai Commune.
Objective 2: To quantify land cover changes in Yen Bai Commune during period of
research using multi-temporal Landsat data. This objective includes 2 sub – objectives stated
as below:
Constructing individual map of land cover in Yen Bai Commune in selected years.
Constructing the land cover changed map in Yen Bai Commune in selected
periods.
Objective 3: To identify key drivers of land cover changes over the period of research
in Yen Bai Commune.
Objective 4: To propose solution for better management of land use in Yen Bai
Commune.
3.2. Methodology
This part describe the method and material that were used and applied in the study,
including data collection , data processing, data analysis with a view to achieve the set
12
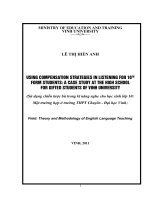
objects. First of all, flowchart will provide an overview about method proportion of each
object:
Data collection
•
Reference materials
•
Interview data
Investigation the status current of land use
land cover and its management schemes in
Yen Bai Commune
Quantify land cover change in Yen Bai
Integration
Commune during the period of research
Multi-temporal Landsat imagery
Geographical system
positioning system (GIS)
Identify key drivers of land cover change
over the period of research in Yen Bai
Commune
Reference materials
Knowledge
Propose solutions for better management of
land use in Yen Bai Commune
Figure 3.1. Overview flowchart of study objects
3.2.1. Interview data
Interview data was collected from interviews which are considered as a good way to get
information directly from people live in there. Due to understand clearly about study site, so
collecting from there is very true and useful for research. From interview, we can know the
13
status current land cover, schemes or regimes or regimes of management, as well as driving
factor of land cover change. The interviews local people were carried out with 20 people
belong to Yen Bai Commune and chosen randomly during the processing of field work. In
addition, staff of board management and local authorities of commune also is one of object
interview. Interview staffs of management board to get information about the current land use
land cover of the areas, as well as policy and regimes management, which are implemented in
Yen Bai Commune.
3.2.2. Reference materials
Reference materials are another to get more information about the study site, besides
interview data. The study used some information from peer-reviewed articles, reports, news,
newspapers, official document about Yen Bai Commune. These findings can provide more
information for investigate status of land cover, the management schemes of Yen Bai
Commune in current, as well as reasons of change in land cover in last time.
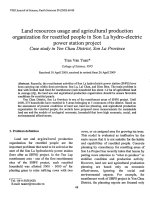
3.2.3. Integration multi-temporal Landsat data and GIS
An integration of multi-temporal remote data and GIS provides a useful method to
quantify land cover change in Yen Bai Commune from 2004- 2017. To have an overview of
land cover change in Yen Bai Commune during 13 years, the study firstly constructed of land
covers in Yen Bai Commune each year of 2004, 2008, 2010, 2013 and 2017 then monitoring
land cover change in Yen Bai Commune in selected periods, namely 2004-2008, 2008-2010,
2010-2013, 2013-2017 Dividing certain period of land cover is a good way to detection more
clearly about land cover change in given period and how they changes.
14
Materials
GPS field
survey
Landsat images
GIS data, statistic
Pre-processing
Composite
bands
Band
Clip study
area of
interest
combinations
Imagine Classification
Unsupervised classification
Accuracy assessment
Post classification
Construct maps in 2004, 2008, 2010,
2013, 2017
Change detection
Land cover
change
2004–2008
Land cover
change
2008-2010
Land cover
change
2010-2013
Land cover
change
2013-2017
Land cover
change
2004-2017
Figure 3.2. Flowchart of methodology for image classification and change mapping
3.2.3.1. Landsat images
15
To construct a current and use map and to evaluate land use change in the study area,
the Landsat remote sensing image series has been used from 2004 to 2017. Download the
satellite image of the study area during the assessment period of the fluctuation.
Table 3.1. Satellite images used for the study
Codes
Satellite instrument
Date of
Resolution
acquired
(m)
Path/Row
Cloud
(%)
1
LT51270452004102BKT00
22/10/2004
30x30
127/45
12.00
2
LT51270452007291BKT00
17/10/2007
30x30
127/45
17.00
3
LT51270452010312BKT00
08/11/2010
30x30
127/45
00.00
4
LC81270452013352LGN00
18/12/2013
30x30
127/45
2.17
5
LC812704520173615LGN00 06/04/2017
30x30
127/45
3.0
3.2.3.2. Field survey
Field survey were conducted in July, 2018 to collect ground control points and using the
hand – held Garmin 78s Global Positioning System (GPS). The survey aim determining the
land cover types, provide data for classification imagine, and true point for accuracy
assessment. Based on characteristic or bio-physical attribute of the area through field survey
this study divided into Forest, Agricultural land and Otherland.
Table 3.2. Ground control points (GCPs) and land cover classes
No
Land cover classes
Number of GCPs
1
Forest
80
2
Agricultural land
55
3
Other land
140
275
Total
16