Using remote sensing indices for mapping and monitoring spatialtemporal changes in coastal mangrove extents in thanh hoa province during 2005 2018
Bạn đang xem bản rút gọn của tài liệu. Xem và tải ngay bản đầy đủ của tài liệu tại đây (4.6 MB, 83 trang )
PUBLICATION
Hai-Hoa, N., Huu Nghia, N., An, L.T., Ngoc Lan, T.T., Khanh Linh, D.V
Simone Böhm (2018): Using remote sensing indices for mapping and
monitoring spatialtemporal changes in coastal mangrove extents in Thanh Hoa
province during 2005- 2018. Jounal of Geo-spatial Information Science
(Submited and accepted to be reviewed).
i
ACKNOWLEDGEMENTS
This research is funded by Vietnam National Foundation for Science and
Technology Development (NAFOSTED) under grant number 105.08-2017.05.
With the consent of Vietnam Forestry University, Ministry of Agriculture
and Rural Development faculty, we conducted the study “Using remote sensing
indices for mapping and monitoring spatial-temporal changes in coastal
mangrove extents in Thanh Hoa province during 2005- 2018”.
With this study, I am extremely grateful for the guidance, advice and the
support of many people. First, I would like to thank most sincerely and deeply to
my mentor – Associate Professor. Dr. Hai-Hoa Nguyen, who gave helpful
advices and strong supports during the implementation and completion of this
study.
Also, I would like to thanks for the encouraging words, and suggestions
of the teachers of the Forest Resources and Environment Management Faculty,
Vietnam Forestry University that helped me complete the study with the best
quality.
The study could not be finished and achieved the results without the
enthusiastic help, friendliness, and hospitality of the local government and
residents of two districts, namely Nga Son and Hau Loc, I would like give a big
thanks and extreme appreciation to them.
I also would like to thanks to our family and friends who always
supported and, encouraged me to perform and complete the study.
Because of the limited study duration as well as lacking awareness and
knowledgewe are looking forward to receiving the comments, evaluation and
feedback of teachers and friends to raise the quality of study and improve not
only the professional knowledge but also the lacking skills of us in this study.
I sincerely thank you!
ii
TABLE OF CONTENTS
PUBLICATION ..................................................................................................... i
ACKNOWLEDGEMENTS .................................................................................. ii
TABLE OF CONTENTS ..................................................................................... iii
LIST OF FIGURES .............................................................................................. vi
LIST OF TABLES ............................................................................................... vi
ABBREVIATION ............................................................................................... vii
CHAPTER I INTRODUCTION ........................................................................... 1
CHAPTER II LITERATURE REVIEW............................................................... 4
2.1. GIS and Remote sensing data ................................................................... 4
2.1.1. Concept of GIS and remote sensing ................................................... 4
2.1.2. Landsat image..................................................................................... 5
2.1.3. Sentinel Satellite Image ...................................................................... 6
2.1.4. Image classification approach ............................................................ 8
2.1.4.1. Vegetation indices ........................................................................ 8
2.1.4.2. Supervised classification .............................................................. 9
2.1.4.3. Unsupervised classification ......................................................... 9
2.2. Overview of coastal mangrove ............................................................... 10
2.2.1. In the world ...................................................................................... 10
2.2.2. In Vietnam ........................................................................................ 11
2.3. Remote sensing application to mangrove management ......................... 12
2.3.1. In the world ...................................................................................... 12
2.3.2. In Vietnam ........................................................................................ 14
CHAPTER III RESEARCH OBJECTIVES AND METHODOLOGY ............. 17
3.1. Goal and objectives ................................................................................ 17
3.1.1. Goal .................................................................................................. 17
3.1.2. Specific objectives ............................................................................ 17
3.2. Scope of study......................................................................................... 18
3.3. Material and methodology ...................................................................... 18
iii
3.3.1. Material description.......................................................................... 19
3.3.1.1. Satellite Imagery ........................................................................ 19
3.3.1.2. Secondary data collection .......................................................... 19
3.3.2. Fieldwork and data collection .......................................................... 19
3.3.2.1. Ground truthing .......................................................................... 20
3.3.2.2. Interviews ................................................................................... 20
3.3.2.3. Soil organic carbon sampling..................................................... 21
3.3.3. Data analysis..................................................................................... 21
3.3.3.1. Determining organic carbon ...................................................... 21
3.3.4. Image processing .............................................................................. 22
3.3.4.1. Data pre-processing.................................................................... 22
3.3.4.2. Images classification .................................................................. 23
3.3.4.3. Accuracy assessment.................................................................. 25
3.3.4.4. Thematic maps construction and mangroves dynamics. ........... 25
CHAPTER IV NATURAL AND SOCIO-ECONOMIC CONDITIONS .......... 27
4.1. Natural characteristics............................................................................... 27
4.1.1. Geographical conditions ................................................................... 27
4.1.2. Topography, climate, hydrology and natural resources ................... 28
4.1.2.1. Topography .................................................................................. 28
4.1.2.1. Climate ....................................................................................... 29
4.1.2.2. Hydrology .................................................................................. 29
4.1.2.3. Natural resources........................................................................ 29
4.2. Socioeconomic and cultural conditions .................................................. 31
4.2.1. Economic conditions ........................................................................ 31
4.2.2. Social and cultural conditions .......................................................... 32
4.3. Roles of coastal mangroves .................................................................... 32
CHAPTER V RESULTS AND DISCUSSIONS ................................................ 34
5.1. Current status and the management scheme of mangrove ..................... 34
5.1.1. Historical background of mangrove dynamics in study sites .......... 34
iv
5.1.2. Current status of mangrove forests .................................................. 28
5.1.3. Management scheme in mangrove forests ....................................... 30
5.2. Thematic maps using Image Classification ............................................ 32
5.3. Quantification of coastal mangrove extents and drivers of changes ...... 35
5.4. Soil organic carbon estimation ............................................................... 39
5.4.1. Soil organic carbon mapping............................................................ 39
5.4.2. Evaluate accuracy of carbon stock map in Nguyen Binh: .............. 40
5.4.3. Carbon price ..................................................................................... 42
5.5. Solutions for sustainable management ................................................... 43
5.5.1. Shortcomings of mangrove management ......................................... 43
5.5.2. Solutions for sustainable mangrove management ............................ 44
CHAPTER VI GENERAL CONCLUSION AND FURTHER STUDY ........... 47
6.1. General conclusions ................................................................................ 47
6.2. Limitation ............................................................................................... 48
6.3. Futher research........................................................................................ 49
REFERENCES .................................................................................................... 50
APPENDIX ......................................................................................................... 50
v
LIST OF FIGURES
Fig.3.1: Flow chart of constructing status maps and coastal mangrove extent. ....................... 18
Fig.3.2: Plots for soil sample.................................................................................................... 21
Fig.5.1: Spatial distribution of coastal mangroves in study areas in 2018. .............................. 28
Fig.5.2: Mangrove extents by different classification methods in April 2018........................ 33
Fig.5.3: Mangroves cover changes over period 2015-2018 ..................................................... 37
Fig.5.4: Soil organic carbon by IDW ....................................................................................... 40
LIST OF TABLES
Table 2.1: Sentinel 2 Radiometric and spatial resolutions .............................................7
Table 3.1: Remote sensing image collected in study. ..................................................19
Table 3.2: Equations of vegetation indices used for estimating mangrove cover. .......24
Table 5.1: Past and present mangrove projects in Thanh Hoa province. .....................27
Table 5.2: Accuracy assessment of map using different classification methods. .........29
Table 5.3: Structure characteristics of coastal mangrove forests .................................30
Table 5.4: Accuracy assessment of map using different classification methods..........34
Table 5.5: Mangroves cover changes over period 2005-2018 ......................................36
Table 5.6: Soil organic carbon ......................................................................................40
Table 5.7: Accuracy assessment of map using IDW ....................................................41
Table 5.8: Absorbed and commercial value of carbon in study areas. .........................43
vi
ABBREVIATION
CARE
Cooperative for Assistance and Relief Everywhere
CMMB
Community- Based Mangrove Management Board
DRC
Danish Red Cross
ERTS
Earth Resource Technology Satellite
GIS
Geographic Information System
IDW
Inverse distance weighted
JRC
Japanese Red Cross
LULC
Land Use/Land Cover
MMS
Multimission Modular Spacecraft
MSI
Multi-Spectral Instrument
PFES
Payment for forest environment services
REDD+
Reduce emissions from deforestation and forest degradation, and
foster conservation, sustainable management of forests, and
enhancement of forest carbon stocks
RS
Remote sensing
SLC
Scan Line Corrector
SWIR
Shortwave Infrared
TM
Thematic Mapper
VIs
Vegetation Indices
VNIR
Visible and Near-Infrared
VNRC
Viet Nam Red Cross
vii
CHAPTER I
INTRODUCTION
The coastal mangrove forests are one of the most productive ecosystems
on this planet (Ramdani et al., 2018) that provide a wide range of ecological and
economic products and services, and also support a variety of others coastal and
marine ecosystems (Van Ieperen, 2012, Salem and Mercer, 2012, Viswanathan
et al., 2011). Over the past five decades, discussions of mangrove ecosystems
and management have focused on: the ability to fix, store and mineralize carbon;
their nursery functions; shoreline protection, and their land-building capacity
(Peneva-Reed, 2014, Lee et al., 2014, Viswanathan et al., 2011, Naciones et al.,
2004, Field et al., 1998). Mangroves can be disturbed by natural events, such as
typhoons and floods. However, nearly all of the mangroves have experienced
significant losses in recent decades under the economic and population pressure
to meet the major demand for aquaculture and fishing. In addition, it is
estimated a world population growth with a peak of 9.22 billion in 2075
(Naciones et al., 2004), which leads to increasing pressures from human
activities including over-harvesting, aquaculture, and coastal development
interventions (Viswanathan et al., 2011). Besides, despite existing rules,
regulations and policies, the management, and protection of mangrove resources
are still poor and lack linkage among sectored, and studies have not brought
specific solutions and practices. It is estimated that about one-fifth of all
mangroves have been lost since 1980 and nowadays, many remaining mangrove
forests are considered degraded (Van Ieperen, 2012). Although the annual global
rate of mangrove forest loss declined from just over 1% in the 1980s to 0.66%
between 2000 and 2005, it is nevertheless still 3-5 times higher than the average
rate of loss of all forest (Duke et al., 2014). The Vietnam War (1962-1971)
resulted in the destruction of nearly 40% of mangrove forests in Southern
Vietnam (Hong and San, 1993).
Thanh Hoa province is located in the North Central region of Vietnam
1
with 102 km of the coastline that has total wetlands and coastal mangrove
forests about 1195.53 ha in 2018 included 967.53 ha of mangroves. Thanh Hoa
province is also considered to have a high potential for planning, restoration, and
development of mangroves, thus promoting local people‟s livelihoods.
However, due to the shortage of investigation and studies in the mangrove sites,
there are still a few comprehensive documents and information about mangroves
in this study site.
In the last three decades, spatial technology has evolved dramatically to
include a suite of sensors operating at a wide range of imaging scales with
potential interest (Rogan and Chen, 2004) and this technology is widely applied
not only in people „s lives today but also in the scientific research. The remote
sensing and Geographic Information System (GIS) technologies are a powerful
tool that enables to capture, store, analyze and manage referenced data of the
different objects in the Earth surface spatially (Zaman, No date). Particularly,
remote sensing (RS) data is the primary source and a powerful application in
investigating the change in forests (Singh, 1989, Lu et al., 2004). It has been
identified as an effective tool to study, which otherwise makes it difficult to
reach and difficult to penetrate mangroves along coastal areas (Green et al.,
1998, Dat et al., 2000, Wang et al., 2003). In a few studies, a GIS and remote
sensing data have been used for wetland cover mapping in Vietnam (Dat et al.,
2000). This study is to quantify the extents of mangrove forest in the whole
coastline of Thanh Hoa province for four different years (2005, 2010, 2015 and
2018) to understand mangrove dynamics over the last 13 years using freely
available multi-temporal Landsat, Sentinel imageries and Land Use/Land Cover
(LULC) maps by using Supervised classification, Unsupervised classification,
NDVI, SAVI, MSAVI, IPVI, DVI, GNDV, BNDV, OSAVI, TVI, and EVI
(Table 03). Therefore, by using Landsat and Sentinel imageries between 2005
and 2018, this study tends to quantify the change in mangroves extends based on
the method, which has the highest accuracy and reliable for the study site. The
2
study then identifies drivers of changes in mangrove extents and suggests
feasible solutions for enhancing mangrove management activities.
3
CHAPTER II
LITERATURE REVIEW
2.1.
GIS and Remote sensing data
2.1.1. Concept of GIS and remote sensing
GIS is a system of synthesizing and analyzing hardware, software, and
data to “capture images”, manage, manipulate, and present all sorts of
geographic data (Iyengar, 1998). It is a powerful tool for military trainers,
environmentalists, and natural resource planners.
Remote Sensing means obtaining information about an object, area or
phenomenon without coming in direct contact with it. It can be understood as
the practice of deriving information about the Earth‟s land and water surfaces
using images acquired from an overhead perspective, using electromagnetic
radiation in one or more regions of the electromagnetic spectrum, reflected or
emitted from the Earth‟s surface (Shravan et al., 2013). There are different types of
RS technologies. These include visual, optical infrared, electmicrowave, radar,
satellite, airborne, and acoustic remote sensing systems. The different
applications of the systems are geology, mineral exploration, oceanography,
agriculture, forestry, land degradation, environmental monitoring, and so on. In
order to take advantage of remote sensing data, meaningful information needs to
be extracted. Much interpretation and identification of targets in remote sensing
imagery are performed manually or visually, i.e. by a human interpreter.
Recognizing targets is the key to interpretation and information extraction.
Observing the differences between targets and their backgrounds involves
comparing different targets based on any or all of the visual elements of tone,
shape, size, pattern, texture, shadow, and association.
The integration between RS and GIS is considered a great application.
4
The temptation to take advantage of the opportunity to combine ever-increasing
computational power, modern telecommunications technologies, more plentiful
and capable digital data, and more advanced algorithms has resulted in a new
round of attention to the integration of remote sensing and GIS as well as with
GPS for environmental, resources, and urban studies (Wang and Cheng, 2010).
These tools will facilitate all levels of processing remotely sensed raster data,
from pixel-based to per-parcel approaches and context-based approaches in an
object-oriented environment. This could subsequently lead to a full
implementation of spatial operators („GIS-operators‟) in remote sensing
software (Blaschke et al., 2000). In particular, such technologies assist in
monitoring the change in LULC.
2.1.2. Landsat image
Landsat satellites have provided multispectral images of the Earth
continuously since the early 1970s. Landsat data have been used in a variety of
government, public, private, and national security applications. Examples
include land and water management, global change research, oil and mineral
exploration, agricultural yield forecasting, pollution monitoring, land surface
change detection, and cartographic mapping.
Landsat 8 is the latest satellite in this series which began in 2002. The first
was launched in 1972 with two Earth-viewing imagers - a Return Beam Vidicon
(RBV) and an 80-meter, 4-band Multispectral Scanner (MSS). Landsat 2 and
Landsat 3 launched in 1975 and 1978, respectively, were configured similarly.
In 1984, Landsat 4 was launched with the MSS and a new instrument called the
Thematic Mapper (TM). Instrument upgrades included improved ground
resolution (30 meters) and three new channels or bands. In addition to using an
updated instrument, Landsat 4 made use of the Multimission Modular
Spacecraft, which replaced the Nimbus-based spacecraft design employed for
Landsat 1- Landsat 3. Landsat 5, a duplicate of Landsat 4, was launched in 1984
5
and returned scientifically viable data for 23 years - 28 years beyond its 5-year
design life. Landsat 6, equipped with an additional 15-meter panchromatic band,
was lost immediately after launch in 1993. Finally, Landsat 7 was launched in
1999 and performed nominally until its Scan Line Corrector (SLC) failed in
May 2003. Since that time, L7 has continued to acquire useful image data in the
“SLC-off” mode. All L7 SLC-off data is of the same high radiometric and
geometric quality as data collected prior to the SLC failure.
2.1.3. Sentinel Satellite Image
The first satellite which was designed to monitor the Earth's surface is
called ERTS (Earth Resource Technology Satellite- techniques probe the Earth),
also known as Landsat-1 was launched on 7/23/1972 by NASA. It was designed
as an experiment to test the feasibility to collect data from the Earth. Until today,
the satellite image is still the best tool to help people to observe the Earth and
other planets in the solar system as well as serving for research monitoring and
data collection. Sentinel mission is based on a constellation of two satellites to
fulfill revisit and coverage requirements, providing robust datasets for
Copernicus Services. Sentinel-2 is a polar-orbiting, multispectral high-resolution
imaging mission for land monitoring to provide, for example, the imagery of
vegetation, soil and water cover, inland waterways, and coastal areas. Sentinel-2
can also deliver information for emergency services. Sentinel-2A was launched
on 23 June 2015 and Sentinel-2B followed on 7 March 2017. The Sentinel-2
Multi-Spectral Instrument acquires 13 spectral bands ranging from Visible and
Near-Infrared (VNIR) to Shortwave Infrared (SWIR) wavelengths along a 290km orbital swath. The spatial resolution is dependent on the particular spectral
band:
4 bands at 10 meter: blue (490 nm), green (560 nm), red (665 nm),
and near-infrared (842 nm).
6
6 bands at 20 meter: 4 narrow bands for vegetation characterization
(705 nm, 740 nm, 783 nm, and 865 nm) and 2 larger SWIR bands (1,610
nm and 2,190 nm) for applications such as snow/ice/cloud detection or
vegetation moisture stress assessment.
3 bands at 60 meter: mainly for cloud screening and atmospheric
corrections (443 nm for aerosols, 945 nm for water vapor, and 1375 nm
for cirrus detection).
Table 2.1: Sentinel 2 Radiometric and spatial resolutions
S2A
Bands
Number
S2B
Central
wavelength (nm)
Bandwidth
(nm)
Central
wavelength (nm)
Bandwidth
(nm)
1
443.9
27
442.3
60
2
496.6
98
492.1
10
3
560
45
559
10
4
664.5
38
665
10
5
703.9
19
703.8
20
6
740.2
18
739.1
20
7
782.5
28
779.7
20
8
835.1
145
833
10
8a
864.8
33
864
20
9
945
26
943.2
60
10
1375.5
75
1376.9
60
11
1613.7
143
1610.4
20
12
2202.4
242
2185.7
20
Sources: Gatti and Bertolini (2013).
Data acquired after December 5 in 2016 including a full resolution TrueColor Image as an RGB (red, green, blue) composite image created from bands
4, 3, 2. Color combinations of images are used to set up the current state of
forest maps. There are many color bands together for the figures in different
colors. Each combination has its own advantages and disadvantages. But this
study just gives the characteristics of the combination of bands 432-RGB color
7
which created a full resolution True-Colour Image as an RGB (red, green, blue).
2.1.4. Image classification approach
2.1.4.1. Vegetation indices
Vegetation Indices (VIs) obtained from remote sensing based canopies are
quite simple and effective algorithms for quantitative and qualitative evaluations
of vegetation cover, vigor, and growth dynamics, among other applications (Xue
and Su, 2017). Those indices have been widely implemented within RS
applications using different airborne and satellite platforms. Remote sensing of
vegetation is mainly performed by obtaining the electromagnetic wave
reflectance information from canopies using passive sensors (Ashraf et al.,
2011). It is well known that the reflectance of light spectra from plants changes
with plant type, water content within tissues, and other intrinsic factors (Van
Lavieren et al., 2012). The main applications for remote sensing of vegetation
are based on the following light spectra: (i) the ultraviolet region (UV), which
goes from 10 to 380 nm; (ii) the visible spectra, which are composed of the blue
(450–495 nm), green (495-570 nm), and red (620–750 nm) wavelength regions;
and (iii) the near and mid-infrared band (850–1700 nm). The emissivity rate of
the surface of leaves (equivalent to the absorptivity in the thermal waveband) of
a fully grown green plant without any biotic or abiotic stress is generally in the
range of 0.96–0.99 and is more often between 0.97 and 0.98. On the contrary,
for dry plants, the emissivity rate generally has a larger range going from 0.88 to
0.94. Vegetation emissivity in the near and mid-infrared regions has been widely
studied within plant canopies. Different applications are dependent on the
reflectivity peaks or overtones for specific compounds within the visible and
near/mid-infrared regions of light spectra. This study uses NBR, SR, NDVI,
GNDVI, BNDVI, SAVI, OSAVI, MSAVI, DVI, IPVI, EVI2, TVI
mangrove mapping.
8
for
2.1.4.2.
Supervised classification
According to Richards and Richards (1999) supervised classification is
the technique most often used for the quantitative analysis of remote sensing
image data. At its core is the concept of segmenting the spectral domain into
regions that can be associated with the ground cover classes of interest to a
particular application. In practice, those regions may sometimes overlap. A
variety of algorithms is available for the task, and it is the purpose of this
chapter to cover those most commonly encountered. Essentially, the different
methods vary in the way they identify and describe the regions in spectral space.
Some seek a simple geometric segmentation while others adopt statistical
models with which to associate spectral measurements and the classes of
interest. Some can handle user-defined classes that overlap each other spatially
and are referred to as soft classification methods; others generate firm
boundaries between classes and are called hard classification methods, in the
sense of establishing boundaries rather than having anything to do with the
difficulty in their use. Often the data from a set of sensors is available to help in
the analysis task. Maximum likelihood classification is one of the most common
supervised classification techniques used with remote sensing image data and
was the first rigorous algorithm to be employed widely.
Supervised classification can be very effective and accurate in classifying
satellite images and can be applied at the individual pixel level or to image
objects (groups of adjacent, similar pixels) and for the process to work
effectively, the person processing the image needs to have a priori knowledge
(field data, aerial photographs, or other knowledge) of where the classes of
interest (e.g., land cover types) are located or be able to identify them directly
from the imagery.
2.1.4.3.
Unsupervised classification
Unsupervised classification is where the outcomes (groupings of pixels
9
with common characteristics) are based on the software analysis of an image
without the user providing sample classes. The computer uses techniques to
determine which pixels are related and groups them into classes. The user can
specify which algorism the software will use and the desired number of output
classes but otherwise does not aid in the classification process. However, the
user must have knowledge of the area being classified when the groupings of
pixels with common characteristics produced by the computer have to be related
to actual features on the ground (such as wetlands, developed areas, coniferous
forests, etc.). Overall, unsupervised classification is the most basic technique.
Because you don‟t need samples for unsupervised classification, it‟s an easy
way to segment and understand an image.
2.2.
Overview of coastal mangrove
2.2.1. In the world
“Mangrove” is an ecological term referring to a taxonomically diverse
association of woody trees and shrubs (Ball, 1996) which have common
morphological, biochemical, physiological and reproductive adaptations that
allow them to colonize and develop in saline, hypoxic environments (Alongi,
2018). In addition, the term mangroves denote a group of 68 woody halophytic
plant communities (Basha, 2018) which have the ability to adapt to the extreme
transitional zone, which embodies divergent habitats between marine and
terrestrial environment. Mangrove is one of the highest yielding ecosystems,
which constitute just 0.1 % of the earth‟s continental land surface, they are
responsible for 10 to 11 % of the total export of terrestrial C to the ocean and for
8 to 15 % of the C deposited in coastal sediments (Liu et al., 2014), mangroves
play an important role in the global carbon cycle. They are one of the most
carbon-rich ecosystems (Donato et al., 2011) because of their high productivity,
rapid sediment accretion, and low respiration rates.
10
The structure and functions of mangroves diverge significantly depending
on the topography, substrate, latitude, and hydrology. Mangroves are classified
into four major associations of different structure in relationship with features
and the environment in which they exist (Lugo and Medina, 2014). They are
fringe/coastal mangroves; riverine /estuarine mangroves; basin mangroves; and
dwarf scrub mangroves.
Mangrove species have unique adaptations for survival. Noteworthy
amongst this survival includes gas exchange through the stilt roots and
pneumatophores. Some species re-sprout while others fill vacant growing spaces
in response to canopy disturbances (Kauffman and Cole, 2010).
2.2.2. In Vietnam
Like many other countries in Southeast Asia, the mangrove area in
Vietnam has decreased markedly. In Vietnam, it is estimated that the number of
mangrove forest was about 400,000 hectares in the early 20th century. However,
this number declined dramatically over 50 years (Tuan et al., 2003). In Northern
parts of Vietnam, from Mong Cai to Do Son, throughout the periods from 1964
to1997, mangrove area decreased by 17,094 ha. In the Red River plain, the loss
of mangrove was 4,640 ha from 1975 to 1991 then followed by a decrease of
7,430 ha in 1993 (NEA, 2003). The coastal zone of Southern Vietnam witnessed
minor decrease of mangroves (from 250,000 ha to 210,000 ha) during 1950 1960 yet, the figure reduced to 92,000 ha of mangroves in 1975 due to the
spraying of warring herbicides by the American force (1962 – 1972) (Tuan et
al., 2002). Therefore, it is necessary to monitor mangrove forest, and mapping of
mangroves is important in order to support coastal zone management and
planning programs.
The Viet Nam Red Cross (VNRC) has been at the forefront of these
activities since 1994 when Thai Binh launched the community-based MP/ DRR
project with the support of the Danish Red Cross (DRC). In 1997, after a series
11
of successes, the project was expanded to include another seven coastal
provinces in Northern Vietnam. In support of VNRC‟s implementation of the
project, the DRC expanded its coverage to Nam Dinh province, while the
Japanese Red Cross (JRC) initiated funding to six provinces (Ha Tinh, Hai
Phong, Nghe An, Ninh Binh, Thanh Hoa, and Quang Ninh) through the IFRC.
By the early 2000s, the focus of the project was broadened to include disaster
preparedness training and afforestation with bamboo and Casuarina trees in
communes along the rivers. In 2005, DRC finished its part of the project, and
JRC has funded activities in all eight provinces since then.
2.3.
Remote sensing application to mangrove management
2.3.1. In the world
LULC have become one of the key issues in sustainable development and
global environmental changes (Guan et al., 2011, Halmy et al., 2015). Up-todate, adequate and reliable LULC changes information from the past to present
together with the future plausible changes is vital to understand and evaluate
several social, economic and environmental consequences of these changes
(Foley et al., 2005). In recent years, the attention of researchers has been
directed towards GIS and RS techniques for monitoring LULC changes. The RS
data and GIS techniques have been increasingly applied in the land use map
extraction, so LULC changes analysis and urban development investigation due
to their cost-effectiveness and high efficiency (Parsa and Salehi, 2016).
Recent efforts in spatial and temporal data models and database systems
have attempted to achieve an appropriate kind of interaction between the two
areas. Since the integration of spatial and temporal database models into spatiotemporal database models, a number of new approaches have been proposed,
and reviews of this work have classified and compared to the existing spatiotemporal models. One of the most significant contributors to the domain has
12
been (Kucera, 1992) who first looked at the aspects of the time in GIS (GISs).
Although Langran‟s work has emerged since Frank (1992)was one of the first to
attempt to present the poor theories and methods of reasoning in the timevarying spatial space, while a bibliography of spatio-temporal databases was
published until 1994 in Al-Taha et al. (1994), which contains interesting
pointers for further reference. More fruitful reviews of the domain were
available in the forthcoming years, Yuan (1996), Renolen (1995), Abraham and
Roddick (1999), Sellis (1999), Peuquet (2001), and especially in Pavlopoulos
(1998), where the classification of spatio-temporal database models used in the
current survey of the area is introduced over many of the most important issues
of spatio-temporal systems, a number of new proposals.
Currently, domain experts are trying to achieve more effective integration
of the spatial and temporal aspects providing practical, unified spatio-temporal
data modeling, and clarifying the direction for further research and development.
One of the simplest spatio-temporal data models is the snapshot model
(Langran, 1988). Temporal information has been incorporated into this spatial
data model by timestamping layers. In this model, every layer is a collection of
temporally homogeneous units of one theme. It shows the states of a geographic
distribution at different times without explicit temporal relations between the
layers. Another closely related approach was presented by Armenakis (1992),
where spatio-temporal data are looked at with respect to storage, retrieval and
update efficiency. He compared three approaches, which he called „„estimation
methods‟‟ to describe time-varying spatial information. The aim of his
investigation was to see whether these methods have the ability to reconstruct
complete geographical states, offer functionality for comparisons between states,
and describe the events that lead to changes between states.
Concluding, early work on spatio-temporal database modeling attempted
to capture the state of real-world objects or the physical events upon them, on
the timeline. However, investigations in real-world applications brought new
13
directions and requirements for further development. Thus, the processes of
continuous change on the timeline, changes in the description, size, position, the
extent of entities were investigated and models to capture them were proposed.
At the same time, various types of spatio-temporal attributes were defined and
the importance of enhanced relationship operations was recognized. The models
on a later stage are more concerned with conceptual notation of spatio-temporal
data. The next step in the spatio-temporal database development is the testing
stage, where the models proposed to run on different applications, to identify
further requirements and research directions.
2.3.2. In Vietnam
To access the rapid development of the time, Vietnam has applied the
advanced scientific technology in the management, protection, and development
of forest resources in general and mangrove resources in particular. The
application of remote sensing technology in the research in management and
protection of natural resources as well as in environmental monitoring is also
necessary and priorities. In 2003, the Prime Minister has agreed to build ODA
from France to build Construction Project Monitoring System of Natural
Resources and Environment in Vietnam. In 1998, Vietnam is the 50th
participation Ramsar Convention and the first country in Southeast Asia signed
the International Convention on Wetlands. Since then, researchers and scientists
have embarked on researching remote sensing technology and its application to
problems related to mangroves. In Hai Phong province, one of the Northern
provinces, due to the benefits of coastal mangroves, scientists are interested in
research. There are many projects and studies about applying GIS and Remote
sensing data.
Cuc and Chinh (2014) were also involved in topic research functional and
services of mangrove at Dai Hop, Kien Thuy, and Hai Phong as the results
indicated the ability to protect sea dike, as well as direct economic benefits of
14
mangroves. In addition, the project also pointed out the ecological benefits
through CO2 aborting function of mangroves. This is one of the extremely
valuable researches in the management and efficient exploitation of mangroves
in Dai Hop commune, Kien Thuy and Hai Phong.
Moreover, many different researches using remote sensing technique to
research mangrove issues such as Khanh (2008) conducted the project of
research and application of remote sensing and GIS technology build a map of
the current state of natural resources serving planning provincial environmental
protection. As a result, shows that the selection of remote sensing and GIS
technology is the optimal solution for the work of mapping the current state of
natural resources in service the planning and environmental protection. Remote
sensing tool allows collecting information of objects on a wide area and in a
short time with high accuracy which met the requirements of information
synchronized. Phuong et al. (2014) conducted the project of applying remote
sensing to map vegetation land-cover in Nghe An province. This study indicates
that based on a combination of vegetation index and the heat allow the
establishment of vegetation cover map province Nghe An in 2000, 2010 and
2013 quickly and accurately. This method solves the lack of field data
verification inception maps of vegetation cover during the period from 2000 to
2013.
Hoa (2016) worked on using Landsat imagery and vegetation indices
differencing to detect mangrove change in Thai Thuy district in Thai Binh
province. This research used multi-temporal Landsat data and GIS technology to
quantify changes in coastal mangroves then, proposed a scientific foundation for
better mangrove management. Vegetation indices, such as NDVI, SAVI, IPVI,
DVI, SR, RVI were adopted as a suitable method to quantify and monitor the
extents of mangrove, this study and NDVI showed the most accurate in
comparison with others.
15
In short, remote sensing and GIS technology have currently been applied
in a wide range of natural resources and environmental management. However,
there are obstacles preventing Vietnam from catching up with the world and
there are few researches in Thanh Hoa province. Using remote sensing data to
monitor spatial-temporal changes in extents of coastal mangroves in Thanh Hoa
province plays an important role in an effective mangrove mapping and
management.
16
CHAPTER III
RESEARCH GOAL, OBJECTIVES AND METHODOLOGY
3.1.
Goal and objectives
3.1.1. Goal
This study aimed to provide a good scientific basis for better management of coastal
mangroves through using multitemporal remote data approach in Vietnam.
3.1.2. Specific objectives
In order to meet the overall goal of this study, the following are the
objectives:
Objective 1: To analyze the current status and management scheme of coastal
mangroves in the study area, this objective answered the questions of how spatially
coastal mangrove forests have distributed in the study area and how was mangrove
managed.
Objective 2: To construct thematic maps using multi-temporal remote sensing
data, this objective answered the question of which method is the most suitable for
quantifying coastal mangroves extents.
Objective 3: To quantify the changes in extents of coastal mangrove and
determine the drivers of changes in mangrove extents in each periods (2005-2010,
2010-2015, 2015-2018, this objective answered the question of how much coastal
mangrove forests have changed over the last 13 years and what are the main causes of
changes in mangrove.
Objective 4: To estimate organic carbon of mangrove from a field-based
plot survey and Inverse distance weighted (IDW)-based interpolation approach
in studied sites, this objective answered the questions of how much carbon
mangroves can store and its price.
17
Objective 5: To propose solutions for better management of coastal mangroves
in study sites, this objective answered the questions of what applicable solutions
should be given for sustainable management of coastal mangroves in study sites.
3.2.
Scope of study
Spatial scale: This study is conducted in Nga Son and HauLoc districts,
Thanh Hoa province. In addition, coastal mangroves are selected in this study.
Temporal scope: The research was conducted from 2005 to April 2018.
3.3.
Material and methodology
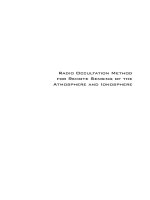
The flow diagram showing the sequence and method employed in
embarking on the research as shown in Fig.3.1.
Fig.3.1: Flow chart of constructing status maps and coastal mangrove extent.
18