Tài liệu Laser điốt được phân phối thông tin phản hồi và các bộ lọc du dương quang P7 ppt
Bạn đang xem bản rút gọn của tài liệu. Xem và tải ngay bản đầy đủ của tài liệu tại đây (242.4 KB, 24 trang )
7
Above-Threshold Analysis of
Various DFB Laser Structures
Using the TMM
7.1 INTRODUCTION
The above-threshold lasing characteristics of DFB semiconductor laser diodes were
presented in the previous chapter using a modified transfer matrix. Instead of using an
averaged carrier concentration, the inclusion of the actual carrier distribution allows
phenomena such as the spatial hole burning effect and non-linear gain to be included. In the
analysis, a parabolic gain model and high-order carrier recombination were assumed. Lasing
mode characteristics such as the longitudinal distribution of carrier density, photon density,
refractive index and the internal field intensity were shown for various laser structures. In
this chapter, results obtained from the lasing mode characteristics will be used to determine
the mode stability and noise characteristics of DFB LDs.
For a coherent optical communication system, it is essential that the LD used oscillates at
a stable single mode and that a narrow spectral linewidth is achieved. Using the information
obtained for the lasing mode characteristics, a method derived from the above-threshold
transfer matrix model will be introduced in section 7.2 which allows the gain margin to be
evaluated. By introducing an imaginary wavelength into the transfer matrix equation, chara-
cteristics of other non-lasing side modes can be evaluated and hence the single-mode stability
can be obtained. Numerical results obtained using this method will be presented in section 7.3.
In section 7.4, an alternative method which allows the theoretical prediction of the above-
threshold spontaneous emission will be presented. Based on the Green’s function method,
one can use transfer matrices to help determine the single-mode stability of a DFB laser
structure by inspecting the spectral components of oscillating modes.
The TMM also allows the noise characteristics of the DFB LD to be evaluated. In
section 7.5, it will be shown that various contributions to the spectral linewidth can be
determined using the information obtained from the above-threshold transfer matrices. In
the analysis, the effective linewidth enhancement factor [1] has been used instead of the
material-based linewidth enhancement [2]. Using a more realistic effective linewidth
enhancement factor, impacts caused by structural changes can be investigated in a
systematic way.
Distributed Feedback Laser Diodes and Optical Tunable Filters H. Ghafouri–Shiraz
# 2003 John Wiley & Sons, Ltd ISBN: 0-470-85618-1
7.2 SINGLE-MODE STABILITY IN DFB LDs
Using the TMM-based above-threshold laser cavity model as presented in the previous
chapter, distributions of the carrier density, photon density, refractive index and the
normalised internal field intensity were obtained for various DFB laser structures. From the
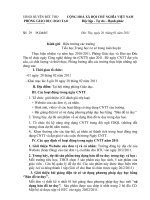
emitting photon density at the facet, the output optical power can be evaluated. Figure 7.1
summarises results obtained for QWS, 3PS and DCC þ QWS LDs with biasing current as a
parameter. Within the range of biasing current that we are interested in, no ‘kink’ is observed
in any of the three cases. Compared with the QWS structure, it seems that the introduction of
multiple phase shifts along the 3PS laser cavity has increased the overall cavity loss. The
figure also shows that the 3PS laser structure having the largest amplitude threshold gain has
a relatively larger value of threshold current. Among the three cases, both the 3PS and the
DCC þ QWS structures appear to have relatively larger output power under the same
normalised biasing current.
Semiconductor lasers having stable single longitudinal outputs and narrow spectral
linewidths are indispensable in coherent optical communication systems. With a built-in
wavelength selective corrugation, a DFB laser diode has a single longitudinal output. Other
oscillation modes failing to reach the threshold condition become the non-lasing side modes.
As the biasing current increases, the spatial hole burning effect becomes significant and
mode competition between the lasing mode and the most probable non-lasing side mode
may occur. Mode competition has been observed for a QWS DFB laser [3–5], which resulted
Figure 7.1 Optical output power of three different types of DFB LD.
172
ABOVE-THRESHOLD ANALYSIS OF VARIOUS DFB LASER STRUCTURES
in multiple mode oscillation as the biasing current increased. In this section, a numerical
method that allows theoretical prediction of the above-threshold single-mode stability of
DFB LDs will be presented. In the analysis, it is assumed that the detailed lasing mode
characteristics have been obtained from the above-threshold transfer matrix model as
discussed in the previous chapter.
Single-mode stability implies the suppression of non-lasing side modes. There are two
possible ways to demonstrate single-mode stability in DFB LDs. The first approach involves
the evaluation of the normalised gain margin ÁL between the lasing mode and the probable
non-lasing side modes. The single-mode stability is said to be threatened if the gain margin,
Á, drops below 5 cm
À1
for a 500 mm length laser cavity. An alternative method to check
the stability of the device involves the measurement of the spectral characteristics. With the
help of an optical spectrum analyser, the measured intensity difference between the lasing
mode and the side modes will give single-mode stability. The second approach is often used
to measure the single-mode stability of DFB LDs. In this section, we will concentrate on the
first approach which leads to the evaluation of the above-threshold gain margin.
From the numerical method discussed in the previous chapter, oscillation characteristics
of the lasing mode were obtained at a fixed biasing current. By dividing the DFB laser into a
large number of smaller sections, longitudinal distributions like the carrier and photon
densities were determined. Since the laser cavity is now dominated by the lasing mode, the
characteristics of other non-lasing side modes should be derived from the lasing mode. In
order to evaluate the characteristics of other non-lasing side modes, the dominant lasing
mode has to be suppressed in a mathematical way. In the analysis, an imaginary wavelength
i
is introduced [6]. As a result, the complex wavelength
c
of an unknown side mode
becomes
c
¼ þ j
i
ð7:1Þ
where
i
takes into account the mathematical gain the side mode may need to reach its
threshold value and becomes the actual wavelength of the side mode. By changing values
of both and
i
, wavelengths of other non-lasing side modes can be evaluated.
The numerical procedure involved in determining the characteristics of other non-lasing
side modes is summarised as follows:
1. A numerical procedure similar to the one discussed in section 6.3 is adopted. To
initialise the iteration process, a 5 Â 5 mathematical grid which consists of points (;
i
)
is formed. Each of these (;
i
) points will be used as an initial guess. Since the most
probable non-lasing side mode is usually found near the lasing mode, it is advisable to
start with those wavelengths which are close to that of the lasing mode.
2. Lasing mode characteristics like the longitudinal distribution of the carrier, photon
density and refractive index are retrieved from the data files obtained earlier. Matrix
elements of each transfer matrix are then determined.
3. From the boundary condition at the left facet, electric fields E
R
ðz
1
Þ and E
S
ðz
1
Þ at the left
facet are found which serve as the input electric field to the transfer matrix chain.
4. By passing the electric field through the transfer matrix chain, the output electric field at
the right laser facet is determined. The discrepancy with the right facet boundary
condition is then evaluated and stored.
SINGLE-MODE STABILITY IN DFB LD
173
5. Steps (2) to (4) are then repeated with other pairs of (;
i
) obtained from the 5 Â 5
mathematical grid. By comparing the discrepancy obtained from each of these (;
i
)
pairs, the one showing the minimum discrepancy is then selected. Depending on the
position of the selected (;
i
) on the mathematical grid, a new mathematical grid is
formed ready for the next iteration.
6. Procedures shown above are then repeated until the discrepancy with the right facet
boundary condition falls below 10
À14
. The final obtained becomes the non-lasing side
mode and distributions of the amplitude gain ðzÞ and the detuning coefficient ðzÞ are
stored.
7. The average values of
"
SM
and
"
SM
associated with the side mode are evaluated from the
corresponding longitudinal distribution as
"
SM
¼
P
N
j¼1
j
N
ð7:2Þ
"
SM
¼
P
N
j¼1
j
N
ð7:3Þ
where
j
and
j
ð j ¼ 1toNÞ are the amplitude gain value and the detuning value
obtained from each transfer matrix, and N is the total number of transfer matrices.
8. The whole numerical procedure can be repeated for other non-lasing side modes. All
"
SM
obtained are then sorted in increasing order. The one showing the smallest value
becomes the most probable side mode. Characteristics of a new dominant lasing mode
must be loaded every time a new injection current is used.
From the result obtained, the gain margin between the lasing mode and the most probable
non-lasing side mode can be evaluated as
Á ¼
"
L
À
"
SM
ð7:4Þ
To maintain a stable single-mode oscillation, one must ensure that ÁL > 0:25 for a 500 mm
length laser cavity.
7.3 NUMERICAL RESULTS ON THE GAIN MARGIN
OF DFB LDs
In this section, numerical results obtained for various DFB LDs, including the QWS, 3PS
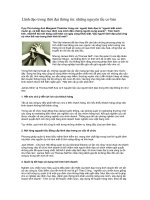
and the DCC þ QWS laser structures, will be presented. Figure 7.2 shows the characteristics
of the lasing mode (0) and side modes (Æ1) in the
"
L;
"
L
ÀÁ
plane. In the analysis, an anti-
reflection-coated QWS DFB structure with L ¼ 2 is assumed for a 500 mm length cavity.
For each oscillating mode shown in Fig. 7.2, the cross and the black circle correspond to the
oscillating mode at threshold and at 5I
th
, respectively. When the biasing current increases
from the threshold value, an increase in the lasing mode amplitude gain and a corresponding
reduction of gain margin between the lasing mode and the þ1 side mode can be seen. Such a
phenomenon is well known to be induced by the spatial hole burning effect [5].
174
ABOVE-THRESHOLD ANALYSIS OF VARIOUS DFB LASER STRUCTURES
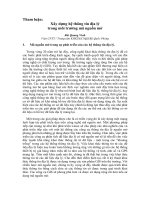
Figure 7.3 shows the normalised amplitude gain change of the QWS DFB LD with respect
to the biasing current. The amplitude gain distributions for the lasing mode and the non-
lasing side modes are shown. It is obvious that the
"
L value of each mode varies in a
different way. When the biasing current increases from threshold, it is clear that the
amplitude gain of the þ1 mode reduces remarkably and approaches that of the lasing mode.
By contrast, the amplitude gain of the À1 mode becomes larger and hence becomes less
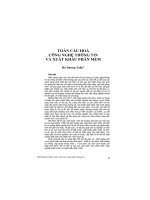
significant. In Fig. 7.4, for the same QWS structure, the variation of the normalised detuning
coefficient
"
L is shown. In such a strongly coupled LD, both the lasing mode and the þ1 side
mode shift towards the shorter wavelength side (negative
"
L) with increasing biasing current.
Among the different modes shown, the shift of the lasing mode is stronger since it is found
closer to the gain peak.
With multiple phase shifts introduced along the corrugation, the characteristics of the 3PS
structure are shown in Fig. 7.5. In the analysis, the 3PS DFB is assumed to be anti-reflection
coated. Phase shifts
2
¼
3
¼
4
¼ =3 and PSP ¼ 0:5 are assumed for the 500 mm
long cavity. Compared with the QWS structure, the 3PS structure shows a smaller shift in
mode characteristics. This may be clearer when the variation of both amplitude gain and the
detuning coefficient are shown as a function of normalised injection current. From Fig. 7.6
where the amplitude gain change is shown, the injection current alters the oscillating mode
in a different way. It can be observed that the gain margin between the lasing mode and the
Figure 7.2 Lasing characteristics of the QWS DFB laser structure in the (
"
L, "L) plane showing two
values of normalised injection current.
NUMERICAL RESULTS ON THE GAIN MARGIN OF DFB LDS
175
Figure 7.3 Average amplitude gain
"
L of the QWS DFB laser structure versus the normalised
injection current. Results for both the lasing mode and non-lasing side modes (Æ1) are shown.
Figure 7.4 Average detuning coefficient
"
L of the QWS DFB laser structure versus the normalised
injection current. Results for both the lasing mode and non-lasing side modes (Æ1) are shown.
Figure 7.5 Lasing characteristics of the 3PS DFB laser structure in the ð
"
L;
"
LÞ plane showing two
values of normalised injection current.
Figure 7.6 Average amplitude gain
"
L of the 3PS DFB laser structure versus the normalised injection
current. Results for both the lasing mode and non-lasing side modes (Æ1) are shown.
most probable side mode (þ1) shows little change. A similar situation can be seen in Fig. 7.7
where the variation of the detuning coefficient is demonstrated. The lasing mode shown has a
milder shift with increasing biasing current. On combining results from both Figs. 7.6
and 7.7, it appears that the 3PS laser structure is not seriously affected by the spatial hole
burning effect. No severe reduction of gain margin and a fairly mild shift in detuning
coefficient are observed.
Results obtained from a DCC þ QWS laser structure for the lasing characteristics,
amplitude gain and the detuning coefficient are shown in Figs 7.8 to 7.10, respectively. A
500 mm length cavity is assumed. Other parameters used follow those adopted in the TMM-
based laser model as discussed in the previous chapter. These parameters include
1
=
2
¼ 1=3,
avg
L ¼ 2 and CP ¼ 0:46. Due to effects of spatial hole burning, all figures
appear to have a similar trend in the shape of their curves. On the other hand, the single-
mode stability in the DCC þ QWS structure is improved due to the presence of the
distributed coupling coefficient. As shown in Fig. 7.9, the amplitude gain difference between
the lasing mode and that of the þ1 mode remains at a high value even at a high biasing
current.
Figure 7.11 shows the normalised gain margin (ÁL) between the lasing mode and the
most probable side mode. Results obtained from QWS, 3PS and DCC þ QWS structures are
shown. The gain margin of both the QWS and the DCC þ QWS structures reduces when
the biasing current increases. From the above-threshold analysis, these structures are
Figure 7.7 Average detuning coefficient
"
L of the 3PS DFB laser structure versus the normalised
injection current. Results for both the lasing mode and non-lasing side modes (Æ1) are shown.
178
ABOVE-THRESHOLD ANALYSIS OF VARIOUS DFB LASER STRUCTURES
Figure 7.8 Lasing characteristics of the DCC þ QWS DFB laser structure in the ð
"
L;
"
LÞ plane
showing two values of normalised injection current.
Figure 7.9 Average amplitude gain
"
L of the DCC þ QWS DFB laser structure versus the nor-
malised injection current. Results for both the lasing mode and non-lasing side modes (Æ1) are shown.