Tài liệu Memory Dump Analysis Anthology- P7 ppt
Bạn đang xem bản rút gọn của tài liệu. Xem và tải ngay bản đầy đủ của tài liệu tại đây (516.51 KB, 30 trang )
WinDbg Tips and Tricks 181
SUSPENDING THREADS
Suspending threads during live kernel debugging session can be useful for debug-
ging or reproducing race condition issues. For example, when we have one thread that
depends on another thread finishing its work earlier. Sometimes, very rarely the lat-
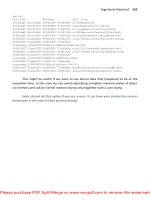
ter thread finishes after the moment the first thread would expect it. In order to
model this race condition we can simply patch the prologue code of the second thread
worker function with ret instruction. This has the same effect as suspending the thread
so it cannot produce the required data.
Note: ~n (suspend) and ~f (freeze) are for user mode live debugging only.
Please purchase PDF Split-Merge on www.verypdf.com to remove this watermark.
182 PART 2: Professional Crash Dump Analysis
HEAP STACK TRACES
If we have user mode stack trace DB enabled on Windows 2003 Server for some
service or application and we get a crash dump and try to get saved stack traces using
!heap extension command we might get these errors:
0:000> !heap -k -h 000a0000
Heap entries for Segment00 in Heap 000a0000
000a0c50: 00c50 . 00040 [01] - busy (40)
000a0c90: 00040 . 01818 [07] - busy (1800), tail fill - unable to
read heap entry extra at 000a24a0
000a24a8: 01818 . 00030 [07] - busy (18), tail fill - unable to
read heap entry extra at 000a24d0
000a24d8: 00030 . 005a0 [07] - busy (588), tail fill - unable to
read heap entry extra at 000a2a70
The solution is to use old Windows 2000 extension ntsdexts.dll:
0:000> !.\w2kfre\ntsdexts.heap -k -h 000a0000
Stack trace (12) at 1021bfc:
7c85fc22: ntdll!RtlAllocateHeapSlowly+0×00000041
7c81d4df: ntdll!RtlAllocateHeap+0×00000E9F
7c83467a: ntdll!LdrpAllocateUnicodeString+0×00000035
7c8354f4: ntdll!LdrpCopyUnicodeString+0×00000031
7c83517b: ntdll!LdrpResolveDllName+0×00000195
7c834b2a: ntdll!LdrpMapDll+0×0000014F
7c837474: ntdll!LdrpLoadImportModule+0×0000017C
7c837368: ntdll!LdrpHandleOneNewFormatImportDescriptor+0×0000004D
7c837317: ntdll!LdrpHandleNewFormatImportDescriptors+0×0000001D
7c837441: ntdll!LdrpWalkImportDescriptor+0×00000195
7c80f560: ntdll!LdrpInitializeProcess+0×00000E3E
7c80ea0b: ntdll!_LdrpInitialize+0×000000D0
7c82ec2d: ntdll!KiUserApcDispatcher+0×00000025
Note. an example on how to enable user mode stack trace DB:
Please purchase PDF Split-Merge on www.verypdf.com to remove this watermark.
WinDbg Tips and Tricks 183
HYPERTEXT COMMANDS
Recent versions of WinDbg have RichEdit command output window that allows
syntax highlighting and can simulate hyperlinks.
Tooltip from WindowHistory shows its window class:
There is also Debugger Markup Language (DML) and new commands that take
advantage of it. For documentation please look at dml.doc located in your Debugging
Tools for Windows folder.
Here is the output of some commands (because WinDbg uses the variant of
RichEdit that doesn’t allow copy/paste formatting I put screenshots of the output):
Please purchase PDF Split-Merge on www.verypdf.com to remove this watermark.
184 PART 2: Professional Crash Dump Analysis
!dml_proc
Here we can click on a process link and get the list of threads:
We can click either on “Full details” link or on an individual thread link to see its
call stack. If we select “user-mode state” link we switch to process context automatically
(useful for complete memory dumps):
kd> .process /p /r 0x8342c128
Implicit process is now 8342c128
Loading User Symbols
Please purchase PDF Split-Merge on www.verypdf.com to remove this watermark.
WinDbg Tips and Tricks 185
We can also navigate frames and local variables very easily:
If we click on a thread name (<No name> here) we get its context:
Clicking on a number sets the scope and shows local variables (if we have full PDB
files):
Similar command is kM:
Please purchase PDF Split-Merge on www.verypdf.com to remove this watermark.
186 PART 2: Professional Crash Dump Analysis
Another useful command is lmD where we can easily inspect modules:
Please purchase PDF Split-Merge on www.verypdf.com to remove this watermark.
WinDbg Tips and Tricks 187
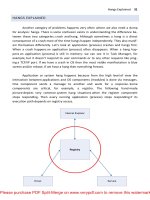
ANALYZING HANGS FASTER
Google search shows that the additional parameter (-hang) to the venerable
!analyze -v command is rarely used. Here is the command we can use if we get a ma-
nually generated dump and there is no exception in it reported by !analyze -v and
subsequent visual inspection of ~*kv output doesn’t show anything suspicious, leading
to hidden exception(s):
!analyze -hang -v
Then we should always double check with !locks command because there could
be multiple hang conditions in a crash dump.
The same parameter can be used for kernel memory dumps too. But double
checking ERESOURCE locks (!locks), kernel threads (!stacks) and DPC queues (!dpcs)
manually is highly recommended.
Please purchase PDF Split-Merge on www.verypdf.com to remove this watermark.
188 PART 2: Professional Crash Dump Analysis
TRIPLE DEREFERENCE
WinDbg commands like dpp allow us to do double dereference in the following
format
pointer *pointer **pointer
For example:
0:000> dpp 004015a2
004015a2 00405068 7c80929c kernel32!GetTickCount
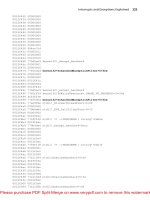
There are cases where we need triple dereference (or even quadruple derefe-
rence) done on a range of memory. Here we can utilize WinDbg scripts. The key is to use
$p pseudo-register which shows the last value of d* commands (dd, dps, etc):
.for (r $t0=00000000`004015a2, $t1=4; @$t1 >= 0; r $t1=$t1-1,
$t0=$t0+$ptrsize) { dps @$t0 l1; dps $p l1; dps $p l1; .printf "\n" }
where $t0 and $t1 are pseudo-registers holding the starting address of a memory block
(we use 64-bit format) and the number of objects to be triple dereferenced and dis-
played. $ptrsize is a pointer size. The script is platform independent (can be used on
both 32-bit and 64-bit target). For example:
004015a2 00405068 component!_imp__GetTickCount
00405068 7c80929c kernel32!GetTickCount
7c80929c fe0000ba
004015a6 458df033
458df033 ????????
458df033 ????????
004015aa 15ff50f0
15ff50f0 ????????
15ff50f0 ????????
004015ae 00405064 component!_imp__QueryPerformanceCounter
00405064 7c80a427 kernel32!QueryPerformanceCounter
7c80a427 8b55ff8b
004015b2 33f4458b
33f4458b ????????
33f4458b ????????
Please purchase PDF Split-Merge on www.verypdf.com to remove this watermark.
WinDbg Tips and Tricks 189
If we want quadruple dereferenced memory we just need to add the additional
dps @$t0 l1; to .for loop body. With this script even double dereference looks much
better because it shows symbol information for the first dereference too whereas dpp
command shows symbol name only for the second dereference.
Another less “elegant” variation without $p pseudo-register uses poi operator
but we need a .catch block to prevent the script termination on invalid memory access:
0:000> .for (r $t0=00000000`004015a2, $t1=4; @$t1 >= 0; r $t1=$t1-1,
$t0=$t0+$ptrsize) { .catch { dds $t0 l1; dds poi($t0) l1; dds
poi(poi($t0)) l1; }; .printf "\n" }
004015a2 00405068 component!_imp__GetTickCount
00405068 7c80929c kernel32!GetTickCount
7c80929c fe0000ba
004015a6 458df033
458df033 ????????
Memory access error at ') '
004015aa 15ff50f0
15ff50f0 ????????
Memory access error at ') '
004015ae 00405064 component!_imp__QueryPerformanceCounter
00405064 7c80a427 kernel32!QueryPerformanceCounter
7c80a427 8b55ff8b
004015b2 33f4458b
33f4458b ????????
Memory access error at ') '
We can also use !list extension but more formatting is necessary:
0:000> .for (r $t0=00000000`004015a2, $t1=4; @$t1 >= 0; r $t1=$t1-1,
$t0=$t0+$ptrsize) { .printf "%p:\n--------\n\n", $t0; !list -x "dds
@$extret l1" $t0; .printf "\n" }
004015a2:
---------
004015a2 00405068 component!_imp__GetTickCount
00405068 7c80929c kernel32!GetTickCount
7c80929c fe0000ba
fe0000ba ????????
Cannot read next element at fe0000ba
004015a6:
---------
004015a6 458df033
458df033 ????????
Please purchase PDF Split-Merge on www.verypdf.com to remove this watermark.
190 PART 2: Professional Crash Dump Analysis
Cannot read next element at 458df033
004015aa:
---------
004015aa 15ff50f0
15ff50f0 ????????
Cannot read next element at 15ff50f0
004015ae:
---------
004015ae 00405064 component!_imp__QueryPerformanceCounter
00405064 7c80a427 kernel32!QueryPerformanceCounter
7c80a427 8b55ff8b
8b55ff8b ????????
Cannot read next element at 8b55ff8b
004015b2:
---------
004015b2 33f4458b
33f4458b ????????
Cannot read next element at 33f4458b
The advantage of !list is in unlimited number of pointer dereferences until invalid
address is reached.
Please purchase PDF Split-Merge on www.verypdf.com to remove this watermark.
WinDbg Tips and Tricks 191
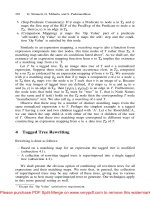
FINDING A NEEDLE IN A HAY
There is a good WinDbg command to list unique threads in a process. Some
processes have so many threads that it is difficult to find anomalies in the output of
~*kv command especially when most threads are similar like waiting for LPC reply. In
this case we can use !uniqstack command to list only threads with unique call stacks and
then list duplicate thread numbers.
0:046> !uniqstack
Processing 51 threads, please wait
. 0 Id: 1d50.1dc0 Suspend: 1 Teb: 7fffe000 Unfrozen
Priority: 0 Priority class: 32
ChildEBP RetAddr
0012fbcc 7c821b84 ntdll!KiFastSystemCallRet
0012fbd0 77e4189f ntdll!NtReadFile+0xc
0012fc38 77f795ab kernel32!ReadFile+0×16c
0012fc64 77f7943c ADVAPI32!ScGetPipeInput+0×2a
0012fcd8 77f796c1 ADVAPI32!ScDispatcherLoop+0×51
0012ff3c 004018fb ADVAPI32!StartServiceCtrlDispatcherW+0xe3
…
…
…
. 26 Id: 1d50.44ec Suspend: 1 Teb: 7ffaf000 Unfrozen
Priority: 1 Priority class: 32
ChildEBP RetAddr
0752fea0 7c822124 ntdll!KiFastSystemCallRet
0752fea4 77e6bad8 ntdll!NtWaitForSingleObject+0xc
0752ff14 77e6ba42 kernel32!WaitForSingleObjectEx+0xac
0752ff28 1b00999e kernel32!WaitForSingleObject+0×12
0752ff34 1b009966 msjet40!Semaphore::Wait+0xe
0752ff5c 1b00358c msjet40!Queue::GetMessageW+0xc9
0752ffb8 77e6608b msjet40!System::WorkerThread+0×41
0752ffec 00000000 kernel32!BaseThreadStart+0×34
…
…
…
Total threads: 51
Duplicate callstacks: 31 (windbg thread #s follow):
3, 4, 5, 7, 8, 9, 10, 11, 12, 13, 14, 15, 16, 17, 19, 21, 22, 23, 27, 28,
29, 33, 39, 40, 41, 42, 43, 44, 47, 49, 50
Please purchase PDF Split-Merge on www.verypdf.com to remove this watermark.
192 PART 2: Professional Crash Dump Analysis
0:046> ~49kL
ChildEBP RetAddr
0c58fe18 7c821c54 ntdll!KiFastSystemCallRet
0c58fe1c 77c7538c ntdll!ZwReplyWaitReceivePortEx+0xc
0c58ff84 77c5778f RPCRT4!LRPC_ADDRESS::ReceiveLotsaCalls+0×198
0c58ff8c 77c5f7dd RPCRT4!RecvLotsaCallsWrapper+0xd
0c58ffac 77c5de88 RPCRT4!BaseCachedThreadRoutine+0×9d
0c58ffb8 77e6608b RPCRT4!ThreadStartRoutine+0×1b
0c58ffec 00000000 kernel32!BaseThreadStart+0×34
0:046> ~47kL
ChildEBP RetAddr
0b65fe18 7c821c54 ntdll!KiFastSystemCallRet
0b65fe1c 77c7538c ntdll!ZwReplyWaitReceivePortEx+0xc
0b65ff84 77c5778f RPCRT4!LRPC_ADDRESS::ReceiveLotsaCalls+0×198
0b65ff8c 77c5f7dd RPCRT4!RecvLotsaCallsWrapper+0xd
0b65ffac 77c5de88 RPCRT4!BaseCachedThreadRoutine+0×9d
0b65ffb8 77e6608b RPCRT4!ThreadStartRoutine+0×1b
0b65ffec 00000000 kernel32!BaseThreadStart+0×34
Please purchase PDF Split-Merge on www.verypdf.com to remove this watermark.