Tài liệu SQL Server MVP Deep Dives- P18 ppt
Bạn đang xem bản rút gọn của tài liệu. Xem và tải ngay bản đầy đủ của tài liệu tại đây (1.17 MB, 40 trang )
634
C
HAPTER
50
BI for the relational guy
Terminology
Certain basic terms, many of which are defined differently by different people, are
used in business intelligence. I will submit my definitions, which are based on my
background, to serve as a reference for this chapter.
Data warehouse—Aa relational store of data that serves as a basis for reporting
queries and/or a source for
OLAP
cubes. It consists of tables that support mul-
tiple subject areas in the organization. It is often designed using dimensional
modeling techniques and, in most Microsoft shops, is housed in
SQL
Server.
This term is often interchanged with data mart, and in most cases data mart is
more accurate. Data warehouse just sounds so much more substantial. I tend to
use data warehouse even when referring to a data mart, because it tends to be
used generically to cover both, and so that is the term used throughout this
chapter.
Data mart—Can be thought of as a mini data warehouse that is specific to a par-
ticular subject area. Subject areas tend to align themselves with organizational
departments, such as Sales, Finance, or Human Resources.
Dimensional model—Represents business data in terms of dimensions and facts.
Dimensional models are represented as star or snowflake schema. (The section
“Dimensional modeling” later in this chapter will cover this topic in more
detail.)
Business intelligence (
BI
)—Generally, a process and infrastructure that facilitates
decision-making based on business data.
BI
is too often thought of in technical
terms; it is far more driven by business.
Data mining—The process of discovering valuable trends in historical data that
can provide insight into future events, based on a predetermined set of factors.
A well-known example is on Amazon.com, where books are recommended to
you based on your past buying patterns compared to those of other customers
who have purchased the same books.
ETL
(extract, transform, and load)—The process of moving data from a source sys-
tem, usually online transactional processing (
OLTP
), transforming it into the
data schema represented in the data warehouse, and loading it into data ware-
house tables.
ETL
will usually also initiate cube loading. The transformation
stage can include various processes, such as converting codes, cleansing the
data, and looking up surrogate keys from dimension tables.
OLAP
(online analytical processing)—A process that allows a user to quickly analyze
data using common techniques known as slicing, dicing, and drillthrough. In
the Microsoft world,
OLAP
is provided via Analysis Services cubes.
Licensed to Kerri Ross <>
Please purchase PDF Split-Merge on www.verypdf.com to remove this watermark.
635
Really, what is so different?
Really, what is so different?
If you’ve had any exposure to operational reporting, you’ll already know many of the
differences between reporting systems and traditional
OLTP
systems. Some of the
these are shown in table 1.
The difference is even more fundamental.
OLTP
applications are designed based on a
discreet set of specifications. Specific data is to be collected, and there are clear pat-
terns about who will enter the data, at what point in the business process, and using
what method. The first step to designing a business intelligence solution is to take sev-
eral steps back to understand the business at its core: Why does it exist? What is its mis-
sion? How does the business plan to achieve its mission? What key performance
indicators (
KPI
s) need to be measured to assess success? A business intelligence solu-
tion needs to be able to address not just the needs of today, but those of the future,
and that can only be accomplished by obtaining a core understanding of the underly-
ing business processes.
I remember a past client who had chosen to implement a replicated
OLTP
data
scheme for all of their reporting needs. They were suffering from numerous repercus-
sions of this decision, including tempdb capacity issues, slow query times, and the
inability to scale. When asked why they were not open to discussion about a business
intelligence solution that provided more efficient analysis via
OLAP
cubes, they cited a
prior attempt at a BI application that only addressed the queries for which it was
designed. When the questions (queries) changed, the cube did not contain the infor-
mation necessary to respond, and the whole project was aborted. This is why it is so
critical to model the data warehouse based on the business, not on the specific report-
ing needs of the day.
NOTE
One of the hardest things for a relational
DBA
to come to grips with is the
redundancy involved in data warehousing. It’s disk intensive, to be sure.
Often, a copy of a subset of the data is made for staging prior to loading
the data warehouse, then there is the data warehouse itself, plus the cube
store. This redundancy can be mitigated somewhat in the data warehouse
design, but it’s best to come to terms with the idea of redundancy as soon
as possible. One exciting benefit is the potential to archive data from the
operational system as it is loaded into the data warehouse, making the
OLTP
system more lean.
Table 1 OLTP versus reporting environment characteristics
OLTP Reporting
Queries Few rows (1–50) Many rows (millions, billions, or more)
Indexes Few Many
Query volume Medium to high Low
Updates Small, frequent, dynamic Large, infrequent, scheduled
Licensed to Kerri Ross <>
Please purchase PDF Split-Merge on www.verypdf.com to remove this watermark.
636
C
HAPTER
50
BI for the relational guy
Approach
The following is a high-level view of how a business intelligence project should be
approached. This is intended to provide an overview to contrast with the approach
taken in typical
OLTP
development projects.
1
Determine overall strategy—The general approach to a business solution is to
develop an overall strategy to the data warehouse, determining how depart-
ments interact with each other and developing a high-level plan for how each
subject area will be built out. In practice, I find that most companies skip this
step. Departments in an organization tend to vary in their readiness for data
warehousing, and cooperation from all departments is critical for making this
step possible.
2
Address a subject area—Each subject area should be addressed in great detail,
fleshing out the relevant dimensions and developing one or more star schemas
to represent the business segment. This is done by conducting interviews with
business subject-matter experts.
TIP
One common pitfall I have found is clients insisting that the
IT
staff
knows all there is to know about the business. It is true that they are inti-
mate with the business rules that underlie the technology solutions that
run much of the business, but that should not be confused with a core
understanding of the business, including insights into where the business
is heading.
IT
personnel are a valuable resource for knowing where data
is housed and how to best get it into the data warehouse. The data model
should be based on interviews with stakeholders within the departments
represented in the subject area.
3
Develop the dimensional model—Developing a dimensional model that represents
the business based on the information gathered in the preceding step is para-
mount in a successful business intelligence solution. It’s important to get this
step right. An indication of a well-designed model is its ability to accommodate
changes easily.
4
Extract, transform, and load—When the dimensional model has been established,
it is time to determine data sourcing, or how to best populate the model. ETL
processes need to be designed to accommodate the initial loading of the data
warehouse, as well as ongoing incremental loads, which will, hopefully, be able
to isolate new data in the source system from data that has been previously
loaded.
5
Develop the cube—Cube design usually closely follows the dimensional design,
which is one reason for the focus on the dimensional design. Analysis Services
provides easy mechanisms for understanding the dimensional model and build-
ing dimensions and measure groups.
The remaining steps involve data validation, the automation of remaining processes,
and more. This is a simplified, high-level description of the approach to building a
Licensed to Kerri Ross <>
Please purchase PDF Split-Merge on www.verypdf.com to remove this watermark.
637
Dimensional modeling
business intelligence solution. For more information, the best text I have found on
the topic is The Data Warehouse Lifecycle Toolkit by Ralph Kimball and others (Wiley Pub-
lishing, 2008). Note that this book will only take you through the implementation of
the relational data warehouse. For information regarding the implementation of
Analysis Services cubes, as well as other things to consider when using the Kimball
approach in a Microsoft BI implementation, check out The Microsoft Data Warehouse
Toolkit by Joy Mundy and Warren Thornthwaite (Wiley Publishing, 2006).
Dimensional modeling
I’d like to spend some more time on dimensional modeling, because it is core to the
implementation of a quality data warehouse. It can also be difficult to grasp for those
used to modeling tables in third normal form. Why build a dimensional model in the
first place? What’s wrong with duplicating the source tables?
First of all, end users have a difficult time navigating tables in third normal form. A
normalized model is intended to support the fast and accurate input of data, with
minimal redundancy.
OLTP
table and column names are usually cryptic, and several
tables may have to be joined together in order to create a query. The application has
also built-in cryptic business rules that a user would have to know about, such as
WHERE
ActiveInd
=
'A'
, or
WHERE
EntityCode
=
'XYZ'
. Dimensional models make more
sense to users because they more closely match how they view the business. They pro-
vide a flexible means of accessing the data. On top of all that, dimensional designs
respond more quickly to queries that span large amounts of data.
SQL
Server often
recognizes star schemas and optimizes accordingly.
Dimensional models are implemented as star or snowflake schemas. I will only
address the star schema, because the snowflake schema can be considered a variation
on the star schema. A star schema consists of from one to many dimensions (one
dimension would be highly unlikely) that are related to a single fact table. The dimen-
sions represent ways of looking at the data—the who, what, where, when, and why. The
fact table has implicit foreign keys to each of these dimensions, as well as a collection
of facts that are numerical. For example, a fact table may represent sales in terms of
amount, quantity, tax, discount, and so on. The numbers in a fact table can then be
aggregated, usually summed, across aspects of the dimensions to answer queries about
what has happened in the past.
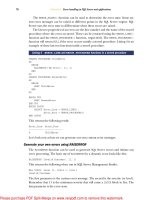
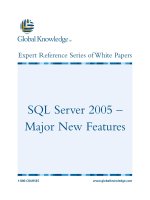
Let’s take an example of a star schema that represents retail sales. The dimensions
would be things like customer (who), product (what), sales territory (where), date
(when), and promotion (why). The star schema might look something like figure 2.
An important thing to note is that the fact table joins to the dimension tables on
surrogate keys, which are usually
IDENTITY
columns in
SQL
Server, intended to
abstract the row from the business key. Always use surrogate keys (except on the Date
dimension), even if you don’t think you need one right now. Surrogate keys are useful
in slowly changing dimensions and when a dimension spans multiple entities, each of
which may assign distinct business keys. For example, Human Resources may use one
Licensed to Kerri Ross <>
Please purchase PDF Split-Merge on www.verypdf.com to remove this watermark.
638
C
HAPTER
50
BI for the relational guy
key for an employee, such as a social security number, and a Sales system may assign its
own business key to an employee. Using a surrogate key will tie the two together across
applications, facilitating richer analysis.
TIP
Even if you are developing a dimensional model that currently supports a
single department in the organization, be sure to keep the entire organi-
zation in mind to facilitate future enhancements. Shared, or conformed,
dimensions facilitate analysis across departmental fact tables. For exam-
ple, an Employee dimension might include employee salary, manager,
and hire dates (Human Resource information) as well as sales region
assignments (Sales information). Storing both sets of data enables the
analysis of hiring programs and manager-mentoring effectiveness on
sales performance.
Cubes, anyone?
You could stop after creating the data warehouse. Some do. Analysis Services, or any
OLAP
technology, requires a new skill set to develop and maintain cubes. But a cube
solution vastly improves the analytical and usability factor in the resulting solution.
Figure 2 A star schema
Licensed to Kerri Ross <>
Please purchase PDF Split-Merge on www.verypdf.com to remove this watermark.
639
Cubes, anyone?
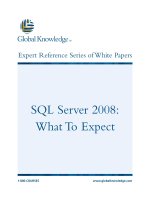
Users no longer have to know how to write
T-SQL
or be constrained by static reports.
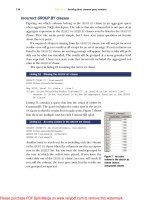
There are also a number of tools that consume
OLAP
data sources—Excel (shown in
figure 3), PerformancePoint, Reporting Services, and Panorama, just to name a few.
And the query response speed can go from many minutes (or hours) for a
SQL
query
to seconds from a cube. The power of online analysis is the ability to quickly ask a
question, get an answer, and then ask another question based on the first result.
Analysis Services cubes are specifically designed to retrieve thousands or millions
of data points and aggregate them quickly. Some of this performance is accomplished
through aggregations, which precalculate the data at predefined intersections of
dimensions. Think of it as building several indexed views to provide summarized
information in
SQL
Server. The difference in query time often differs in orders of
magnitude.
There is a common misconception regarding where cube data is stored. Cubes
have their own separate data store in addition to the data warehouse. This can be
greatly minimized using
ROLAP
(relational
OLAP
) partitions, but this is universally
considered a bad idea except for small real-time partitions, due to performance.
MOLAP
(multidimensional
OLAP
) is the preferred storage option, which results in a
redundant data store that is specifically tuned for
OLAP
query performance. Cube
processing is the activity that loads data into the cube from the data source.
Figure 3 MS Excel 2007 Pivot Table sourcing Analysis Services cube
Licensed to Kerri Ross <>
Please purchase PDF Split-Merge on www.verypdf.com to remove this watermark.
640
C
HAPTER
50
BI for the relational guy
Resist cutting corners in regard to storing data in the data warehouse. It might be
tempting to prune data from the data warehouse once it is contained in the cube, but
this would remove your ability to reprocess the associated cube partitions, and that
data would eventually be lost, because cubes must be reprocessed if associated dimen-
sion structures change. Again, the relational
DBA
approach is all about economizing
on disk usage, but that mindset is at odds with the data warehouse implementation.
Microsoft BI stack
Microsoft provides all the tools required to implement a business intelligence solu-
tion, from the relational data warehouse store to the front-end analytics.
Microsoft’s initial approach was to provide only the back-end tools, up to the deliv-
ery of
OLAP
cubes. They relied upon partners, such as Proclarity and Panorama, to
deliver the front-end functionality. Over the last few years, Microsoft has completed
the stack with the development of Business Scorecard Manager and the acquisition of
Proclarity. Both of these products are now released in a single product called Perfor-
mancePoint.
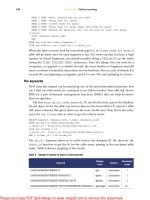
The Microsoft
BI
stack is represented in figure 4.
How do I get started?
This chapter was intended to give you a basic introduction to business intelligence
and to explain why it differs so dramatically from the traditional
OLTP
approach.
From here, my best recommendation is to start the way I started, with a book I cannot
recommend enough: The Data Warehouse Lifecycle Toolkit by Ralph Kimball and others.
One of the things that I like about it is that it not only explains the what, but it also
explains the why. I occasionally deviate from the approaches recommended in the
book, but only after reading the why to be sure there was nothing I was missing. This
book is not technical; it is more specific to the methodology, which is what is most
Figure 4 The Microsoft BI stack
Licensed to Kerri Ross <>
Please purchase PDF Split-Merge on www.verypdf.com to remove this watermark.
641
Summary
lacking in technicians coming from an
OLTP
environment. It does contain some great
information on dimensional modeling, including techniques for handling common
scenarios that arise when trying to represent business data in a dimensional model.
It is difficult to make a universal recommendation about how to get your feet wet.
One option is to develop your own cube to represent a solution to a problem. One of
my favorite projects was to build a cube to analyze how disk space was being used on my
computer. I have a difficult time identifying files that are duplicated in several folders,
and building such a cube helped me identify where most of my space was going (I
freed up about 30 percent of my disk space based on this analysis!). Another imple-
mentation could analyze server resource consumption. In fact, such a solution is avail-
able for download as a PerformancePoint sample (see “Scorecards and Dashboards for
your
IT
Department” at />aspx?id=tab1), so you can validate your approach.
If there is a data warehouse project in development or already implemented at
your company, you may be able to find a way to become a team member and learn
from other practitioners with more experience. And there are courses available from
the major training vendors to get you started.
Summary
I hope you have gained some insight into the various aspects of business intelligence
and learned how it differs from legacy
OLTP
applications. This should give you the
fundamentals, so you can decide if this is something you want to pursue. I have found
business intelligence projects to be some of the most rewarding in my professional
career. Historically,
IT
projects have typically been about getting information entered
into computer systems, so there is no greater reward than to see the excitement on a
business user’s face when they see how easy it can be to make some actionable knowl-
edge out of years of stored data.
About the author
Erin Welker has spent 25 years in information technology
development, management, database administration, and busi-
ness intelligence. She began working with
SQL
Server in ver-
sion 1.11, and Analysis Services,
SSIS
,
DTS
, and Reporting
Services since their inception. Erin has consulted at several
Fortune 500 and other well-known companies, developing
business intelligence solutions with a specialization in perfor-
mance. She loves to share her passion for
SQL
Server and
BI
through authoring and speaking.
Licensed to Kerri Ross <>
Please purchase PDF Split-Merge on www.verypdf.com to remove this watermark.
642
51 Unlocking the secrets of
SQL Server 2008
Reporting Services
William Vaughn
I want to share some of the Reporting Services technology implemented in
SQL
Server 2008—at least those features that make a difference to application develop-
ers. Thanks to your (and my) suggestions, Reporting Services is better this time.
Thankfully, they left in almost all of the good features and added a few more. That
said, there are still a number of things I would like improved—but I’ll get to that.
Yes, there are a few Reporting Services features that are still under development.
These include the real MicrosoftReportViewer control that can process the second-
generation Report Definition Language (RDL) produced by the Reporting Ser-
vices 2008 Report Designers.
Why should developers care
about Reporting Services?
Over the last 35 years I’ve written lots of programs and taught many developers how
to build best practice applications. Many of these programs were simply ways to
present data to ordinary end users or extraordinary corporate executives, so they
could better understand, assimilate, and leverage the information being presented.
Initially these reports were heavily processed and formatted data dumps to paper,
which were often discarded as fast as the systems could print them. Later, reports
were implemented as programs—often as Windows Forms applications, but more
recently they might be based on
ASP
, Windows Presentation Foundation (
WPF
), or
Silverlight platforms. Yes, sometimes developers were forced to use one of the early
Microsoft and third-party Visual Studio report development tools, but after a
period of frustration, some decided it was easier to take up a career in coal mining
than to face the rigors of one of these troublesome reporting paradigms. All that
has changed—mostly due to innovations in Microsoft Reporting Services.
Licensed to Kerri Ross <>
Please purchase PDF Split-Merge on www.verypdf.com to remove this watermark.
643
What is Reporting Services?
Let’s get started with an overview of Reporting Services in terms that anyone can
understand. Later on I’ll show how Visual Studio in one of its many manifestations
can serve as a powerful tool to create your reports, get them deployed to the Report-
ing Services server, or include them in your
ASP
, Windows Forms, or other projects.
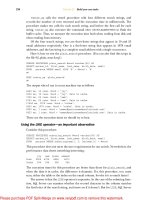
What is Reporting Services?
Reporting Services is just that: a service that runs (starting with
SQL
Server 2008) as a
self-hosted service on a network server, as illustrated in figure 1. The
SQL
Server 2000
and 2005 versions of Reporting Services run as a web service hosted by Internet Infor-
mation Services (
IIS
).
NOTE
It’s best if Reporting Services runs on a dedicated system because in high-
stress production environments it can consume considerable resources
that can hobble the performance of a
DBMS
engine sharing the same
resources.
When a report is deployed to a Reporting Services service instance, its
RDL
file is com-
pressed into a binary large object (
BLOB
) and stored in the
SQL
Server Reporting Ser-
vices Catalog, where it waits to be rendered by a
SOAP
request from your application,
the Report Manager, SharePoint Services, or by referencing the right
URL
.
Now let’s look more closely at the Report Server. Reporting Services processes
requests for reports as follows:
The Report Server extracts the
RDL
by virtual directory path and name from the
SQL
Server Reporting Services report catalog. It’s then decompressed (and
decrypted) and passed to the Report Processor.
The Report Processor works like a language interpreter—the
RDL
is the script that
drives its operations. Its job begins by extracting the connection strings from
Figure 1 SQL Server
Reporting Services
architecture
Licensed to Kerri Ross <>
Please purchase PDF Split-Merge on www.verypdf.com to remove this watermark.
644
C
HAPTER
51
Unlocking the secrets of SQL Server 2008 Reporting Services
the
SQL
Server report catalog tables and passing them, along with the queries
and report parameters to the Data Processing Extension. Yes, a report can refer-
ence many data sources and can contain many queries—some of which might
require input parameters.
The Data Processing Extension opens the connection(s), passing in the appropri-
ate credentials, and executes the report queries using any parameters specified
in the
RDL
. Yes, the
SELECT
statements used to fetch report data or to populate
parameter pick-lists are imbedded in the report
RDL
. The Report Processor sub-
sequently merges data from the named columns extracted from the query row-
sets with the
RDL
-defined report elements and passes the results to the Report
Rendering extension.
The Report Rendering extension works like a printer but with a number of specifi-
cally targeted output devices; the default is
HTML
so reports can be shown in
Internet Explorer. (No, Reporting Services reports don’t render consistently in
Firefox or Chrome browsers.) In addition, in
SQL
Server 2008 the Report Ren-
dering extension can also output the report to
,
TIFF
, Excel,
CSV
, and to
Windows Word as well.
When an application or a user requests a report, the
RDL
might require the user or
the Report Processor to supply the values for one or more report parameters. These
parameters are often used to focus the report data on a specific subset or set display
options as managed by
RDL
-resident expressions. Capturing parameters requires
Reporting Services to render appropriate dialog boxes in the browser to capture these
parameters as shown in figure 2.
NOTE
When starting the Report Manager for the first time (or after a period of
inactivity), be prepared for a wait. It can take 30 to 90 seconds to get the
Reporting Services functionality compiled and to render the initial menu
of available reports.
Figure 2 Report parameters as
generated by the Report Processor
Licensed to Kerri Ross <>
Please purchase PDF Split-Merge on www.verypdf.com to remove this watermark.
645
Using Visual Studio to create an RDL report
As I discuss later, when you set up your report with the Visual Studio Business Intelli-
gence (BI) tools, you can specify as many query and report parameters as needed, as
well as default values to use in place of user-provided values. After all required param-
eters are supplied, the user can click the View Report button to render the
report—and repeat this as many times as needed. It’s up to your code to make that
process efficient—in some cases, the Report Processor might not need to re-run the
query which can save considerable time.
Using Visual Studio to create an RDL report
SQL
Server Reporting Services is available with all editions of
SQL
Server including the
SQL
Server 2008 Express with Advanced Services edition. Included with
SQL
Server is
a version of Visual Studio used to create
CLR
executables and Reporting Services
reports (among other tasks). I’ll use this pared down business intelligence develop-
ment toolkit to create, preview, and deploy a sample report. If you have any version of
Visual Studio above Express, you’ll be able to create and preview reports as well—even
without Reporting Services, but I’ll talk about that option a bit later.
NOTE
SQL
Server Compact editions do not support Reporting Services. For
more info, see http:
//www.microsoft.com/express/sql/download/
default.aspx.
Setting up Reporting Services is an important step but we don’t have enough room to
devote a dozen pages to this process. Thankfully, it’s easier than ever, so I don’t antici-
pate that you’ll have significant problems.
In this example, I’ll be using Visual Studio 2008
SP1
that includes the ability to cre-
ate Reporting Services reports. Nope, without
SP1
, you won’t be able to do so, as
SP1
activates all of the Reporting Services
BI
functionality. In Visual Studio 2005 you could
build, test, and deploy reports. However, you can’t open Visual Studio 2005
BI
report
projects in Visual Studio 2008 without
SP1
.
So follow along and I’ll walk you through the process of creating your own report.
Relax, it will be fun—I promise.
1
Start Visual Studio 2008 (
SP1
) and choose New Project.
2
Choose Business Intelligence Projects from the New Project dialog box.
3
Choose Report Server Project Wizard. This launches a wizard that I expect
you’ll use once. After that you’ll reuse the
RDL
file it generates to create other
reports.
4
Before clicking
OK
, point to an appropriate project save path and name the
project. I’m calling mine
SQL
Bible Report. Click
OK
.
5
After the initial Welcome screen (where you clicked Next) you’re ready to start
defining where the data for your report is sourced. Sure, the data can come
from anywhere—anywhere that can be seen with a .
NET
provider including the
object linking and embedding (
OLE
)
DB
and Open Database Connectivity
(
ODBC
). This means data can come from
SQL
Server, Analysis Services,
SAP
,
Licensed to Kerri Ross <>
Please purchase PDF Split-Merge on www.verypdf.com to remove this watermark.
646
C
HAPTER
51
Unlocking the secrets of SQL Server 2008 Reporting Services
Oracle, a flat file, a third-party database visible with a custom
ODBC
driver or
OLE
DB
provider, or even a
JET
/Access database.
6
Name your data source so you’ll recognize it later. No, I don’t recommend
DataSource1. Next, choose the Type from the drop-down list. I chose
SQL
Server.
7
Fill in the Connection string by clicking on the Edit… button or type it in your-
self if you’re sure how to code it. I’m connecting to AdventureWorks2008.
8
Set the Credentials default to the Security Support Provider Interface (
SSPI
),
which is fine for development. Peter (my coauthor of Hitchhiker’s Guide to
SQL
Server 2000 Reporting Services) and I do not recommend using trusted authentica-
tion for production reports for many good reasons.
9
If you plan to have several reports in the Visual Studio project that use the same
ConnectionString, go ahead and click Make This a Shared Data Source.
Remember, the data source name you use here might be shared by other
reports in other projects so check with your report
DBA
.
10
Click Next to open the Report Wizard’s Design the Query dialog box. Enter the
data source–specific
SQL
to return the rowset (just one) used to populate your
report or click the Query Builder to get the wizard to help build it. This
launches the ever-familiar Query Designer we’ve used for years. However, this
time you’re creating a report, not an updatable TableAdapter. This means you
might not need nearly all of the columns or even the Primary Key columns.
NOTE
To make your report run faster and keep your
DBA
happy, be
sure to choose only the columns needed and include a
WHERE
clause in your query to focus the rowset on only the data needed
by the report.
11
For my report, I chose a few columns from the AdventureWorks2008 Produc-
tion.Products table. I also set up a
WHERE
clause that returns rows where the
SellStartDate
is between a given range of dates as shown in figure 3.
12
After the query is done, click Next to proceed to the report layout dialog boxes.
These give you the option to specify a Tabular or Matrix report.
Figure 3 Specifying
the report query with
a
WHERE
clause
Licensed to Kerri Ross <>
Please purchase PDF Split-Merge on www.verypdf.com to remove this watermark.
647
Using Visual Studio to create an RDL report
13
Click Next to specify which column values are to be used to specify report page
and group breaks as shown in figure 4. Note that I chose not to include the
Weight in this report. This means the query will fetch data that’s not
needed—not a good idea. Click Next to continue.
14
Choose the Table layout mode (stepped or blocked) and whether you want sub-
totals. Click Next to continue.
15
Choose the Table style (the color used as accents in the report) and click Next.
16
Stop. This is a critical point and if you don’t get this right, nothing will work
correctly. For some reason, the wizard has not detected that I installed a named
instance during
SQL
Server setup and chose to use
SSL
web traffic encryption.
This means you must change the Report Server path in the Choose the Deploy-
ment Location dialog box to point to the correct Reporting Services instance.
In my case, I installed
SQL
Server 2008 on my
BETAV1
system with the instance
name of
SS2K8
. Note that the virtual directory (
VD
) is named ReportServer (the
default
VD
name) followed by an underscore and the instance name as follows:
BETAV1
/ReportServer_
SS2K8
.
But before you jump in and change the Report server name, I suggest you
see how Reporting Services Setup initialized the virtual directory name by
Figure 4 Specifying the report page, group breaks, and detail elements
Licensed to Kerri Ross <>
Please purchase PDF Split-Merge on www.verypdf.com to remove this watermark.
648
C
HAPTER
51
Unlocking the secrets of SQL Server 2008 Reporting Services
starting the
SQL
Server 2008 Reporting Services Configuration tool. Log into
your Reporting Services instance and choose the Web Service
URL
tab (on the
left). If the Report Server virtual directory is properly installed, it will provide
the Report Server Web Service
URL
s at the bottom of the dialog box as shown in
figure 5.
NOTE
These settings are dependent on whether or not you had a proper
SSL
certificate in place when Reporting Services was installed. In
my case, I created a certificate for
BETAV1
beforehand. Notice that
the Reporting Services configuration tool can also see my laptop’s
Reporting Services installation. You can click on these
URL
s to test
if Reporting Services is running properly and to be taken to the
Report Server virtual directory.
Yes, you’ll need to change the Report Server name
URL
each and every time
you create a report from the Wizard. No, you won’t want to run the wizard
again. In most cases you’ll leverage existing reports and report projects where
these settings are maintained.
We’re almost ready to move forward, but before we do, consider the name of
the deployment folder—this is where Visual Studio will deploy the report. Con-
sider that anyone with access to an explorer might be able to see your Report-
ing Services Virtual Directory (
VD
) and the Report Manager, so as you start
creating reports, others will be able to see your unfinished reports as you learn
to use Reporting Services.
You can deal with this problem in a couple of ways. First, you should work
with Report Manager and your
DBA
to prevent access to reports under develop-
ment. Next, it makes sense to create a directory to place the work in progress
reports, and use rights management to hide these from casual viewers. This
makes sure that unauthorized people don’t run reports they shouldn’t. More
importantly, it prevents people from bringing the system to its knees by running
reports that consume all of the available resources or those that are not ready
for use.
17
Now we’re ready to click Next, which brings us to the last dialog box. Here you
can name the report, view the Report Summary, and choose to preview the
report after the wizard is done. Name the report, check the Preview checkbox,
and click Finish.
WARNING
After you click Finish, you’re done. You won’t be able to rerun the wiz-
ard to alter the report later.
ReportServer Web Service URLs
http://BETAV1:80/ReportServer SS2K8
https://betav61:443/ReportServer SS...
https://betav1:443/ReprotServer SS2...
URLs:
Figure 5 Reporting Services
Configuration Manager Web
Service URLs report
Licensed to Kerri Ross <>
Please purchase PDF Split-Merge on www.verypdf.com to remove this watermark.
649
Using the Visual Studio 2008 Report Designer
18
At this point you’re taken back to Visual Studio where your report layout is
shown in the Design Window, the Report Data window is exposed, and the
(report) Preview tab is exposed. You are ready to execute the report and render
it locally (as shown in figure 6).
No, you don’t need to have Reporting Services up and running at this point—that
won’t be necessary until you’re ready to deploy the report.
Sure, the Visual Studio
BI
tools include a Report Designer that helps developers
(or trained end users) build reports by hand. No, this does not involve setting type
and getting ink all over your clothes (been there, done that). It means working with a
drag-and-drop paradigm to add appropriate report control elements to a report and
drag columns from pre-built
DataSet
objects exposed in the Report Data window.
Using the Visual Studio 2008 Report Designer
If you’re familiar with
SQL
Server 2005 Reporting Services, you’ll see a number of
important differences in the Visual Studio 2008 BI toolset. Note that there is no Data
tab—it’s been replaced by the far more sophisticated Report Data window, which is
used to manage Built-in Fields (something new for Reporting Services 2008), Parame-
ters, Images, and the data sources created for the report. Sure, you can pull in data
from any number of data sources for a single report. There are other changes as well
like the incorporation of the Tablix report element that combines functionality of the
Table and Matrix report elements. This permits you to group by rows and columns as
well as manage RichText data in your reports.
Figure 6 Visual Studio BI project with the newly generated report
Licensed to Kerri Ross <>
Please purchase PDF Split-Merge on www.verypdf.com to remove this watermark.