Chapter 4 Introduction to Portfolio Theory
Bạn đang xem bản rút gọn của tài liệu. Xem và tải ngay bản đầy đủ của tài liệu tại đây (268.63 KB, 19 trang )
Introduction to Financial Econometrics
Chapter 4 Introduction to Portfolio Theory
Eric Zivot
Department of Economics
University of Washington
January 26, 2000
This version: February 20, 2001
1
Introduction to Portfolio Theory
Consider the following investment problem. We can invest in two non-dividend paying
stocks A and B over the next month. Let RA denote monthly return on stock A and
RB denote the monthly return on stock B. These returns are to be treated as random
variables since the returns will not be realized until the end of the month. We assume
that the returns RA and RB are jointly normally distributed and that we have the
following information about the means, variances and covariances of the probability
distribution of the two returns:
µA = E[RA ], σ 2A = V ar(RA ),
µB = E[RB ], σ 2B = V ar(RB ),
σ AB = Cov(RA , RB ).
We assume that these values are taken as given. We might wonder where such values
come from. One possibility is that they are estimated from historical return data for
the two stocks. Another possibility is that they are subjective guesses.
The expected returns, µA and µB , are our best guesses for the monthly returns on
each of the stocks. However, since the investments are random we must recognize that
the realized returns may be different from our expectations. The variances, σ 2A and
σ 2B , provide measures of the uncertainty associated with these monthly returns. We
can also think of the variances as measuring the risk associated with the investments.
Assets that have returns with high variability (or volatility) are often thought to
be risky and assets with low return volatility are often thought to be safe. The
covariance σ AB gives us information about the direction of any linear dependence
between returns. If σ AB > 0 then the returns on assets A and B tend to move in the
1
same direction; if σ AB < 0 the returns tend to move in opposite directions; if σ AB = 0
then the returns tend to move independently. The strength of the dependence between
the returns is measured by the correlation coefficient ρAB = σσAAB
. If ρAB is close to
σB
one in absolute value then returns mimic each other extremely closely whereas if ρAB
is close to zero then the returns may show very little relationship.
The portfolio problem is set-up as follows. We have a given amount of wealth and
it is assumed that we will exhaust all of our wealth between investments in the two
stocks. The investor s problem is to decide how much wealth to put in asset A and
how much to put in asset B. Let xA denote the share of wealth invested in stock A
and xB denote the share of wealth invested in stock B. Since all wealth is put into
the two investments it follows that xA + xB = 1. (Aside: What does it mean for xA
or xB to be negative numbers?) The investor must choose the values of xA and xB .
Our investment in the two stocks forms a portfolio and the shares xA and xB are
referred to as portfolio shares or weights. The return on the portfolio over the next
month is a random variable and is given by
Rp = xA RA + xB RB ,
(1)
which is just a simple linear combination or weighted average of the random return
variables RA and RB . Since RA and RB are assumed to be normally distributed, Rp
is also normally distributed.
1.1
Portfolio expected return and variance
The return on a portfolio is a random variable and has a probability distribution
that depends on the distributions of the assets in the portfolio. However, we can
easily deduce some of the properties of this distribution by using the following results
concerning linear combinations of random variables:
µp = E[Rp ] = xA µA + xB µB
σ 2p = var(Rp ) = x2A σ 2A + x2B σ 2B + 2xA xB σ AB
(2)
(3)
These results are so important to portfolio theory that it is worthwhile to go
through the derivations. For the &rst result (2), we have
E[Rp ] = E[xA RA + xB RB ] = xA E[RA ] + xB E[RB ] = xA µA + xB µB
by the linearity of the expectation operator. For the second result (3), we have
var(Rp ) =
=
=
=
var(xA RA + xB RB ) = E[(xA RA + xB RB ) − E[xA RA + xB RB ])2 ]
E[(xA (RA − µA ) + xB (RB − µB ))2 ]
E[x2A (RA − µA )2 + x2B (RB − µB )2 + 2xA xB (RA − µA )(RB − µB )]
x2A E[(RA − µA )2 ] + x2B E[(RB − µB )2 ] + 2xA xB E[(RA − µA )(RB − µB )],
2
and the result follows by the de&nitions of var(RA ), var(RB ) and cov(RA , RB )..
Notice that the variance of the portfolio is a weighted average of the variances
of the individual assets plus two times the product of the portfolio weights times
the covariance between the assets. If the portfolio weights are both positive then a
positive covariance will tend to increase the portfolio variance, because both returns
tend to move in the same direction, and a negative covariance will tend to reduce the
portfolio variance. Thus &nding negatively correlated returns can be very bene&cial
when forming portfolios. What is surprising is that a positive covariance can also be
bene&cial to diversi&cation.
1.2
Efficient portfolios with two risky assets
In this section we describe how mean-variance efficient portfolios are constructed.
First we make some assumptions:
Assumptions
• Returns are jointly normally distributed. This implies that means, variances
and covariances of returns completely characterize the joint distribution of returns.
• Investors only care about portfolio expected return and portfolio variance. Investors like portfolios with high expected return but dislike portfolios with high
return variance.
Given the above assumptions we set out to characterize the set of portfolios that
have the highest expected return for a given level of risk as measured by portfolio
variance. These portfolios are called efficient portfolios and are the portfolios that
investors are most interested in holding.
For illustrative purposes we will show calculations using the data in the table
below.
Table 1: Example Data
µA
µB
σ 2B
σA
σB
σ AB
ρAB
0.175 0.055 0.067 0.013 0.258 0.115 -0.004875 -0.164
σ 2A
The collection of all feasible portfolios (the investment possibilities set) in the
case of two assets is simply all possible portfolios that can be formed by varying
the portfolio weights xA and xB such that the weights sum to one (xA + xB = 1).
We summarize the expected return-risk (mean-variance) properties of the feasible
portfolios in a plot with portfolio expected return, µp , on the vertical axis and portfolio
standard-deviation, σ p , on the horizontal axis. The portfolio standard deviation is
used instead of variance because standard deviation is measured in the same units as
the expected value (recall, variance is the average squared deviation from the mean).
3
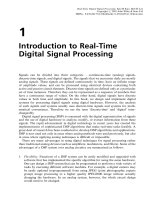
Portfolio Frontier with 2 Risky Assets
Portfolio expected return
0.250
0.200
0.150
0.100
0.050
0.000
0.000
0.100
0.200
0.300
0.400
Portfolio std. deviation
Figure 1
The investment possibilities set or portfolio frontier for the data in Table 1 is
illustrated in Figure 1. Here the portfolio weight on asset A, xA , is varied from
-0.4 to 1.4 in increments of 0.1 and, since xB = 1 − xA , the weight on asset is
then varies from 1.4 to -0.4. This gives us 18 portfolios with weights (xA , xB ) =
(−0.4, 1.4), (−0.3, 1.3), ..., (1.3, −0.3), (1.4, −0.4). For
q each of these portfolios we use
the formulas (2) and (3) to compute µp and σ p = σ 2p . We then plot these values1 .
Notice that the plot in (µp , σ p ) space looks like a parabola turned on its side (in
fact it is one side of a hyperbola). Since investors desire portfolios with the highest
expected return for a given level of risk, combinations that are in the upper left corner
are the best portfolios and those in the lower right corner are the worst. Notice that
the portfolio at the bottom of the parabola has the property that it has the smallest
variance among all feasible portfolios. Accordingly, this portfolio is called the global
minimum variance portfolio.
It is a simple exercise in calculus to &nd the global minimum variance portfolio.
We solve the constrained optimization problem
min σ 2p = x2A σ 2A + x2B σ 2B + 2xA xB σ AB
xA ,xB
s.t. xA + xB = 1.
1
The careful reader may notice that some of the portfolio weights are negative. A negative
portfolio weight indicates that the asset is sold short and the proceeds of the short sale are used to
buy more of the other asset. A short sale occurs when an investor borrows an asset and sells it in
the market. The short sale is closed out when the investor buys back the asset and then returns the
borrowed asset. If the asset price drops then the short sale produces and pro&t.
4
Substituting xB = 1 − xA into the formula for σ 2p reduces the problem to
min
σ 2p = x2A σ 2A + (1 − xA )2 σ 2B + 2xA (1 − xA )σ AB .
x
A
The &rst order conditions for a minimum, via the chain rule, are
0=
dσ 2p
2
min 2
min
= 2xmin
A σ A − 2(1 − xA )σ B + 2σ AB (1 − 2xA )
dxA
and straightforward calculations yield
xmin
A =
σ 2B − σ AB
, xmin = 1 − xmin
A .
σ 2A + σ 2B − 2σ AB B
(4)
min
For our example, using the data in table 1, we get xmin
A = 0.2 and xB = 0.8.
Efficient portfolios are those with the highest expected return for a given level
of risk. Inefficient portfolios are then portfolios such that there is another feasible
portfolio that has the same risk (σ p ) but a higher expected return (µp ). From the
plot it is clear that the inefficient portfolios are the feasible portfolios that lie below
the global minimum variance portfolio and the efficient portfolios are those that lie
above the global minimum variance portfolio.
The shape of the investment possibilities set is very sensitive to the correlation
between assets A and B. If ρAB is close to 1 then the investment set approaches a
straight line connecting the portfolio with all wealth invested in asset B, (xA , xB ) =
(0, 1), to the portfolio with all wealth invested in asset A, (xA , xB ) = (1, 0). This
case is illustrated in Figure 2. As ρAB approaches zero the set starts to bow toward
the µp axis and the power of diversi&cation starts to kick in. If ρAB = −1 then
the set actually touches the µp axis. What this means is that if assets A and B
are perfectly negatively correlated then there exists a portfolio of A and B that has
positive expected return and zero variance! To &nd the portfolio with σ 2p = 0 when
ρAB = −1 we use (4) and the fact that σ AB = ρAB σ A σ B to give
xmin
A =
σB
, xmin = 1 − xA
σA + σB B
The case with ρAB = −1 is also illustrated in Figure 2.
5
Portfolio Frontier with 2 Risky Assets
P ortfolio e x pe cte d re turn
0.250
0.200
0.150
0.100
0.050
0.000
0.000
0.050
0.100
0.150
0.200
0.250
0.300
0.350
0.400
0.450
P ortfolio std. de via tion
correlation=1
correlation=-1
Figure 2
Given the efficient set of portfolios, which portfolio will an investor choose? Of
the efficient portfolios, investors will choose the one that accords with their risk
preferences. Very risk averse investors will choose a portfolio very close to the global
minimum variance portfolio and very risk tolerant investors will choose portfolios
with large amounts of asset A which may involve short-selling asset B.
1.3
Efficient portfolios with a risk-free asset
In the preceding section we constructed the efficient set of portfolios in the absence of
a risk-free asset. Now we consider what happens when we introduce a risk free asset.
In the present context, a risk free asset is equivalent to default-free pure discount bond
that matures at the end of the assumed investment horizon. The risk-free rate, rf , is
then the return on the bond, assuming no in! ation. For example, if the investment
horizon is one month then the risk-free asset is a 30-day Treasury bill (T-bill) and
the risk free rate is the nominal rate of return on the T-bill. If our holdings of the
risk free asset is positive then we are lending money at the risk-free rate and if our
holdings are negative then we are borrowing at the risk-free rate.
1.3.1
Efficient portfolios with one risky asset and one risk free asset
Continuing with our example, consider an investment in asset B and the risk free
asset (henceforth referred to as a T-bill) and suppose that rf = 0.03. Since the risk
free rate is &xed over the investment horizon it has some special properties, namely
µf = E[rf ] = rf
6
var(rf ) = 0
cov(RB , rf ) = 0
Let xB denote the share of wealth in asset B and xf = 1 − xB denote the share of
wealth in T-bills. The portfolio expected return is
Rp = xB RB + (1 − xB )rf
= xB (RB − rf ) + rf
The quantity RB − rf is called the excess return (over the return on T-bills) on asset
B. The portfolio expected return is then
µp = xB (µB − rf ) + rt
where the quantity (µB − rf ) is called the expected excess return or risk premium
on asset B. We may express the risk premium on the portfolio in terms of the risk
premium on asset B:
µp − rf = xB (µB − rf )
The more we invest in asset B the higher the risk premium on the portfolio.
The portfolio variance only depends on the variability of asset B and is given by
σ 2p = x2B σ 2B .
The portfolio standard deviation is therefore proportional to the standard deviation
on asset B:
σ p = xB σ B
which can use to solve for xB
xB =
σp
σB
Using the last result, the feasible (and efficient) set of portfolios follows the equation
µp = rf +
µB − rf
· σp
σB
(5)
µ −r
which is simply straight line in (µp , σ p ) with intercept rf and slope BσB f . The slope
of the combination line between T-bills and a risky asset is called the Sharpe ratio
or Sharpe s slope and it measures the risk premium on the asset per unit of risk (as
measured by the standard deviation of the asset).
The portfolios which are combinations of asset A and T-bills and combinations of
asset B and T-bills using the data in Table 1 with rf = 0.03. is illustrated in Figure
4.
7
Portfolio Frontier with 1 Risky Asset and T-Bill
P ortfolio e x pe cte d re turn
0.200
0.180
0.160
0.140
0.120
0.100
0.080
0.060
0.040
0.020
0.000
0.000
0.050
0.100
0.150
0.200
0.250
0.300
Portfolio std. deviation
Asset B and T-Bill
Asset A and T-Bill
Figure 3
Notice that expected return-risk trade off of these portfolios is linear. Also, notice
that the portfolios which are combinations of asset A and T-bills have expected
returns uniformly higher than the portfolios consisting of asset B and T-bills. This
occurs because the Sharpe s slope for asset A is higher than the slope for asset B:
0.175 − 0.03
0.055 − 0.03
µA − rf
µ − rf
=
= 0.562, B
=
= 0.217.
σA
0.258
σB
0.115
Hence, portfolios of asset A and T-bills are efficient relative to portfolios of asset B
and T-bills.
1.3.2
Efficient portfolios with two risky assets and a risk-free asset
Now we expand on the previous results by allowing our investor to form portfolios of
assets A, B and T-bills. The efficient set in this case will still be a straight line in
(µp , σ p )− space with intercept rf . The slope of the efficient set, the maximum Sharpe
ratio, is such that it is tangent to the efficient set constructed just using the two risky
assets A and B. Figure 5 illustrates why this is so.
8
Portfolio expected return
Portfolio Frontier with 2 Risky Assets and T-Bills
0.350
0.300
0.250
0.200
0.150
0.100
0.050
0.000
0.000
0.100
0.200
0.300
0.400
0.500
0.600
Portfolio std. deviation
Assets A and B
Tangency and T-bills
Asset B and T-bills
Asset A and t-bills
Tangency
Asset B
Asset A
Figure 4
µ −r
If we invest in only in asset B and T-bills then the Sharpe ratio is BσB f = 0.217
and the CAL intersects the parabola at point B. This is clearly not the efficient set
of portfolios. For example, we could do uniformly better if we instead invest only
µ −r
in asset A and T-bills. This gives us a Sharpe ratio of AσA f = 0.562 and the new
CAL intersects the parabola at point A. However, we could do better still if we invest
in T-bills and some combination of assets A and B. Geometrically, it is easy to see
that the best we can do is obtained for the combination of assets A and B such that
the CAL is just tangent to the parabola. This point is marked T on the graph and
represents the tangency portfolio of assets A and B.
We can determine the proportions of each asset in the tangency portfolio by &nding
the values of xA and xB that maximize the Sharpe ratio of a portfolio that is on the
envelope of the parabola. Formally, we solve
µp − rf
s.t.
A B
σp
µp = xA µA + xB µB
σ 2p = x2A σ 2A + x2B σ 2B + 2xA xB σ AB
1 = xA + xB
max
x ,x
After various substitutions, the above problem can be reduced to
max
x
A
xA (µA − rf ) + (1 − xA )(µB − rf )
1/2
(x2A σ 2A + (1 − xA )2 σ 2B + 2xA (1 − xA )σ AB )
9
.
This is a straightforward, albeit very tedious, calculus problem and the solution can
be shown to be
(µA − rf )σ 2B − (µB − rf )σ AB
T
, xTB = 1 − xTA .
xA =
2
2
(µA − rf )σ B + (µB − rf )σ A − (µA − rf + µB − rf )σ AB
For the example data using rf = 0.03, we get xTA = 0.542 and xTB = 0.458. The
expected return on the tangency portfolio is
µT = xTA µA + xTB µB
= (0.542)(0.175) + (0.458)(0.055) = 0.110,
the variance of the tangency portfolio is
σ 2T =
³
xTA
´2
³
σ 2A + xTB
´2
σ 2B + 2xTA xTB σ AB
= (0.542)2 (0.067) + (0.458)2 (0.013) + 2(0.542)(0.458) = 0.015,
and the standard deviation of the tangency portfolio is
q
√
σ T = σ 2T = 0.015 = 0.124.
The efficient portfolios now are combinations of the tangency portfolio and the
T-bill. This important result is known as the mutual fund separation theorem. The
tangency portfolio can be considered as a mutual fund of the two risky assets, where
the shares of the two assets in the mutual fund are determined by the tangency
portfolio weights, and the T-bill can be considered as a mutual fund of risk free
assets. The expected return-risk trade-off of these portfolios is given by the line
connecting the risk-free rate to the tangency point on the efficient frontier of risky
asset only portfolios. Which combination of the tangency portfolio and the T-bill
an investor will choose depends on the investor s risk preferences. If the investor is
very risk averse, then she will choose a combination with very little weight in the
tangency portfolio and a lot of weight in the T-bill. This will produce a portfolio
with an expected return close to the risk free rate and a variance that is close to zero.
For example, a highly risk averse investor may choose to put 10% of her wealth in
the tangency portfolio and 90% in the T-bill. Then she will hold (10%) × (54.2%) =
5.42% of her wealth in asset A, (10%) × (45.8%) = 4.58% of her wealth in asset B
and 90% of her wealth in the T-bill. The expected return on this portfolio is
µp = rf + 0.10(µT − rf )
= 0.03 + 0.10(0.110 − 0.03)
= 0.038.
and the standard deviation is
σ p = 0.10σ T
= 0.10(0.124)
= 0.012.
10
A very risk tolerant investor may actually borrow at the risk free rate and use these
funds to leverage her investment in the tangency portfolio. For example, suppose the
risk tolerant investor borrows 10% of her wealth at the risk free rate and uses the
proceed to purchase 110% of her wealth in the tangency portfolio. Then she would
hold (110%)×(54.2%) = 59.62% of her wealth in asset A, (110%)×(45.8%) = 50.38%
in asset B and she would owe 10% of her wealth to her lender. The expected return
and standard deviation on this portfolio is
µp = 0.03 + 1.1(0.110 − 0.03) = 0.118
σ p = 1.1(0.124) = 0.136.
2
Efficient Portfolios and Value-at-Risk
As we have seen, efficient portfolios are those portfolios that have the highest expected
return for a given level of risk as measured by portfolio standard deviation. For
portfolios with expected returns above the T-bill rate, efficient portfolios can also be
characterized as those portfolios that have minimum risk (as measured by portfolio
standard deviation) for a given target expected return.
11
Efficient Portfolios
0.250
Efficient portfolios of Tbills and assets A and B
0.200
Asset A
Portfolio ER
0.150
Tangency
Portfolio
0.103
Combinations of tangency portfolio
and T-bills that has the same SD as
asset B
0.100
Asset B
0.055
0.050
rf
0.000
0.000
Combinations of tangency
portfolio and T-bills that has
same ER as asset B
0.039
0.050
0.100
0.114
0.150
0.200
0.250
0.300
0.350
Portfolio SD
Figure 5
To illustrate, consider &gure 5 which shows the portfolio frontier for two risky
assets and the efficient frontier for two risky assets plus a risk-free asset. Suppose
an investor initially holds all of his wealth in asset A. The expected return on this
portfolio is µB = 0.055 and the standard deviation (risk) is σ B = 0.115. An efficient
portfolio (combinations of the tangency portfolio and T-bills) that has the same
standard deviation (risk) as asset B is given by the portfolio on the efficient frontier
that is directly above σ B = 0.115. To &nd the shares in the tangency portfolio and
T-bills in this portfolio recall from (xx) that the standard deviation of a portfolio with
xT invested in the tangency portfolio and 1 − xT invested in T-bills is σ p = xT σ T .
Since we want to &nd the efficient portfolio with σ p = σ B = 0.115, we solve
xT =
σB
0.115
=
= 0.917, xf = 1 − xT = 0.083.
σT
0.124
That is, if we invest 91.7% of our wealth in the tangency portfolio and 8.3% in T-bills
we will have a portfolio with the same standard deviation as asset B. Since this is an
efficient portfolio, the expected return should be higher than the expected return on
12
asset B. Indeed it is since
µp = rf + xT (µT − rf )
= 0.03 + 0.917(0.110 − 0.03)
= 0.103
Notice that by diversifying our holding into assets A, B and T-bills we can obtain a
portfolio with the same risk as asset B but with almost twice the expected return!
Next, consider &nding an efficient portfolio that has the same expected return
as asset B. Visually, this involves &nding the combination of the tangency portfolio and T-bills that corresponds with the intersection of a horizontal line with intercept µB = 0.055 and the line representing efficient combinations of T-bills and
the tangency portfolio. To &nd the shares in the tangency portfolio and T-bills in
this portfolio recall from (xx) that the expected return of a portfolio with xT invested in the tangency portfolio and 1 − xT invested in T-bills has expected return
equal to µp = rf + xT (µT − rf ). Since we want to &nd the efficient portfolio with
µp = µB = 0.055 we use the relation
µp − rf = xT (µT − rF )
and solve for xT and xf = 1 − xT
xT =
µp − rf
0.055 − 0.03
=
= 0.313, xf = 1 − xT = 0.687.
µT − rf
0.110 − 0.03
That is, if we invest 31.3% of wealth in the tangency portfolio and 68.7% of our
wealth in T-bills we have a portfolio with the same expected return as asset B. Since
this is an efficient portfolio, the standard deviation (risk) of this portfolio should be
lower than the standard deviation on asset B. Indeed it is since
σ p = xT σ T
= 0.313(0.124)
= 0.039.
Notice how large the risk reduction is by forming an efficient portfolio. The standard
deviation on the efficient portfolio is almost three times smaller than the standard
deviation of asset B!
The above example illustrates two ways to interpret the bene&ts from forming
efficient portfolios. Starting from some benchmark portfolio, we can &x standard deviation (risk) at the value for the benchmark and then determine the gain in expected
return from forming a diversi&ed portfolio2 . The gain in expected return has concrete
2
The gain in expected return by investing in an efficient portfolio abstracts from the costs associated with selling the benchmark portfolio and buying the efficient portfolio.
13
meaning. Alternatively, we can &x expected return at the value for the benchmark
and then determine the reduction in standard deviation (risk) from forming a diversi&ed portfolio. The meaning to an investor of the reduction in standard deviation
is not as clear as the meaning to an investor of the increase in expected return. It
would be helpful if the risk reduction bene&t can be translated into a number that is
more interpretable than the standard deviation. The concept of Value-at-Risk (VaR)
provides such a translation.
Recall, the VaR of an investment is the expected loss in investment value over a
given horizon with a stated probability. For example, consider an investor who invests
W0 = $100, 000 in asset B over the next year. Assume that RB represents the annual
(continuously compounded) return on asset B and that RB ~N(0.055, (0.114)2 ). The
5% annual VaR of this investment is the loss that would occur if return on asset B is
equal to the 5% left tail quantile of the normal distribution of RB . The 5% quantile,
q0.05 is determined by solving
Pr(RB ≤ q0.05 ) = 0.05.
Using the inverse cdf for a normal random variable with mean 0.055 and standard
deviation 0.114 it can be shown that q0.05 = −0.133.That is, with 5% probability the
return on asset B will be −13.3% or less. If RB = −0.133 then the loss in portfolio
value3 , which is the 5% VaR, is
loss in portfolio value = V aR = |W0 · (eq0.05 − 1)| = |$100, 000(e−0.133 − 1)| = $12, 413.
To reiterate, if the investor hold $100,000 in asset B over the next year then the 5%
VaR on the portfolio is $12, 413. This is the loss that would occur with 5% probability.
Now suppose the investor chooses to hold an efficient portfolio with the same
expected return as asset B. This portfolio consists of 31.3% in the tangency portfolio
and 68.7% in T-bills and has a standard deviation equal to 0.039. Let Rp denote the
annual return on this portfolio and assume that Rp ~N (0.055, 0.039). Using the inverse
cdf for this normal distribution, the 5% quantile can be shown to be q0.05 = −0.009.
That is, with 5% probability the return on the efficient portfolio will be −0.9% or
less. This is considerably smaller than the 5% quantile of the distribution of asset B.
If Rp = −0.009 the loss in portfolio value (5% VaR) is
loss in portfolio value = V aR = |W0 · (eq0.05 − 1)| = |$100, 000(e−0.009 − 1)| = $892.
Notice that the 5% VaR for the efficient portfolio is almost &fteen times smaller than
the 5% VaR of the investment in asset B. Since VaR translates risk into a dollar &gure
it is more interpretable than standard deviation.
3
To compute the VaR we need to convert the continuous compounded return (quantile) to a
simple return (quantile). Recall, if Rct is a continuously compounded return and Rt is a somple
c
return then Rct = ln(1 + Rt ) and Rt = eRt − 1.
14
3
Further Reading
The classic text on portfolio optimization is Markowitz (1954). Good intermediate
level treatments are given in Benninga (2000), Bodie, Kane and Marcus (1999) and
Elton and Gruber (1995). An interesting recent treatment with an emphasis on
statistical properties is Michaud (1998). Many practical results can be found in the
Financial Analysts Journal and the Journal of Portfolio Management. An excellent
overview of value at risk is given in Jorian (1997).
4
Appendix Review of Optimization and Constrained Optimization
Consider the function of a single variable
y = f (x) = x2
which is illustrated in Figure xxx. Clearly the minimum of this function occurs at
the point x = 0. Using calculus, we &nd the minimum by solving
min
y = x2 .
x
The &rst order (necessary) condition for a minimum is
0=
d 2
d
f (x) =
x = 2x
dx
dx
and solving for x gives x = 0. The second order condition for a minimum is
0<
d2
f (x)
dx
and this condition is clearly satis&ed for f (x) = x2 .
Next, consider the function of two variables
y = f(x, z) = x2 + z 2
which is illustrated in Figure xxx.
15
(6)
y = x^2 + z^2
8
7
6
5
y 4
3
2
1.75
1
1
0.25
0
z
-2
2
1.5
1.75
1
0.5
1.25
x
0.75
0
-1.25
0.25
-0.5
-0.25
-1
-0.75
-1.5
-1.25
-2
-1.75
-0.5
Figure 6
This function looks like a salad bowl whose bottom is at x = 0 and z = 0. To &nd
the minimum of (6), we solve
min
y = x2 + z 2
x,z
and the &rst order necessary conditions are
∂y
= 2x
0=
∂x
and
∂y
0=
= 2z.
∂z
Solving these two equations gives x = 0 and z = 0.
Now suppose we want to minimize (6) subject to the linear constraint
x + z = 1.
The minimization problem is now a constrained minimization
y = x2 + z 2 subject to (s.t.)
min
x,z
x+z = 1
16
(7)
and is illustrated in Figure xxx. Given the constraint x + z = 1, the function (6) is
no longer minimized at the point (x, z) = (0, 0) because this point does not satisfy
x + z = 1. The One simple way to solve this problem is to substitute the restriction
(7) into the function (6) and reduce the problem to a minimization over one variable.
To illustrate, use the restriction (7) to solve for z as
z = 1 − x.
(8)
y = f(x, z) = f (x, 1 − x) = x2 + (1 − x)2 .
(9)
Now substitute (7) into (6) giving
The function (9) satis&es the restriction (7) by construction. The constrained minimization problem now becomes
min y = x2 + (1 − x)2 .
x
The &rst order conditions for a minimum are
0=
d 2
(x + (1 − x)2 ) = 2x − 2(1 − x) = 4x − 2
dx
and solving for x gives x = 1/2. To solve for z, use (8) to give z = 1 − (1/2) = 1/2.
Hence, the solution to the constrained minimization problem is (x, z) = (1/2, 1/2).
Another way to solve the constrained minimization is to use the method of Lagrange multipliers. This method augments the function to be minimized with a linear
function of the constraint in homogeneous form. The constraint (7) in homogenous
form is
x+z−1=0
The augmented function to be minimized is called the Lagrangian and is given by
L(x, z, λ) = x2 + z 2 − λ(x + z − 1).
The coefficient on the constraint in homogeneous form, λ, is called the Lagrange
multiplier. It measures the cost, or shadow price, of imposing the constraint relative
to the unconstrained problem. The constrained minimization problem to be solved
is now
min L(x, z, λ) = x2 + z 2 + λ(x + z − 1).
x,z,λ
The &rst order conditions for a minimum are
∂L(x, z, λ)
= 2x + λ
∂x
∂L(x, z, λ)
0 =
= 2z + λ
∂z
∂L(x, z, λ)
0 =
=x+z−1
∂λ
0 =
17
The &rst order conditions give three linear equations in three unknowns. Notice that
the &rst order condition with respect to λ imposes the constraint. The &rst two
conditions give
2x = 2z = −λ
or
x = z.
Substituting x = z into the third condition gives
2z − 1 = 0
or
z = 1/2.
The &nal solution is (x, y, λ) = (1/2, 1/2, −1).
The Lagrange multiplier, λ, measures the marginal cost, in terms of the value of
the objective function, of imposing the constraint. Here, λ = −1 which indicates
that imposing the constraint x + z = 1 reduces the objective function. To understand
the roll of the Lagrange multiplier better, consider imposing the constraint x + z =
0. Notice that the unconstrained minimum achieved at x = 0, z = 0 satis&es this
constraint. Hence, imposing x + z = 0 does not cost anything and so the Lagrange
multiplier associated with this constraint should be zero. To con&rm this, the we
solve the problem
min L(x, z, λ) = x2 + z 2 + λ(x + z − 0).
x,z,λ
The &rst order conditions for a minimum are
∂L(x, z, λ)
= 2x − λ
0 =
∂x
∂L(x, z, λ)
0 =
= 2z − λ
∂z
∂L(x, z, λ)
= x+z
0 =
∂λ
The &rst two conditions give
2x = 2z = −λ
or
x = z.
Substituting x = z into the third condition gives
2z = 0
or
z = 0.
The &nal solution is (x, y, λ) = (0, 0, 0). Notice that the Lagrange multiplier, λ, is
equal to zero in this case.
18
5
Problems
Exercise 1 Consider the problem of investing in two risky assets A and B and a
risk-free asset (T-bill). The optimization problem to &nd the tangency portfolio may
be reduced to
max
xA
xA (µA − rf ) + (1 − xA )(µB − rf )
1/2
(x2A σ 2A + (1 − xA )2 σ 2B + 2xA (1 − xA )σ AB )
where xA is the share of wealth in asset A in the tangency portfolio and xB = 1 − xA
is the share of wealth in asset B in the tangency portfolio. Using simple calculus,
show that
(µA − rf )σ 2B − (µB − rf )σ AB
xA =
.
(µA − rf )σ 2B + (µB − rf )σ 2A − (µA − rf + µB − rf )σ AB
References
[1] Benninga, S. (2000), Financial Modeling, Second Edition. Cambridge, MA: MIT
Press.
[2] Bodie, Kane and Marcus (199x), Investments, xxx Edition.
[3] Elton, E. and G. Gruber (1995). Modern Portfolio Theory and Investment Analysis, Fifth Edition. New York: Wiley.
[4] Jorian, P. (1997). Value at Risk. New York: McGraw-Hill.
[5] Markowitz, H. (1987). Mean-Variance Analysis in Portfolio Choice and Capital
Markets. Cambridge, MA: Basil Blackwell.
[6] Markowitz, H. (1991). Portfolio Selection: Efficient Diversi&cation of Investments. New York: Wiley, 1959; 2nd ed., Cambridge, MA: Basil Blackwell.
[7] Michaud, R.O. (1998). Efficient Asset Management: A Practical Guide to
Stock Portfolio Optimization and Asset Allocation. Boston, MA:Harvard Business
School Press.
19