Tài liệu Language Use and English-Speaking Ability pptx
Bạn đang xem bản rút gọn của tài liệu. Xem và tải ngay bản đầy đủ của tài liệu tại đây (481.16 KB, 11 trang )
The ability to commu-
nicate with govern-
ment and private serv-
ice providers, schools,
businesses, emergency
personnel, and many
other people in the
United States depends
greatly on the ability to
speak English.
1
In
Census 2000, as in the
two previous censuses,
the U.S. Census Bureau
asked people aged 5
and over if they spoke
a language other than
English at home.
Among the 262.4 mil-
lion people aged 5 and
over, 47.0 million
(18 percent) spoke a
language other than
English at home.
This report, part of a series that presents
population and housing data collected in
Census 2000, presents data on language
spoken at home and the ability to speak
English of people aged 5 and over. It
describes population distributions and
characteristics for the United States,
including regions, states, counties, and
selected places with populations of
100,000 or more.
The questions illustrated in Figure 1 were
asked in the census in 1980, 1990, and
2000. Various questions on language
were asked in the censuses from 1890 to
1970, including a question on “mother
tongue” (the language spoken in the per-
son’s home when he or she was a child).
The first language question in Census
2000 asked respondents whether they
spoke a language other than English at
home. Those who responded “Yes” to
Question 11a were asked what language
they spoke. The write-in answers to
Question 11b (specific language spoken)
were optically scanned and coded.
Although linguists recognize several
thousand languages in the world, the
coding operation used by the Census
Bureau put the reported languages into
U S C E N S U S B U R E A U
Helping You Make Informed Decisions
U.S. Department of Commerce
Economics and Statistics Administration
U.S. CENSUS BUREAU
Issued October 2003
C2KBR-29
Language Use and
English-Speaking Ability: 2000
Census 2000 Brief
By
Hyon B. Shin
with
Rosalind Bruno
a. Does this person speak a language other than
English at home?
Yes
No Skip to 12
b. What is this language?
(For example: Korean, Italian, Spanish, Vietnamese)
c. How well does this person speak English?
Very well
Well
Not well
Not at all
Figure 1.
Reproduction of the Questions on
Language From Census 2000
Source: U.S. Census Bureau, Census 2000 questionnaire.
11
1
The text of this report discusses data for the
United States, including the 50 states and the
District of Columbia. Data for the Commonwealth of
Puerto Rico are shown in Table 2 and Figure 5.
2
U.S. Census Bureau
about 380 categories of single lan-
guages or language families.
2
For people who answered “Yes” to
Question 11a, Question 11c asked
respondents to indicate how well
they spoke English. Respondents
who said they spoke English “Very
well” were considered to have no
difficulty with English. Those who
indicated they spoke English “Well,”
“Not well,” or “Not at all” were con-
sidered to have difficulty with
English — identified also as people
who spoke English less than
“Very well.”
The number and percentage
of people in the United States
who spoke a language other
than English at home increased
between 1990 and 2000.
In 2000, 18 percent of the total
population aged 5 and over, or
47.0 million people, reported they
spoke a language other than
English at home.
3
These figures
were up from 14 percent (31.8 mil-
lion) in 1990 and 11 percent
(23.1 million) in 1980. The number
of people who spoke a language
other than English at home grew by
38 percent in the 1980s and by
47 percent in the 1990s. While the
population aged 5 and over grew
by one-fourth from 1980 to 2000,
the number who spoke a language
other than English at home more
than doubled.
In 2000, most people who spoke a
language other than English at
home reported they spoke English
“Very well” (55 percent or
2
More detailed information on languages
and language coding can be found in
“Summary File 3: 2000 Census of Population
and Housing Technical Documentation” issued
December 2002 (www.census.gov/prod
/cen2000/doc/sf3.pdf).
3
The estimates in this report are based on
responses from a sample of the population.
As with all surveys, estimates may vary from
the actual values because of sampling varia-
tion or other factors. All statements made in
this report have undergone statistical testing
and are significant at the 90-percent confi-
dence level unless otherwise noted.
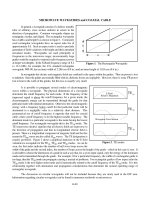
Figure 2.
Speakers of Languages Other Than English at Home
and English Ability by Language Group: 2000
Source: U.S. Census Bureau, Census 2000 Summary File 3.
(Population 5 years and over, in millions. Data based on sample. For
information on confidentiality protection, nonsampling error, sampling
error, and definitions, see www.census.gov/prod/cen2000/doc/sf3.pdf)
Spoke English "Very well"
Spoke English less than "Very well"
All other
languages
Asian and Pacific
Island languages
Other Indo-European
languages
Spanish
14.3
6.6
3.4
13.8
3.4
3.6
1.3 0.6 1.9
28.1
10.0
7.0
Figure 3.
Ten Languages Most Frequently Spoken at Home
Other Than English and Spanish: 2000
1
The number of Vietnamese speakers and the number of Italian speakers were not
statistically different from one another.
Note: The estimates in this figure vary from actual values due to sampling errors. As
a result, the number of speakers of some languages shown in this figure may not be
statistically different from the number of speakers of languages not shown in this figure.
Source: U.S. Census Bureau, Census 2000 Summary File 3.
(Population 5 years and over, in millions. Data based on sample. For
information on confidentiality protection, nonsampling error, sampling
error, and definitions, see www.census.gov/prod/cen2000/doc/sf3.pdf)
Arabic
Polish
Russian
Korean
Italian
1
Vietnamese
1
Tagalog
German
French
Chinese
0.6
2.0
1.6
1.4
1.2
1.0
1.0
0.9
0.7
0.7
25.6 million people). When they
are combined with those who
spoke only English at home,
92 percent of the population aged
5 and over had no difficulty speak-
ing English. The proportion of the
population aged 5 and over who
spoke English less than “Very well”
grew from 4.8 percent in 1980, to
6.1 percent in 1990, and to 8.1
percent in 2000.
In Figure 2, the number of speak-
ers of the four major language
groups (Spanish, Other Indo-
European languages, Asian and
Pacific Island languages, and All
other languages) are shown by
how well they spoke English (see
text box above). Spanish was the
largest of the four major language
groups, and just over half of the
28.1 million Spanish speakers
spoke English “Very well.”
Other Indo-European language
speakers composed the second
largest group, with 10.0 million
speakers, almost two-thirds of
whom spoke English “Very well.”
Slightly less than half of the
7.0 million Asian and Pacific Island-
language speakers spoke English
“Very well” (3.4 million). Of the
1.9 million people who composed
the All other language category,
1.3 million spoke English
“Very well.”
After English and Spanish, Chinese
was the language most commonly
spoken at home (2.0 million speak-
ers), followed by French (1.6 mil-
lion speakers) and German
(1.4 million speakers, see Figure 3).
Reflecting historical patterns of
immigration, the numbers of
Italian, Polish, and German speak-
ers fell between 1990 and 2000,
while the number of speakers of
many other languages increased.
Spanish speakers grew by about
60 percent and Spanish continued to
be the non-English language most
frequently spoken at home in the
United States. The Chinese lan-
guage, however, jumped from the
fifth to the second most widely spo-
ken non-English language, as the
number of Chinese speakers rose
from 1.2 to 2.0 million people (see
Table 1).
4
The number of Viet-
namese speakers doubled over the
decade, from about 507,000 speak-
ers to just over 1 million speakers.
Of the 20 non-English languages
most frequently spoken at home
shown in Table 1, the largest pro-
portional increase was for Russian
speakers, who nearly tripled from
242,000 to 706,000. The second
largest increase was for French
Creole speakers (the language
group that includes Haitian
Creoles), whose numbers more than
doubled from 188,000 to 453,000.
THE GEOGRAPHIC
DISTRIBUTION OF PEOPLE
WHO SPOKE A LANGUAGE
OTHER THAN ENGLISH
AT HOME
This section discusses the geo-
graphic distribution of the popula-
tion aged 5 and over who stated in
Census 2000 that they spoke a lan-
guage other than English at home.
The West had the greatest
number and proportion of non-
English-language speakers.
5
People who spoke languages other
than English at home were not dis-
tributed equally across or within
regions in 2000.
6
While the West
U.S. Census Bureau
3
Four Major Language Groups
Spanish includes those who speak Ladino.
Other Indo-European languages include most languages of
Europe and the Indic languages of India. These include the Germanic
languages, such as German, Yiddish, and Dutch; the Scandinavian
languages, such as Swedish and Norwegian; the Romance languages,
such as French, Italian, and Portuguese; the Slavic languages, such as
Russian, Polish, and Serbo-Croatian; the Indic languages, such as
Hindi, Gujarathi, Punjabi, and Urdu; Celtic languages; Greek; Baltic
languages; and Iranian languages.
Asian and Pacific Island languages include Chinese; Korean;
Japanese; Vietnamese; Hmong; Khmer; Lao; Thai; Tagalog or Pilipino;
the Dravidian languages of India, such as Telegu, Tamil, and
Malayalam; and other languages of Asia and the Pacific, including
the Philippine, Polynesian, and Micronesian languages.
All other languages include Uralic languages, such as Hungarian;
the Semitic languages, such as Arabic and Hebrew; languages of
Africa; native North American languages, including the American
Indian and Alaska native languages; and some indigenous languages
of Central and South America.
4
The changes in ranks between 1990
and 2000 have not been tested and may not
be statistically significant.
5
Hereafter, this report uses the term
“non-English-language speakers” to refer to
people who spoke a language other than
English at home, regardless of their ability to
speak English (see Table 1).
6
The Northeast region includes the states
of Connecticut, Maine, Massachusetts, New
Hampshire, New Jersey, New York,
Pennsylvania, Rhode Island, and Vermont. The
Midwest region includes the states of Illinois,
Indiana, Iowa, Kansas, Michigan, Minnesota,
Missouri, Nebraska, North Dakota, Ohio,
South Dakota, and Wisconsin. The South
region includes the states of Alabama,
Arkansas, Delaware, Florida, Georgia,
Kentucky, Louisiana, Maryland, Mississippi,
North Carolina, Oklahoma, South Carolina,
Tennessee, Texas, Virginia, West Virginia, and
the District of Columbia, a state equivalent.
The West region includes the states of Alaska,
Arizona, California, Colorado, Hawaii, Idaho,
Montana, Nevada, New Mexico, Oregon, Utah,
Washington, and Wyoming.
had only slightly more than
one-fifth of the U.S. population
aged 5 and over, it was home to
more than one-third (37 percent) of
all non-English-language speakers,
the highest proportion of any
region (see Table 2). Within
regions, the proportion who spoke
a non-English language at home
was 29 percent in the West,
20 percent in the Northeast,
15 percent in the South, and only
9 percent in the Midwest.
Reflecting the higher proportion of
speakers of non-English languages
in the West, people in that region
were more likely than those in the
other regions to have difficulty
with English. In 2000, 14 percent
of all people aged 5 and over in
the West spoke English less than
“Very well” — compared with
9 percent in the Northeast, 7 per-
cent in the South, and 4 percent in
the Midwest.
Figure 4 illustrates the prevalence
of the four major non-English-
language groups spoken in each
region. Spanish was spoken more
than any other language group in
all regions. The West and the South
combined had about three times
the number of Spanish speakers
(21.0 million) as the Northeast and
the Midwest combined (7.1 million).
In the Northeast and the Midwest,
Spanish speakers composed slightly
less than half of all non-English-lan-
guage speakers, while in the South
and the West, they represented
around two-thirds (71 percent and
64 percent, respectively), in large
part because of the geographic
proximity to Mexico and other
Spanish-speaking countries.
4
U.S. Census Bureau
Table 1.
Twenty Languages Most Frequently Spoken at Home by English Ability for the
Population 5 Years and Over: 1990 and 2000
(Data based on sample. For information on confidentiality protection, sampling error, nonsampling error, and definitions, see
www.census.gov/prod/cen2000/doc/sf3.pdf)
Language spoken
at home
1990 2000
Rank
Number of
speakers Rank
Number of speakers
Total
English-speaking ability
Very well Well Not well Not at all
United States ...... (X) 230,445,777 (X) 262,375,152 (X) (X) (X) (X)
English only ........... (X) 198,600,798 (X) 215,423,557 (X) (X) (X) (X)
Total non-English ...... (X) 31,844,979 (X) 46,951,595 25,631,188 10,333,556 7,620,719 3,366,132
Spanish ................ 1 17,339,172 1 28,101,052 14,349,796 5,819,408 5,130,400 2,801,448
Chinese ................ 5 1,249,213 2 2,022,143 855,689 595,331 408,597 162,526
French ................. 2 1,702,176 3 1,643,838 1,228,800 269,458 138,002 7,578
German . . .............. 3 1,547,099 4 1,382,613 1,078,997 219,362 79,535 4,719
Tagalog ................ 6 843,251 5 1,224,241 827,559 311,465 79,721 5,496
Vietnamese
1
............ 9 507,069 6 1,009,627 342,594 340,062 270,950 56,021
Italian
1
................. 4 1,308,648 7 1,008,370 701,220 195,901 99,270 11,979
Korean ................. 8 626,478 8 894,063 361,166 268,477 228,392 36,028
Russian ................ 15 241,798 9 706,242 304,891 209,057 148,671 43,623
Polish .................. 7 723,483 10 667,414 387,694 167,233 95,032 17,455
Arabic.................. 13 355,150 11 614,582 403,397 140,057 58,595 12,533
Portuguese
2
............ 10 429,860 12 564,630 320,443 125,464 90,412 28,311
Japanese
2
.............. 11 427,657 13 477,997 241,707 146,613 84,018 5,659
French Creole .......... 19 187,658 14 453,368 245,857 121,913 70,961 14,637
Greek . . . ............... 12 388,260 15 365,436 262,851 65,023 33,346 4,216
Hindi
3
.................. 14 331,484 16 317,057 245,192 51,929 16,682 3,254
Persian ................ 18 201,865 17 312,085 198,041 70,909 32,959 10,176
Urdu
3
.................. (NA) (NA) 18 262,900 180,018 56,736 20,817 5,329
Gujarathi ............... 26 102,418 19 235,988 155,011 50,637 22,522 7,818
Armenian............... 20 149,694 20 202,708 108,554 48,469 31,868 13,817
All other languages . . .... (X) 3,182,546 (X) 4,485,241 2,831,711 1,060,052 479,969 113,509
NA Not available. X Not applicable.
1
In 2000, the number of Vietnamese speakers and the number of Italian speakers were not statistically different from one another.
2
In 1990, the number of Portuguese speakers and the number of Japanese speakers were not statistically different from one another.
3
In 1990, Hindi included those who spoke Urdu.
Note: The estimates in this table vary from actual values due to sampling errors. As a result, the number of speakers of some languages shown in this table
may not be statistically different from the number of speakers of languages not shown in this table.
Source: U.S. Census Bureau, Census 2000 Summary File 3.
U.S. Census Bureau
5
Table 2.
Language Use and English-Speaking Ability for the Population 5 Years and Over for the
United States, Regions, and States and for Puerto Rico: 1990 and 2000
(Data based on sample. For information on confidentiality protection, sampling error, nonsampling error, and definitions, see
www.census.gov/prod/cen2000/doc/sf3.pdf)
Area
1990 2000
Population
5 years
and over
Spoke a
language
other than
English
at home Percent
Population
5 years
and over
Spoke a
language
other than
English
at home Percent
Spoke
English
less than
‘‘Very well’’ Percent
1990
and
2000
percent
change in
‘‘Spoke a
language
other than
English at
home’’
United States .... 230,445,777 31,844,979 13.8 262,375,152 46,951,595 17.9 21,320,407 8.1 47.4
Region
Northeast ............ 47,319,352 7,824,285 16.5 50,224,209 10,057,331 20.0 4,390,538 8.7 28.5
Midwest ............. 55,272,756 3,920,660 7.1 60,054,144 5,623,538 9.4 2,398,120 4.0 43.4
South ............... 79,248,852 8,669,631 10.9 93,431,879 14,007,396 15.0 6,149,756 6.6 61.6
West................ 48,604,817 11,430,403 23.5 58,664,920 17,263,330 29.4 8,381,993 14.3 51.0
State
Alabama............. 3,759,802 107,866 2.9 4,152,278 162,483 3.9 63,917 1.5 50.6
Alaska............... 495,425 60,165 12.1 579,740 82,758 14.3 30,842 5.3 37.6
Arizona .............. 3,374,806 700,287 20.8 4,752,724 1,229,237 25.9 539,937 11.4 75.5
Arkansas ............ 2,186,665 60,781 2.8 2,492,205 123,755 5.0 57,709 2.3 103.6
California ............ 27,383,547 8,619,334 31.5 31,416,629 12,401,756 39.5 6,277,779 20.0 43.9
Colorado............. 3,042,986 320,631 10.5 4,006,285 604,019 15.1 267,504 6.7 88.4
Connecticut .......... 3,060,000 466,175 15.2 3,184,514 583,913 18.3 234,799 7.4 25.3
Delaware ............ 617,720 42,327 6.9 732,378 69,533 9.5 28,380 3.9 64.3
District of Columbia.... 570,284 71,348 12.5 539,658 90,417 16.8 38,236 7.1 26.7
Florida .............. 12,095,284 2,098,315 17.3 15,043,603 3,473,864 23.1 1,554,865 10.3 65.6
Georgia ............. 5,984,188 284,546 4.8 7,594,476 751,438 9.9 374,251 4.9 164.1
Hawaii............... 1,026,209 254,724 24.8 1,134,351 302,125 26.6 143,505 12.7 18.6
Idaho ............... 926,703 58,995 6.4 1,196,793 111,879 9.3 46,539 3.9 89.6
Illinois ............... 10,585,838 1,499,112 14.2 11,547,505 2,220,719 19.2 1,054,722 9.1 48.1
Indiana .............. 5,146,160 245,826 4.8 5,657,818 362,082 6.4 143,427 2.5 47.3
Iowa ................ 2,583,526 100,391 3.9 2,738,499 160,022 5.8 68,108 2.5 59.4
Kansas .............. 2,289,615 131,604 5.7 2,500,360 218,655 8.7 98,207 3.9 66.1
Kentucky ............ 3,434,955 86,482 2.5 3,776,230 148,473 3.9 58,871 1.6 71.7
Louisiana ............ 3,886,353 391,994 10.1 4,153,367 382,364 9.2 116,907 2.8 –2.5
Maine ............... 1,142,122 105,441 9.2 1,204,164 93,966 7.8 24,063 2.0 –10.9
Maryland ............ 4,425,285 395,051 8.9 4,945,043 622,714 12.6 246,287 5.0 57.6
Massachusetts........ 5,605,751 852,228 15.2 5,954,249 1,115,570 18.7 459,073 7.7 30.9
Michigan............. 8,594,737 569,807 6.6 9,268,782 781,381 8.4 294,606 3.2 37.1
Minnesota ........... 4,038,361 227,161 5.6 4,591,491 389,988 8.5 167,511 3.6 71.7
Mississippi ........... 2,378,805 66,516 2.8 2,641,453 95,522 3.6 36,059 1.4 43.6
Missouri ............. 4,748,704 178,210 3.8 5,226,022 264,281 5.1 103,019 2.0 48.3
Montana ............. 740,218 37,020 5.0 847,362 44,331 5.2 12,663 1.5 19.7
Nebraska ............ 1,458,904 69,872 4.8 1,594,700 125,654 7.9 57,772 3.6 79.8
Nevada.............. 1,110,450 146,152 13.2 1,853,720 427,972 23.1 207,687 11.2 192.8
New Hampshire....... 1,024,621 88,796 8.7 1,160,340 96,088 8.3 28,073 2.4 8.2
New Jersey .......... 7,200,696 1,406,148 19.5 7,856,268 2,001,690 25.5 873,088 11.1 42.4
New Mexico .......... 1,390,048 493,999 35.5 1,689,911 616,964 36.5 201,055 11.9 24.9
NewYork............ 16,743,048 3,908,720 23.3 17,749,110 4,962,921 28.0 2,310,256 13.0 27.0
North Carolina ........ 6,172,301 240,866 3.9 7,513,165 603,517 8.0 297,858 4.0 150.6
North Dakota ......... 590,839 46,897 7.9 603,106 37,976 6.3 11,003 1.8 –19.0
Ohio ................ 10,063,212 546,148 5.4 10,599,968 648,493 6.1 234,459 2.2 18.7
Oklahoma............ 2,921,755 145,798 5.0 3,215,719 238,532 7.4 98,990 3.1 63.6
Oregon .............. 2,640,482 191,710 7.3 3,199,323 388,669 12.1 188,958 5.9 102.7
Pennsylvania ......... 11,085,170 806,876 7.3 11,555,538 972,484 8.4 368,257 3.2 20.5
Rhode Island ......... 936,423 159,492 17.0 985,184 196,624 20.0 83,624 8.5 23.3
South Carolina........ 3,231,539 113,163 3.5 3,748,669 196,429 5.2 82,279 2.2 73.6
South Dakota......... 641,226 41,994 6.5 703,820 45,575 6.5 16,376 2.3 (NS)
Tennessee ........... 4,544,743 131,550 2.9 5,315,920 256,516 4.8 108,265 2.0 95.0
Texas ............... 15,605,822 3,970,304 25.4 19,241,518 6,010,753 31.2 2,669,603 13.9 51.4
Utah ................ 1,553,351 120,404 7.8 2,023,875 253,249 12.5 105,691 5.2 110.3
Vermont ............. 521,521 30,409 5.8 574,842 34,075 5.9 9,305 1.6 (NS)
Virginia .............. 5,746,419 418,521 7.3 6,619,266 735,191 11.1 303,729 4.6 75.7
Washington .......... 4,501,879 403,173 9.0 5,501,398 770,886 14.0 350,914 6.4 91.2
West Virginia ......... 1,686,932 44,203 2.6 1,706,931 45,895 2.7 13,550 0.8 3.8
Wisconsin............ 4,531,134 263,638 5.8 5,022,073 368,712 7.3 148,910 3.0 39.9
Wyoming ............ 418,713 23,809 5.7 462,809 29,485 6.4 8,919 1.9 23.8
Puerto Rico ......... 3,522,037 (NA) (NA) 3,515,228 3,008,567 85.6 2,527,156 71.9 (NA)
NA Not available. NS Not statistically different from zero at the 90-percent confidence level.
Source: U.S. Census Bureau, Census 2000 Summary File 3 and 1990 Census Summary Tape File 3.