Product assortment at winmart+ in ho chi minh city
Bạn đang xem bản rút gọn của tài liệu. Xem và tải ngay bản đầy đủ của tài liệu tại đây (2.03 MB, 119 trang )
UNIVERSITY OF ECONOMICS HO CHI MINH CITY
International School of Business
------------------------------
LAM MINH TRI
PRODUCT ASSORTMENT AT
WINMART+ IN HO CHI MINH CITY
MASTER OF BUSINESS ADMINISTRATION
Ho Chi Minh City – Year 2021
UNIVERSITY OF ECONOMICS HO CHI MINH CITY
International School of Business
------------------------------
LAM MINH TRI
PRODUCT ASSORTMENT AT
WINMART+ IN HO CHI MINH CITY
MASTER OF BUSINESS ADMINISTRATION
SUPERVISOR: DR. TRAN PHUONG THAO
Ho Chi Minh City – Year 2021
EXECUTIVE SUMMARY
In order to survive in a competitive environment and to establish a strong position in
the market, retailers should be able to manage their operational activities efficiently
while providing an adequate customer service level. Activities such as store and
inventory management, establishing relationships with the suppliers, ordering and
purchasing of products all contribute to operational costs, while additional costs, or
rather loss of revenue, may incur due to poor quality procurement and customer
dissatisfaction. An important trade-off in finding the right product assortment is that
increasing variety increases customer satisfaction but has a negative effect on
operational costs. As a result, when a retailer decides on which suppliers to work with
and what product assortment to carry, it is important to understand the expectations
and the purchasing behaviors of customers.
Assortment and inventory decisions are two of the most important decisions in
retailing. Marketing management and retailing textbooks highlight the importance of
product assortment in achieving differentiation and satisfying the wants of target
shoppers better than the competition (1). However, providing a product assortment that
can optimize sales and fulfill the needs of various customers is not easy work.
Moreover, the expansion into a variety of locations challenges retailers to make
different product assortments across their store chains (2). Particularly, recent research
highlights the key role of product assortment in satisfy customers, increase sales and
profit.
In practice, at Winmart+ in Ho Chi Minh city, the mini-mart store chain, is facing an
increase in days of inventory outstanding (DIO) from July 2020 to January 2021. In
addition, the sum of non-moving stock at each store in Ho Chi Minh City takes a really
high percentage. Based on in-depth interviews with important stakeholders, secondary
data for support, and literature, the current product assortment is the main problem that
leads to these symptoms. This thesis will explore the root causes and propose the
proper solution to solve them.
i|Page
ACKNOWLEDGEMENT
First and foremost, I would like to express my special thanks to Dr. Tran Phuong Thao
for her insightful advice, suggestions, enthusiasm and patience in guiding me during
the master thesis period. With the plentiful experience I have encouraged me to go on
the right way to accomplish the thesis.
I would also like to thank the teachers of the 10th grade MBA who equipped me with
the knowledge, skills and thinking to complete the thesis. I would also like to thank
my classmates for sharing experiences and practical knowledge and motivating me
throughout the time of my assignment.
Finally, I would like to thank WinCommerce Company for assisting me so much in
providing important and necessary data for this thesis. Especially I want to thank
Ms.Wendy, Mr.Nhan and Mr.Hieu took the time to interview and share much
information that help me understand deeper about the situation so that I can complete
the thesis.
ii | P a g e
TABLE OF CONTENTS
TABLE OF CONTENTS .......................................................................................... iii
LIST OF TABLES ..................................................................................................... vi
LIST OF FIGURES .................................................................................................. vii
CHAPTER 1: PROBLEM CONTEXT .................................................................... 1
1.1. COMPANY OVERVIEW ................................................................................... 1
1.2. Cosmetic and Personal Care Department ......................................................... 6
1.3. Retail market in Vietnam .................................................................................... 7
1.4. Business symptoms ............................................................................................ 14
1.4.1.
High Days Inventory Outstanding in Ho Chi Minh City ..................... 14
1.4.2.
Too many non moving items in Ho Chi Minh City’s Stores ................ 18
CHAPTER 2: PROBLEM IDENTIFICATION .................................................... 20
2.1. Problem mess...................................................................................................... 20
2.1.1.
Inaccurate Demand Forecasting ............................................................ 21
2.1.2.
Inappropriate Delivery Method ............................................................. 23
2.1.3.
Inefficient product assortment ............................................................... 24
2.2. Problem validation ............................................................................................. 29
2.2.1.
Inaccurate Demand Forecasting ............................................................ 29
2.2.2.
Inappropriate Delivery Method ............................................................. 30
2.2.3.
Inefficient product assortment ............................................................... 31
2.3. Main problem definitions .................................................................................. 37
2.4. Consequences ..................................................................................................... 38
CHAPTER 3: CAUSE VALIDATION ................................................................... 40
3.1. Potential causes .................................................................................................. 40
iii | P a g e
3.1.1.
Diverse in store’s characteristic ............................................................. 41
3.1.2.
External Influence ................................................................................... 44
3.1.3.
Lack of Product Assortment Planning .................................................. 44
3.2. Justification of real causes ................................................................................ 47
3.2.1.
Diverse in store’s characteristic ............................................................. 47
3.2.2.
External Influence ................................................................................... 49
3.2.3.
Lack of Product Assortment Planning .................................................. 50
3.3. Main Cause ......................................................................................................... 54
CHAPTER 4: SOLUTIONS SUGGESTIONS ...................................................... 57
5.1. Alternative solutions .......................................................................................... 57
5.1.1
Reducing product assortment ................................................................ 57
5.1.2
Management Product Assortment ......................................................... 62
5.2. Solution Selection ............................................................................................... 67
5.3. Action plan for solution ..................................................................................... 69
CHAPTER 5: SUPPORTING INFORMATION .................................................. 72
5.1.
Methodology ................................................................................................ 72
5.2.
In-depth interview: ..................................................................................... 73
LIST OF REFERENCES......................................................................................... 97
iv | P a g e
ABBREVIATION
Q
Quarter
FMCG
Fast-moving consumer goods
M&A
Mergers and acquisitions
DIO
Day of inventory outstanding
DC
Distribution Centre
SKU
Stock Keeping Unit
MOV
Min of Value
v|Page
LIST OF TABLES
TABLE 1: CATEGORY PERFORMANCE IN 2020 ----------------------------------------------- 6
TABLE 2: THE PROPORTION OF CATEGORY IN NON FOOD GROUP ------------------------- 7
TABLE 3: DIO OF STORES IN HA NOI, HO CHI MINH AND OTHER AREAS -------------- 16
TABLE 4: REVENUE BY SUBCATEGORY IN HO CHI MINH CITY -------------------------- 17
TABLE 5: NUMBER OF NON MOVING ITEMS OF COSMETIC AND PERSONAL CARE AT
WINMART+ FROM JULY 2020 TO JANUARY 2021 ------------------------------------ 18
TABLE 6: GOOD RECEIPT FROM JULY 2020 TO JANUARY 2021 -------------------------- 22
TABLE 7: NUMBER OF SKU OF EACH SUB CATEGORY IN JANUARY -------------------- 28
TABLE 8: THE VALUE OF GOOD RECEIPT BY TWO METHODS ----------------------------- 31
TABLE 9: GROWTH RATE MONTH ON MONTH OF COSMETIC AND PERSONAL CARE -- 34
TABLE 10: THE ASSORTMENT BASKETS CORRESPOND WITH THE STORE SIZE.--------- 48
TABLE 11: NUMBER OF STORE FORMATS IN HO CHI MINH CITY ------------------------ 48
TABLE 12: THE NUMBER OF NEW SKU LISTINGS IN 2020 -------------------------------- 51
TABLE 13: STANDARD OF FACING AGAINST ACTUAL FACING --------------------------- 52
TABLE 14: NUMBER OF SKUS ACCOUNT FOR 80% SALES OF EACH SUB-CATEGORY IN
JANUARY ---------------------------------------------------------------------------------- 58
TABLE 15: BENEFIT AND COST OF DEVELOPING FOR LISTING AND DELISTING -------- 62
TABLE 16: BENEFIT AND COST OF PROVING DIFFERENT ASSORTMENT FOR EVERY STORE
CLUSTER -----------------------------------------------------------------------------------
65
TABLE 17: BENEFIT AND COST OF USING SOFTWARE FOR ASSORTMENT PLANNING - 67
TABLE 18: DETAILED ACTION PLAN -------------------------------------------------------- 71
TABLE 19: SUMMARY OF INTERVIEW RESULT --------------------------------------------- 96
vi | P a g e
LIST OF FIGURES
FIGURE 1: NUMBER OF STORE OF WINMART AND WINMART+ .................................... 3
FIGURE 2: EBITDA OF WINCOMMERCE ....................................................................... 4
FIGURE 3: ORGANIZATION CHART OF COMMERCIAL DEPARTMENT. ............................ 5
FIGURE 4 THE GROWTH RATE BETWEEN 3 GROUPS AT WINMART+ .............................. 6
FIGURE 5: VIETNAM'S RETAIL SALES GROWTH FROM JAN 2020 TO JAN 2021 ............. 8
FIGURE 6: SALES OF GOODS AND SERVICES IN RETAIL SECTOR FROM 2010 TO 2019.... 9
FIGURE 7: GROCERY RETAIL SALES BY CHANNEL IN 2019 ........................................ 10
FIGURE 8: THE PORTION OF IN STORE-BASED AND NON-STORE-BASED SALES............ 11
FIGURE 9: NUMBER OF STORES, AND SALES TREND OF CONVENIENCE STORES. ......... 12
FIGURE 10: DIO OF STORES IN HA NOI, HO CHI MINH AND OTHER AREAS................ 16
FIGURE 11: DIO BY SUBCATEGORY AT STORES IN HO CHI MINH CITY ...................... 17
FIGURE 12: PRELIMINARY MAP ................................................................................... 21
FIGURE 13: MAKING AND RECEIVING ORDER PROCESS ............................................. 23
FIGURE 14: CURRENT ASM VS IDEALLY ASM PLAN ................................................. 27
FIGURE 15: DELIVERY METHOD AT WINMART+ ......................................................... 31
FIGURE 16: SALE AND STOCK OF DIRECT DELIVERY ................................................... 31
FIGURE 17: GROWTH RATE MONTH ON MONTH OF COSMETIC AND PERSONAL CARE 35
FIGURE 18: UPDATED CAUSE-EFFECT MAP ................................................................. 37
FIGURE 19: THE POTENTIAL CAUSES THAT LEADS TO THE MAIN PROBLEM ................ 41
FIGURE 20: IMPACT OF LOCATION FACTORS ON STORE SALES VALUE AND PROFIT .... 43
FIGURE 21: THE UPDATED CAUSE-EFFECT TREE 2 ...................................................... 47
FIGURE 22: THE FISHBONE DIAGRAM OF POTENTIAL CAUSES ..................................... 54
FIGURE 23: THE MAIN CAUSE THAT LEAD TO INEFFICIENT PRODUCT ASSORTMENT ... 55
FIGURE 24: THE FINAL CAUSE-EFFECT TREE ........ ERROR! BOOKMARK NOT DEFINED.
FIGURE 25: THE MATRIX OF DETERMINE THE POSITION OF SKUS BASED ON
UNIQUENESS AND ECONOMIC PERFORMANCE FACTOR.................................... 61
FIGURE 26: THE PROCESS OF LOCALIZING ASSORTMENT ............................................ 64
FIGURE 27: THE PROCESS OF SAP ASSORTMENT PLANNING ...................................... 66
vii | P a g e
CHAPTER 1: PROBLEM CONTEXT
1.1.
COMPANY OVERVIEW
Corperation overview
In November 2004, the Ruby Shipping Corporation was established.
Until August 2009, the name of Ruby Life Group Corporation was officially
changed. In that year, the big milestone was recorded which was successfully
listed on the Ho Chi Minh Stock Exchange on 5 November 2009. In July 2015,
the name was again changed to Ruby Group Corporation which is consistent
with the brand and practices.
Ruby is a holding company, which consist of members companies such
as Ruby Consumer Holdings (“RCH”), Ruby MEATGreen (“RMG”), Ruby
Resources (“RR”), and Ruby Services and Trading Development JSC (the
owner of 100% of Win Commerce General Commercial Services Joint Stock
Company with a well know “WinCommerce” grocery retailing platform).
With the vision to be Vietnam’s pride by uplifting the material and
spiritual lives of Vietnamese consumers and the mission is to provide quality
products and services for Vietnam’s population of nearly 100 million people,
enabling them to get more value for money on their daily basic needs, Ruby
Group is going on their way.
At the end of the fiscal year 2020, Ruby Group achieved revenue of VND
77,218 billion, an increase of 106.7% compared with the revenue of VND
37,354 billion in 2019. Net profit attributable to the company's shareholders
reached VND 265 billion in Q4. / 2020 and 1,234 billion VND in the whole
year 2020. Profits attributable to shareholders of the company reached VND
1,234 billion in 2020, a decrease of 77.8% compared to 2019. The reason for
Ruby said is due to the influence from the merger of WinCommerce (WCM)
and the interests of shareholders. The minority at Ruby Consumer Holdings
(RCH) increased due to the dilution of Ruby's ownership ratio.
1|Page
WinCommerce General Commercial Services Joint Stock Company
Established in 2014 up to now, WinCommerce General Commercial
Services Joint Stock Company (so-called as WinCommerce) has two grocery
systems namely the WinMart & WinMart+ which are constantly evolving. They
are well known as the largest modern retail platform in Vietnam. As of May
2019, WinCommerce has developed more than 120 supermarkets (WinMart)
and 2,200 mini-marts (WinMart+) in 58 provinces across Vietnam and become
the largest retail store chain that covers the widest cover. They are providing
consumers with a variety of quality goods and services, fully meeting the needs
of the shopping experience from popular to high-end of all customers.
WinMart+ brings peace of mind every day to all families and makes Vietnamese
life quality.
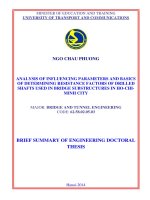
According to Ruby’s financial statements, the whole chain broke even in
the fourth quarter of 2020 with an EBITDA margin for the period of 0.2%.
WinCommerce’s EBITDA margin has continuously improved from (4.8)% in
the first quarter of 2020, (8.4)% in the second quarter of 2020, (3.0)% in the
third quarter of 2020 and finally positive. 0.2% in the fourth quarter of 2020.
Particularly in the fourth quarter of 2020, excluding general overheads,
VinMart+ stores and WinMart supermarkets opened before 2019 achieved
positive EBITDA margins of 4.1% and 2.8%, respectively.
2|Page
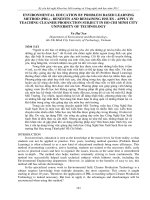
Figure 1: Number of store of WinMart and WinMart+
(Source: Internal report)
In terms of omni-channel strategy, WinCommerce is a pioneer in the
retail market by launching the VID super app which accesses more than 8
million customers. From 2017 to 2019, WinCommerce has continuously
received honor awards not only in domestic but also international. Namely, Top
10 most prestigious retailers in Vietnam, Asian Responsible Business, and
Asian Green Retailers. With the mission of sustainable development and
creating for customers the mentality of "SAFE BUYING EVERY DAY '',
WinMart & WinMart + always strive to fully meet customers' shopping
requirements and commit to quality when using products. products, fast
delivery, improve the value of consumers' life in modern society. Providing the
perfect choice for convenience shopping, WinMart & WinMart+ aims to
become the leading retail system in Vietnam, leading in providing consumer
products and quality services in people's lives. Vietnam.
3|Page
Figure 2: EBITDA of WinCommerce
(Source: Internal report)
4|Page
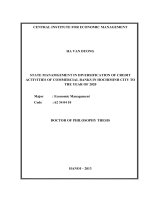
Organization chart:
Figure 3: Organization chart of Commercial Department.
(Source: Internal report)
5|Page
1.2.
Cosmetic and Personal Care Department
At Winmart+, there are three main groups that are responsible for three
major categories. They are FMCG, Non Food and Fresh Food. Overview of
three categories in 2020, the Non Food shows itself as the category with the
highest percentage of profits. Specially, the FM of Non Food gained 22.7% in
2020 (see table 1).
FMCG
NON FOOD
FRESH FOOD
16.10%
22.70%
15.50%
Table 1: Category performance in 2020
(Source: Analyzed by author)
Comparing the growth rate in 2020 compared to 2019, the Non Food
group is showing outstanding growth compared to other groups. Specifically,
the Non Food group grew by 51%, while the FMCG and Fresh Food grew by
45% and 32%, respectively.
NON FOOD, 51%
60%
50%
FMCG, 45%
FRESH FOOD,
32%
40%
30%
20%
10%
0%
FRESH FOOD
FMCG
NON FOOD
Figure 4 The growth rate between 3 groups at Winmart+
(Source: Drawn by author)
In which, Non Food includes subcategories such as: Chemical, Paper and
Cotton, Cosmetics and Personal Care, Homeline and Textile. Regarding the
proportion of revenue in the category of cosmetics and personal care, which
accounts for the highest proportion:
6|Page
Category
Actual proportion
Front Margin
Chemical product
3.8%
16.4%
Paper and Cotton
3.0%
17.9%
Cosmetics and Personal Care
5.6%
18.4%
Homeline
1.7%
32.6%
Textile
0.7%
30.3%
Table 2: The proportion of category in Non Food group
(Source: Analyzed by author)
The cosmetic and personal care industry is considered to be the main
industry of the Non Food group, the industry capable of bringing in not only a
lot of revenue but also a very significant profit. However, in the period of half
of 2020 and the first month of 2021, the category of cosmetics and personal care
has symptoms that need to be paid attention to such as increasing in high stock
and the quantity of slow and non moving products had a rather high proportion.
This shows that the items at the store are not really suitable at the mini mart
because the sale in this period is still good.
Additionally, according to the 2021’s target, the company expects to
increase 20% in revenue which can be the challenge of each category in this
year. Next sectors will present the current symptoms, problems and causes. It
not only deals with the main problem, but also demonstrates the opportunity the
category can create to meet the target.
1.3.
Retail market in Vietnam
In the retail landscape, growth in modern retail stores has remained stable
while traditional retail stores have remained stagnant. Convenience stores and
supermarkets have continuously expanded their scale by opening new stores
continuously. In terms of retail sales, although independent small grocery stores
7|Page
still account for the majority of retail sales, convenience stores have the most
growth. Foreign brands dominate the convenience store segment, while
supermarkets are dominated by domestic brands. Vinmart + and Bach Hoa Xanh
are leading the mini mart, while Co.Opmart and Vinmart are the two leading
supermarket chains in Vietnam.
In January 2021 retail sales in Vietnam increased 6.4% year-on-year, slower
than the 9.4% increase in the previous month. This is the lowest growth rate
since October 2020, in retail trade, due to the resurgence of covid-19 which
reduces demand. Sales increased in both goods (8.7% vs 13.8% in December)
and other services (7.3% vs 2.4%).
Figure 5: Vietnam's Retail Sales Growth from Jan 2020 to Jan 2021
(Source: Internet ( />Based on the newspaper of Vietnamnet Global, in 2020, the retail market
in Vietnam had a fair development. The total industry expanded 7% year on
year, corresponding to $11 billion dollars, according to the General Statistics
Office (GSO). This growth rate, although still lower than the 12.7% recorded
last year, is an encouraging sign for the business community amid a slump in
global retail markets. collected during a pandemic. As a report in 2020 about
the strong growth in the retail industry, Ho Chi Minh city rises two-digit in
growth rate which is 12% year-on-year to US$33 billion.
8|Page
Vietnam's total retail sales of consumer goods and services in 2020 are
estimated at 5,059.8 trillion dong ($ 219.53 billion) in 2020, an increase of 2.6%
from 2019. In which, the revenue of the retail industry occupied about 79%,
corresponding to about 3,996.9 trillion VND (172.76 billion USD), and up 6.8%
over the same period in 2019.
Consumer demand for domestic goods has been heavily affected by the
Covid-19 epidemic, resulting in a low growth rate since 2014. Specifically, in
the first 2 months of 2020, it was 9.8%, compared with 14.4% of the same period
last year (4). However, there is a lot of potential for growth in the retail sector
in Viet Nam which has shown continuous growth year on year over the past
decade (see figure 6). Specifically, consumers in Vietnam are still optimistic
despite the COVID-19 (5).
Figure 6: Sales of goods and services in retail sector from 2010 to 2019
(Source: Statista)
Comparatively, the sales between in-store and non-store based which
including e-commerce also show a similar trend. In which the in-store sales
account for the highest portion that is around 97% of the retail sales (see Figure
8). Traditional channels (markets and groceries) still play a dominant role and
dominate more than 90% of the total market. Meanwhile, modern channels
9|Page
account for about 8% of total grocery retail sales. However, a massive 8.5%
annual growth rate shows that the modern.
Figure 7: Grocery Retail Sales by Channel in 2019
(Source: Internet ( ))
Another hand, the outbreak of COVID-19 was the basis of a change in
shopping behavior from buying directly in a store to buying online.
Consequently, the decrease more than 50% of the frequency of the customers
who come to the groceries. In which, about 25% of them move to shop online
(6)
10 | P a g e
Figure 8: The portion of in store-based and non-store-based sales
(Source: Euromonitor, Deloitte analysis)
In recent years, the rapid growth of convenience stores across Vietnam,
with a market size of about 4.4 trillion VND thanks to a good revenue growth
rate of 18% in 2019 (see Figure 9) (6). The market is dominated by some big
retail store chains such as Circle K, Family Mart, and GS25, with market shares
of 21.4%, 20.7% and 9.6%, respectively (6). In terms of the number of stores,
WinCommerce is the leading convenience store and supermarket segment with
nationwide coverage (6).
11 | P a g e
Figure 9: Number of stores, and sales trend of convenience stores.
(Source: Euromonitor, Deloitte analysis)
On the other hand, on the positive side of COVID-19, new customers
change to shop in convenience stores. The pandemic forced people to distance
themselves, limit exposure to crowds and hold public objects, encouraging a
significant number of consumers to start making their first transactions online
or online in convenience stores (6).
In the context of fierce and increasing competition, along with great
potential, retail sector in Viet Nam has become a hotspot for mergers and
acquisitions in recent years. Just in 2019, a number of well-known deals such
as the M&A between Vingroup and Masan (6); Queensland is acquired by
VinMart's; and Auchan Vietnam is acquired by Saigon Co.op (6).
Across the different forms of retail, both foreign and domestic retailers
are aiming for a dominant position as they embark on scaling strategies. Under
the intense competition in Viet Nam retail sector, some foreign retailers have
quit their business in Viet Nam that creates opportunities for local firms in M&A
which helps them to expand the market share and increasing sales. For example,
12 | P a g e
Vingroup bought the Malaysian grocery chain Shop & Go in Vietnam with a
token amount of 1 USD (6).
At the same time, M&A deals from foreign investors are aimed at
expanding the scale. It can be mentioned that Central Group buys 49% shares
of Nguyen Kim and buys Big C Vietnam, TCC Group buys Metro Cash & Carry
Vietnam, and 20% of BiboMart shares are bought by ACA Investments (6).
However, in the face of the explosive risks of the COVID-19 pandemic,
the increase of Vietnamese businesses are facing the financial pressures. It
creates opportunities for foreign acquire. The Vietnam Chamber of Commerce
and Industry (VCCI) recently told Vietnamese businesses by proposing to
suspend M&A deals during the pandemic to limit foreign acquisitions, the
impact As far as COVID-19 is concerned. It is not clear what the ongoing M&A
activities of the retail industry are (6).
With a population of over 90 million people at this moment that can be
forecasted to reach nearly 100 million in 2024, the average age at 32.5 and an
urban share of 35.92 percent, Vietnam has great potential to increase retail sales
in terms of consumer power. In general, per capita monthly income has
increased significantly over the past eight years, which can be explained by the
increase in household consumption spending in recent years. Monthly spending
on fresh food is especially high in both urban and rural areas. Popular categories
that are also heavily consumed include milk tea, coffee, and personal care
products.
Before the COVID-19 pandemic, personal care and beauty growth
reached 6.8% - twice that of FMCG. In which, skin care products increased
10.7% and hair care increased 8.5% which are the two fastest growing
categories, accounting for 39% of total industry spending and contributing more
than 50% of growth (7).
13 | P a g e
The category most affected by COVID-19 is cosmetics when in
September 2020, sales of the item fell by 14.2%. The main reason is that
entertainment venues such as restaurants, bars and nightclubs are closed, and
the demand for beauty has since decreased. The consumption of deodorants is
also bleak. Q1 / 2020's growth rate remained at 2% as in 2019, and started to
decline in Q2. The reason for this delay is the ability to penetrate the industry
in the main market of China weakened by the pandemic (7).
Firstly, the moisturizer category grew again at the end of Q3 / 2020 when
the decrease was only 1.3%. Meanwhile, sales of this item decreased 2.2% in
Q1 and 2.3% in Q2. The hair and dental care category slowed down and
maintained that rate throughout 2020. Furthermore, by the end of the year, the
performance of the two categories will be significantly improved. Finally, hand
sanitizer and soap achieved the most noticeable growth. The fact that people
focus on hygiene above all, as well as the government encouraging the use of
hand gel has brought great benefits to the list. In general, by the end of Q3 /
2020, these items achieve growth of up to 12.6%, and revenue for the whole
year 2020 may be more than 15%.
Despite its growth, the retail sector faces several challenges from some
emerging trends, for instance, the strength of food delivery services among
Vietnamese as well as out-of-home consumption. This e-commerce market in
Vietnam and its use means that retailers need to consider omni-channel
strategies by embracing the transition towards digital consumption and conform
to the fast-paced society to provide seamless customer experiences.
1.4.
Business symptoms
1.4.1. High Days Inventory Outstanding in Ho Chi Minh City
As Cheung points out the company's profitability can be significantly
improved thanks to good inventory management. (8) Lambert and Marota have
expressed a similar view that a direct relationship between good inventory
14 | P a g e
management and the performance of the company (9,10). In fact when the
company manages the inventory ineffectively, it not only leads to increased
inventory management costs, but also results in easily damaged and lost goods,
resulting in a lot of waste (11). Inventory management has an important role in
ensuring that the desired inventory level is maintained for any particular product
or item (12).
Inventory days can be defined by how many days it will take for those
inventories to turn around. It means how long the next order is made. If a
company holds a high amount of inventory which means overstock for a long
period of time, the company will be harmed by expiry, obsolescence, inventory
storage cost which result in business failures. To measure whether inventory
management is contributing to a company's financial performance by tracking
inventory days. The Days of Inventory Outstanding (DIO) rating can show how
much inventory control a company is gaining. It shows how long it will take to
sell all the stock at that point in time. To calculate the number of days in stock,
the cost of goods sold is divided by the average value of the goods in the period,
then multiplied by the number of days in the period.
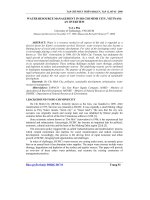
In mini marts, the products have been selected thoroughly to make sure
those are necessary items and convenient. However from July 2020 to January
2021 the days of inventory outstanding in Ho Chi Minh city showed an upward
trend. In January 2021, the days of inventory outstanding came to 117 days
which means that the stores need 117 days to sell the product, almost double the
target. Details can be seen in Figure 10.
Compared to Ha Noi city which has much more stores than Ho Chi Minh
city, the days of inventory outstanding is lower. In detail, the days of inventory
outstanding in January in Ha Noi city is 95 days. The following table shows the
comparison of DIO in Ho Chi Minh city and Ha Noi city:
15 | P a g e
JUL
2020
AUG
2020
SEP
2020
OCT
2020
NOV
2020
DEC
2020
JAN
2021
Ho Chi Minh City
111
95
93
93
102
114
117
Ha Noi City
88
76
72
76
79
90
95
Others
114
103
98
98
94
100
105
Table 3: DIO of Stores in Ha Noi, Ho Chi Minh and other areas
(Resource: Analyzed by author)
140
117
120
105
100
95
80
60
40
20
-
JUL 2020 AUG 2020 SEP 2020 OCT 2020 NOV 2020 DEC 2020 JAN 2021
TP. Hà Nội
TP. Hồ Chí Minh
Others
Figure 10: DIO of Stores in Ha Noi, Ho Chi Minh and other areas
(Source: Drawn by author)
As shown above, the DIO at stores in Ho Chi Minh city shows the serious
problem compared to other areas. Especially the last months of the year have
increased significantly.
Furthermore, according to Ms.Yen – Head of Non Food, “the target’s
days of inventory outstanding at the store at 75 days maximum is an ideal
number which is compared with its competitors”. Similarly, Ms.Trang, a key
account manager of one of the biggest companies that specializes in personal
care, home care and food products, reveals that the days of inventory of Bach
16 | P a g e