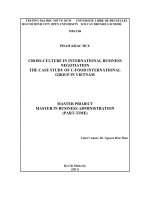
Ineffective operation of k company production lines in vietnam
Bạn đang xem bản rút gọn của tài liệu. Xem và tải ngay bản đầy đủ của tài liệu tại đây (1.86 MB, 92 trang )
UNIVERSITY OF ECONOMICS HO CHI MINH CITY
International School of Business
------------------------------
NGUYEN MINH VY
INEFFECTIVE OPERATION OF
K COMPANY PRODUCTION LINES
IN VIETNAM
MASTER OF BUSINESS ADMINISTRATION
Ho Chi Minh City – Year 2021
UNIVERSITY OF ECONOMICS HO CHI MINH CITY
International School of Business
------------------------------
NGUYEN MINH VY
INEFFECTIVE OPERATION OF
K COMPANY PRODUCTION LINES
IN VIETNAM
MASTER OF BUSINESS ADMINISTRATION
SUPERVISOR: Dr. PHAN THI MINH THU
Ho Chi Minh City – Year 2021
2
TABLE OF CONTENTS
TABLE OF CONTENTS ........................................................................................................ 3
LIST OF FIGURES ................................................................................................................. 5
LIST OF TABLES ................................................................................................................... 6
ACKNOWLEDGEMENT ....................................................................................................... 7
EXECUTIVE SUMMARY ..................................................................................................... 8
CHAPTER 1: INTRODUCTION ........................................................................................... 9
1.1 COMPANY OVERVIEW ............................................................................................. 9
1.2 PROBLEM CONTEXT ............................................................................................... 11
1.2.1 Quality assurance system......................................................................................... 11
1.2.2 Procedure of corrective action of complaint notice ................................................. 12
1.2.3 The background of complaints from customers for the Vietnam representative
office of K Company ........................................................................................................ 15
1.3 SYMPTOMS ................................................................................................................. 15
CHAPTER 2: PROBLEM IDENTIFICATION ................................................................. 26
2.1
POSSIBLE PROBLEM .......................................................................................... 26
2.1.1 Overloading in peak season of production, workers are tired and easily to make
mistake in processing........................................................................................................ 28
2.1.2 Workers are infective/ careless in some stages for a certain period of time ........... 28
2.1.3 New workers are not acquainted with their skills, leading to production error. ...... 28
2.1.4 The rule of random sensory testing product is inaccurate. ...................................... 29
2.1.5 The impurities from raw material, equipment, tools, packing................................. 29
2.1.6 The training of workers in processing steps is not effective. .................................. 30
2.2
PROBLEM VALIDATION.................................................................................... 31
2.2.1 The ineffective quality assurance management of partner ...................................... 32
2.2.2 The ineffective quality control management on partner’s processing lines ............ 32
2.2.3 The ineffective operation of production lines (people, production process) ........... 34
2.3
MAIN PROBLEM DEFINITION ......................................................................... 38
2.3.1
Definition/description ........................................................................................ 38
2.3.2
Importance ......................................................................................................... 38
CHAPTER 3: POTENTIAL CAUSES ................................................................................ 39
3.1
Ineffective production process management ........................................................ 39
3.1.1
Poor checking production condition: ................................................................. 39
3.1.2
Poor setting production line: people of each step, working time, steps of
processing. ........................................................................................................................ 41
3
3.2
Ineffective people management .............................................................................. 42
3.2.1
Ineffective training of new workers and current workers: ................................. 42
3.2.2
Ineffective checking and correcting worker’s processing steps: ....................... 43
3.2.3
The supervisors are ineffective in their duties: .................................................. 44
CHAPTER 4: ALTERNATIVE SOLUTIONS ................................................................... 47
4.1
Set of Solution 1 ....................................................................................................... 47
4.1.1 Adjust the staff training method .............................................................................. 47
4.1.2 Redesign the duties of supervisors .......................................................................... 48
4.1.3 Cost and benefit ....................................................................................................... 50
4.2
Set of solution 2........................................................................................................ 52
4.2.1 Adjust the staff training method .............................................................................. 52
4.2.2 Adjust the quality allowance for supervisors .......................................................... 54
4.2.3 Increase personnel for supervisors .......................................................................... 54
4.2.4 Cost and benefit ....................................................................................................... 55
4.3
ACTION PLAN IN ORGANIZATION ................................................................ 57
4.4
SOLUTION SELECTION ..................................................................................... 64
CHAPTER 5: CONCLUSION.............................................................................................. 66
CHAPTER 6: SUPPORTING INFORMATION ................................................................ 67
INTERVIEW TRANSCRIPT ........................................................................................... 67
APPENDIX ......................................................................................................................... 84
REFERENCES ................................................................................................................... 91
4
LIST OF FIGURES
Figure 1: The organization structure of K Company in 2020. ................................................. 10
Figure 2: The organization structure of K Company in 2020 .................................................. 11
Figure 3: Procedure of corrective action of complaint notice chart. ........................................ 13
Figure 4: Total complaint notice of S company in 2018-2020 ................................................ 16
Figure 5: Complaint notice all types of fish 2018-2020 .......................................................... 18
Figure 6: All types of complaint notice 2018-2020 ................................................................. 20
Figure 7: Exporting container quantity and percentage of complaint/ container in period
2018-2020 ................................................................................................................................ 24
Figure 8: Exporting container quantity and complaint notice in 2018-2020 ........................... 24
Figure 9: The initial cause and effect map. .............................................................................. 31
Figure 10: The updated initial cause and effect map. .............................................................. 37
Figure 11: Cause and effect diagram of ineffective operation of production lines. ................ 46
5
LIST OF TABLES
Table 1: Complaint notice in 2018-2020 ................................................................................ 16
Table 2: Ratio of complaint notice/ container. ........................................................................ 17
Table 3: Types of complaint notice in 2018-2020 .................................................................. 21
Table 4: Seasonal increasing in complaints from 2018-2020 ................................................. 21
Table 5: Seasonal increasing in complaints and exporting containers from 2018-2020 ....... 22
Table 6: Processing product volume of K Company at S partner in 2018-2020. ................... 25
Table 7: Sale revenue of K Company for S partner’s product in 2018-2020. ........................ 26
Table 8: The quality salary structure for workers. .................................................................. 50
Table 9: Cost for set of solution 1. .......................................................................................... 50
Table 10: Actual staff salary for 1 production line/month. ..................................................... 51
Table 11: Average processing fee of fish product (except worker salary) ............................. 52
Table 12: Benefit for set of solution 1. ................................................................................... 52
Table 13: The quality allowance structure for supervisors. .................................................... 54
Table 14: Staff salary when applying set of solution 2. .......................................................... 56
Table 15: Cost for set of solution 2. ........................................................................................ 57
Table 16: Benefit for set of solution 2. ................................................................................... 57
Table 17: Compare benefit set of solution 1 with set of solution 2. ....................................... 64
Table 18: List of the interviewees. .......................................................................................... 67
6
ACKNOWLEDGEMENT
First and foremost, I would like to convey my great gratitude to my supervisor, Dr. Phan
Thi Minh Thu, for her unwavering support. Her helpful counsel has helped me
overcome all of my mistakes and difficulties in the process of doing my thesis. She also
teaches me many things more than just this thesis. From the bottom of my heart, I want
to express my gratitude to my adviser for everything he has done for me.
Secondly, I want to thank all of the lecturers at the International School of Business
(ISB) - UEH who supported me during studying at ISB. The useful knowledge and skills
that I have learned helped me not only in my thesis but also in my career.
Last but not least, I'd like to express my gratitude to my company and the individuals
who spent their valuable time conducting in-depth interviews and offering helpful
material for the thesis.
7
EXECUTIVE SUMMARY
In today's modern life, people gradually tend to use foods that are convenient, easy to
prepare, and good for health. Besides, product quality and safety are the top priorities
of consumers. For that reason, the K Company always focuses on producing products
that meet the quality, needs, and tastes of fastidious consumers. However, company K
still receives complaints from the consumers about the quality of frozen seafood
products. This thesis with the topic: “Ineffective operation of K Company production
lines in Vietnam” has figured some points as below:
Firstly, the symptom increasing in customer complaints has been clarified through
analysis of collected data from K Company’s internal report, the quality assurance
department, and the production management department.
Secondly, through in-depth interviews with members of K Company’s partner (S
Company), and K Company member, many problems lead to the increase of customer
complaints. These problems are the ineffective quality assurance management of
partner, the ineffective quality control management on partner’s processing lines, and
the ineffective operation of production lines. Each problem has a varied level of
influence on the problem but the ineffective operation of production lines is the main
problem.
In addition, the potential causes leading to the ineffective operation of production lines
are ineffective production process management and ineffective people management.
Following the validation and evaluation, the cause: “Ineffective people management”
is considered as the main cause.
Finally, two alternative sets of solutions are proposed to improve the effectiveness of
people management. Based on deep evaluation of cost, benefit of these sets of solution
and final confirmation from K Company’s partner, the set of solution one (adjusting the
staff training method and redesigning the duties of supervisors) is chosen. So that by
implementing an action plan for set of solution one, the problem: “Ineffective operation
of K Company production lines in Vietnam” can be solved effectively.
8
INEFFECTIVE OPERATION OF K COMPANY PRODUCTION LINES IN
VIETNAM.
CHAPTER 1: INTRODUCTION
1.1 COMPANY OVERVIEW
K Company started business in 1937 as a fishing company (period 1937-1959). From
1960 to 2004, it grew into a comprehensive food company that focuses on seafood
trading and processed foods. From 2005, K Company began its transformation to a true
food company (1). K Company specializes in fishery products and runs the business
from procurement to processing and sales.
Our mission: Aiming to grow together with society, contributing to a healthy and heartenriched lifestyle and food culture based on management of human respect. (2)
President: Mr. Makoto Inoue
Representative senior managing director: Mr. Ken Sakai
Number of employees: 2037 including group companies.
Five business field of K: (3)
● Marine products purchasing business: K Company engages steady procurement
of high-quality marine products, supplies raw materials to partners in Japan and
overseas, and sells sliced fish products and peeled products (crab, shrimp, etc.).
● Frozen foods business: Selling approximately 1000 different varieties of frozen
food for industrial and home use. Sushi toppings (salmon, shrimp, squid, snow
crab) and raw fish products (salmon, shrimp, squid, snow crab) are sold to
conveyor belt sushi stores. More overs, Selling Dandori Jozu series of processed
food and products which are easy to reheat at home or for nursing facilities
(grilled fish, boiled fish, and pickled fish). Besides, K also sell products to
restaurant and supermarket deli sections, such as fried seafood, Ocean King
imitation crab meat, meat products, and frozen vegetables.
● Shelf-stable foods business: K started manufacturing canned foods in 1949,
focus on canned fish such as skipjack, salmon, crab, and products of the Sea
Marché brand.
9
● Tuna business: From fishing and farming to purchasing, K manages all tunarelated operations. Fishing: Wakaba Maru - tuna purse seine fishing vessels catch
skipjack in the Pacific Ocean to provide high-quality raw materials for sashimi,
dried bonito, and canned products. Farming: Hon-Maguro no Kiwami TUNAGU
full-life-cycle aquaculture of blue-fin tuna product, which does not rely on
natural juvenile fish.
● Logistics Business: provide a logistics service focused on the cold storage
business.
Organizational structure in 2020.
Figure 1: The organization structure of K Company in 2020.
10
1.2 PROBLEM CONTEXT
1.2.1 Quality assurance system
K Company’s quality assurance department includes product management section,
division of customer services, and quality assurance section. This department takes
responsibility for analyzing the hazards of processing flow charts, the product quality
to customers, and contacting customers when having complaints.
Sale Division – Business Division
Quality Assurance
Department
- Product Management Section
-Division of Customer Services
-Quality Assurance Section
Customer
Domestic
Plants
Oversea Plants
China - Qingdao
Representative Office
Fs Company
Viet Nam – Hochiminh city
Representative Office
S Company
Thailand – Bangkok
Representative Office
Fi Company
Figure 2: The organization structure of K Company in 2020
Basis policy for Quality assurance: (4)
● Providing products with safety and security: We give highest priority to
providing safe and secure products to customers, and construct, maintain, and
continuously review systems to achieve this goal.
● Complying with the law: We comply with all laws related to food, such as food
sanitation law. We also comply with voluntary rules that are separately defined.
● Providing accurate Information: We accurately convey information on our
products to customers in a manner that is easy to understand.
11
● Sincere customer support: If an incident or complaint should occur with one of
our products, we swiftly and sincerely prevent the spread of damage, investigate
the cause, plan countermeasures, and report to the customer, etc.
1.2.2 Procedure of corrective action of complaint notice
In K Company’s procedure of making corrective action of complain, there are three
main departments as below taking responsibility:
Overseas plants: produce products (by partner) and export to Japan (order from
head office) then shell products in Japan/ other countries.
Domestic plants: produce products then shell products to customers.
Quality assurance department: control all product quality of overseas – domestic
plants and take responsibility for product quality to customers.
The procedure is described more detail based on chart as below:
12
Customer Complaint
Quality Assurance Department
No (A)
Analyze Information (A)
Yes (A)
Domestic Plants
Oversea Plants
QA-Thailand
QA-Viet Nam
QA-China
QA department - Partner Company
No (B)
Analyze Information
(Cause)
Yes (B)
Cause-Corrective Plan
No (C)
Approve cause-corrective plan
Yes (C)
Corrective Action
Cause-Corrective Action Report
Figure 3: Procedure of corrective action of complaint notice chart.
13
Note:
● Analyze Information (A): Analyze the type of complaint, level of complaint (AB-C-D, A: serious complaint, D: not K company’s complaint), complaint detail
(which factory processed these products, product information, product lot),
material analysis of the complaint (checking in the laboratory to find out exactly
material of complaint such as bone, nylon fragment, plastic fragment)
● No (A): In case of wrong information or lack of information, the quality
assurance department will contact the customer and ask for more specific
information about the complaint.
● Yes (A): after analyzing the content of complaint notice and having detailed
information of product information (lot no, expiry date, processing date,
processed factory), the quality assurance department will send to the department
in-charge of this complaint (such as oversea plants – QA Vietnam).
● QA-Viet Nam: Receive information, analyze more detail of complaint (which
partner processed these products, is that correct lot no of product, general cause
of this complaint), send complaint notice detail to partner. After having a
corrective action, QA Vietnam checks the corrective action of the partner and
asks for more specific detail in case of lack of information of corrective action,
reports to the upper department, observes the corrective action plan of the
partner. Verify, check and evaluate the partner's production process, product
quality. Check product when having some problems in processing.
● Analyze Information (Cause): Receive complaint, analyze information of
complaint (lot no, expiry date, processing date, processed quantity, if there is
problem on production line), find out the cause of complaint.
● No (B): If needing more information (material of foreign fragment, specific
detail), the partner’s QA department will ask for information/ confirm again.
● Yes (B): After finding out the cause of complaint, move to the next step to
analyze more detail of cause, corrective action plan.
● No (C): if the cause – corrective action is not accepted by the partner’s QA
department – production management department, the person in charge of this
step will re-make it again.
14
● Yes (C): cause – corrective action is accepted by the partner’s QA department –
production management department, the action plan will be issued and be
reported.
1.2.3 The background of complaints from customers for the Vietnam
representative office of K Company
This thesis will focus on manufacturing frozen seafood products of oversea plants of
Vietnam Ho Chi Minh City representative office.
Vietnam’s Ho Chi Minh City representative office focuses on purchasing and
manufacturing products made by partners.
K Company’s manufacturing - exporting product in Vietnam (made by partner) from
2018-2020. There are 3 main partners: S Company (S partner), F Company, Fi
Company. Before July 2018, there were three partners: S Company (90%), Fi Company
(5%), and other partners (5%).
After July 2018 there are three partners:
● S Company: 55%, starting business with K Company from 2006, focusing on
ready to eat products and heating products.
● F Company: 45%, starting business with K Company from July 2018, focusing
on heating products.
● Fi Company: 5% only processing shrimp product, ready to eat and heating
products.
To have the general view of manufacturing products in Vietnam, S Company is chosen
to this thesis.
1.3 SYMPTOMS
In order to identify the problems of the K’s company, symptoms will be justified firstly
by using internal data such as sales revenue data, complaint notice data, and processing
data in the period 2018 to 2020.
After that, the central problem will be identified through reviewing some theory
frameworks in combination with conducting in-depth interviews with partner’s persons
in charge to have a general view of the problems.
15
Complaint notice from customer increased
According to the internal report of K Company, complaint notice of partner – S
Company increased dramatically from 2018 to 2020. It had a total of 73 complaints in
2018, 89 complaints in 2019 (increased 22%) and 113 complaints in 2020 (increased
27%)(5). This ratio is very high compared with the internal quality assurance system of
K Company.
Year
Complaint notice
Rate (%)
2018
73
100%
2019
89
122%
2020
113
127%
Total
275
Table 1: Complaint notice in 2018-2020
TOTAL COMPLAINT NOTICE 2018-2020
127%
120
140%
122%
120%
100
100%
100%
80
80%
113
60
40
89
60%
73
40%
20
20%
0
0%
2018
2019
Complaint notice
2020
Rate (%)
Figure 4: Total complaint notice of S company in 2018-2020
16
Besides, linking the total complaints with the shipment quantity (containers) in the
period 2018-2020 (269 containers in 2018, 379 containers in 2019, and down to 265
containers in 2020), the ratio of complaint notice per container is very high. The detail
is 27.1% in 2018, down to 23.5% in 2019, then increased to 31% in 2020. Although the
exported quantity decreased from 2019 to 2020, the ratio of complaint/ container
increased dramatically from 23.5% to 31%(5). That means there are some problems in
management product quality in the year 2020 leading to an increase of complaint notice
from customers.
Complaint
Year
Container
2018
269
73
27.1%
2019
379
89
23.5%
2020
365
113
31.0%
notice
Rate (%)
Table 2: Ratio of complaint notice/ container.
Moreover, the complaints are also calculated by the types of fish in the period 20182020.
● Mackerel: the number of complaints in S Company for Mackerel products
decreased in the 2018-2019 period from 37 complaints to 22 complaints, but in
the 2019-2020 period, complaints for Mackerel products increased significantly
from 22 complaints to 36 complaints for 2020 (approximately increased
163.6%).
● Horse mackerel: The number of Horse mackerel complaints increased gradually
in the period of 2018-2020, the number of complaints reached 18 in 2018, 30
complaints in 2019 and 31 complaints in 2020 (increased 172.2% in 3 years).
● Salmon: Salmon product complaints in 2018 had 8 complaints, in 2019 and 2020
there were only 3 complaints (decreased 62.5% in 3 years).
● Red fish: this product only had 11 complaints in 2019 and 12 complaints in 2020.
17
● Yellow tail: Yellow tail product had 4 complaints in 2018, 5 complaints in 2019,
but by 2020 the number of complaints increased to 9 complaints (more than 5
complaints, increased 225%).
● Other fish: Products of other fish with the number of complaints increased
steadily over the years from 2018 to 2019, from 2 complaints to 6 complaints. In
the 2019-2020 period, the number of complaints increased from 6 complaints to
9 complaints. In total, complaints increased 450%.
● Crab: Crab products had 4 complaints in 2018, but in 2019 complaints were more
than three times compared with previous year (12 complaints). The number of
crab complaints in 2020 is 13 complaints – increased 325% in 3 years.
Complaint notice - all types of fish 2018-2020
40
37
36
35
30
31
30
25
22
20
18
15
11
10
12
12
9
8
5
4
3 3
13
9
6
5
4
2
0
0
Mackerel
Salmon
Horse
mackerel
2018
Red fish
2019
Yellow tail
Other fish
Crab
2020
Figure 5: Complaint notice all types of fish 2018-2020
On the other hand, the total complaints are classified as types of complaint for each kind
of fish in three year 2018-2020. There are 4 types of complaint: remaining bone,
remaining foreign fragment, packaging mistake, and other mistakes (color, meat texture,
odor, etc.). (5)
18
Mackerel: The number of Mackerel product’s complaint is the highest ratio
among all types of fish with 95 complaints (34.5%). In detail, the remaining
foreign fragment is the highest with 34 complaints (35.8%), followed by
packaging error with 31 complaints (32.6%), and other mistakes with 22
complaints (23.2%). Complaints remaining bone is the lowest 8.4% (8
complaints).
Salmon: The number of Salmon product’s complaint is the lowest ratio among
all types of fish with 95 complaints (34.5%). The other mistake is the most with
7 complaints (50%). The remaining bone, remaining foreign fragment
complaints are the same level with 3 complaints (21.4%). Packaging error is the
lowest 7.1% (1 complaint).
Horse mackerel: The number of Horse mackerel product’s complaint is the
second-highest ratio among all types of fish with 79 complaints (28.7%). In
which, the remaining bone is the highest with 36 complaints (45.6%), followed
by remaining foreign fragment with 22 complaints (27.8%), other mistakes with
17 complaints (21.5%). Packaging mistake is the lowest 5.1% (4 complaints).
Redfish: The number of Redfish product’s complaint is only 8.4% in all types of
fish with 23 complaints. The remaining bone is the most with 13 complaints
(56.5%). The next is others’ mistakes with 7 complaints (30.4%), remaining
foreign fragment is the lowest 13% (3 complaints). There is no packaging error
in redfish products.
Yellow tail: The number of Yellow tail product’s complaint is only 6.5% in all
types of fish with 18 complaints. The remaining foreign fragment is the highest
with 10 complaints (55.6%), followed by the remaining bone with 7 complaints
(38.9%). Another mistake is only 1 complaint (5.6%), and there is no packaging
mistake in the yellow tail product.
Other fish: The number of other fish product’s complaint is only 6.2% in all types
of fish with 17 complaints (6.2%). In which, the remaining bone is the most with
6 complaints (35.3%), followed by remaining foreign fragment with 5
complaints (29.4%), other mistakes with 4 complaints (23.5%). Packaging
mistake is the lowest 5.1% (2 complaints).
19
Crab: The number of Crab product’s complaint is 29 complaints (10.5%) in all
types of fish with. In detail, the other error is the highest with 12 complaints
(41.4%). The remaining bone, remaining foreign fragment complaints are as
same as level with 8 complaints (27.6%). Packaging mistake is only 1 complaint
(5.1%).
All types of Complaint notice period 2018-2020
40
36
34
35
31
30
25
22
22
20
17
15
13
12
10
10
8
5
7
7
4
3 3
8 8
7
6
3
1
0
0
1
5
4
2
1
0
Mackerel
Salmon
Horse mackerel
Remaining bone
Red fish
Foreign fragment
Yellow tail
Packaging mistake
Other fish
Crab
Other mistake
Figure 6: All types of complaint notice 2018-2020
To sum up, two main complaints are remaining bone and remaining foreign fragment
in the period 2018-2020. The remaining foreign fragments is the highest ratio with 85
complaints (30.9%), followed by remaining bone with 81 complaints (29.5%). Other
mistake is only 25.5% with 70 complaint, and packaging mistake is the lowest ratio
with 39 complaints (14.2%)
20
Total
Rate (%)
Remaining bone
81
29.5%
Foreign fragment
85
30.9%
Packaging mistake
39
14.2%
Other mistake
70
25.5%
Total
275
100%
Table 3: Types of complaint notice in 2018-2020
To analyze deeper, the complaints are counted by the season of production. In the period
2018-2020, the complaints occurred heavily in these months: January to March (before
and after Tet holiday), May (Golden week – big holiday in Japan), August (Obon
holiday in Japan), November, December (end of year). The tables as below reported the
complaints of every month: (5)
Number of complaints
Year
Year
Year
2018
2019
2020
Jan
8
8
7
Feb
10
12
14
Mar
11
7
10
Apr
2
2
6
May
7
8
14
Jun
3
4
8
Jul
5
4
9
Aug
6
10
11
Sep
3
4
7
Oct
5
6
6
Prepare for New year
Nov
7
10
11
season
Dec
6
14
10
Total
73
89
113
Period
Before-after Tet
holiday
Golden week
Obon holiday in Aug
Month
Table 4: Seasonal increasing in complaints from 2018-2020
21
Percentage of
Container quantity
Number of
(pcs)
complaints (pcs)
complaints/container
(%)
Year
Year
Year
Year
Year
Year
Year
Year
Year
2018
2019
2020
2018
2019
2020
2018
2019
2020
Jan
23
28
20
8
8
7
35%
29%
35%
Feb
17
20
27
10
12
14
59%
60%
52%
Mar
21
31
34
11
7
10
52%
23%
29%
Apr
20
32
32
2
2
6
10%
6%
19%
May
25
37
34
7
8
14
28%
22%
41%
Jun
19
30
29
3
4
8
16%
13%
28%
Jul
19
27
31
5
4
9
26%
15%
29%
Aug
24
36
33
6
10
11
25%
28%
33%
Sep
25
29
29
3
4
7
12%
14%
24%
Oct
23
32
27
5
6
6
22%
19%
22%
Nov
27
38
33
7
10
11
26%
26%
33%
Dec
26
39
36
6
14
10
23%
36%
28%
Total
269
379
365
73
89
113
Month
Table 5: Seasonal increasing in complaints and exporting containers from 2018-2020
The total number of complaints for the first quarter of the year 2018, 2019, and 2020
are 29, 27 and 31 complaints, accounting for 40%, 30% and 27% of the total number of
complaints for the whole year. In which, the first quarter of the years 2018, 2019, and
2020 is also the quarter with a very high rate of complaints per exported container,
accounting for a very high rate compared to the remaining quarters (35-59% in 2018,
23-60% in 2019, 29-52% in 2020). Particularly in February 2018, 2019, 2020 and
January 2020, the number of complaints/containers was abnormally high. The reason
was that during the Vietnamese New Year holidays, the actual working days were only
10-14 days/month (normally working 26 days/month). So that the number of products
was fewer than other months but had too many complaints. Consequently, the ratio of
22
complaints per exported container increased suddenly. Assuming those times above,
workers do not have Lunar Tet holidays, the number of exporting containers is supposed
to be 30 containers in February 2018, 34 containers in February 2019, and 35 containers
in January 2020. From the above hypothesis, it can be concluded that without the Tet
holiday, S Company also produces a lot, and the rate of complaint/container increases
as well as the rest of peak production seasons.
Besides the first quarter with high complaints, the other peak production seasons of the
year also had a high number of complaints and a high rate of complaints per exported
container was May, August, November, and December. The complaint/container rate
for May is 22-41%, August is 25-33%, November is 26-33%, and December is 23-36%.
Along with the increase in the number of exported containers annually (except the year
2020), the number of complaints has also increased every year. The months with a high
number of complaints in 2018 are 4 months, but by 2019 that are 7 months and the year
2020 are 9 months. On the other hand, the number of complaints in November and in
December of period 2018-2020 also accounts for a large number of complaints during
the whole year. From the above consequence, the proportion of complaints per container
in the last 2 months of 2018, 2019, and 2020 accounts for a relatively high proportion
compared to the remaining months (23-26% in 2018, 26-36% in 2019, and 28-33% in
2020).
23
Exporting container - percentage of complaint/container in
2018-2020
45
70%
40
60%
35
50%
30
25
40%
20
30%
15
20%
10
10%
5
0
0%
Jan
Feb
Mar
Apr
May
Jun
Jul
Aug
Sep
Oct
Nov
Container year 2018
Container year 2019
Container year 2020
Complaint/container year 2018
Complaint/container year 2019
Complaint/container year 2020
Dec
Figure 7: Exporting container quantity and percentage of complaint/ container in
period 2018-2020
Exporting container - complaint notice in 2018-2020
45
16
40
14
35
12
30
10
25
8
20
6
15
4
10
2
5
0
0
Jan
Feb
Mar
Apr
May
Jun
Jul
Aug
Sep
Oct
Nov
Container year 2018
Container year 2019
Container year 2020
Complaint year 2018
Complaint year 2019
Complaint year 2020
Dec
Figure 8: Exporting container quantity and complaint notice in 2018-2020
24
In short, the main symptom is the seasonal increase of customer complaints and the
complaints focus on remaining bone and remaining foreign fragments.
Due to the increase of customer complaints in K Company, the processing product
volume and sales revenue are also decreased in the period 2018-2020.
Processing product volume decreased
As a result of increasing complaints from customers, the processing product amount of
S Company partner increased and decreased erratically in 2018-2020. In 2018 product
quantity was 3085 tons, in 2019 the product quantity increased significantly to 2698
tons (approximately increasing 120%). However, in 2020 the processing product
volume dropped sharply to 3469 tons, equivalent to 6% decrease compared with the
year 2019.(5) That means the more complaints that Company had, the less satisfaction
from customers they would have. As a consequence, the processing amount decreased
sharply in 2020.
Year
Processing
volume (MT)
Rate (%)
2018
3,085
100%
2019
3,698
120%
2020
3,469
94%
Table 6: Processing product volume of K Company at S partner in 2018-2020.
Sale revenue decreased
Linking to the processing product volume, the sales revenue of K Company for S
partner’s product is also fluctuated in the period 2018-2020. In 2018 sales amount was
$28,364,000; it jumped to $37,053,000 (increased 131%). Unexpectedly, sales revenue
declined dramatically to $33,013,000 in 2020, equivalent to 11% decrease compare with
the year 2019. (5)
25