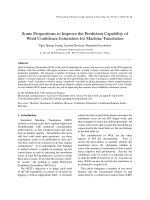
Lighten up using artificial light to improve the capture efficiency of fishing gears
Bạn đang xem bản rút gọn của tài liệu. Xem và tải ngay bản đầy đủ của tài liệu tại đây (3.29 MB, 270 trang )
Lighten Up: Using Artificial Light to Improve
the Capture Efficiency of Fishing Gears
by © Khanh Q. Nguyen
A thesis submitted to the School of Graduate Studies in partial fulfillment of
the requirements for the degree of
Doctor of Philosophy
Environmental Science Programme
Faculty of Science
Memorial University of Newfoundland
April, 2019
St. John’s, Newfoundland and Labrador
ABSTRACT
Snow crab (Chionoecetes opilio) is an important commercial shellfish and one
of the most valuable fisheries in eastern Canada. The Newfoundland and Labrador
snow crab fishery has been the world’s largest for the past two decades. Total landings
grew substantially between the 1980s and 1990s, but more recently, the industry has
been faced with new challenges including decreases in stock abundance (i.e., poor
pre-recruitment), changes in environmental condition (i.e., warming ocean water
temperatures), conflicts with shrimp trawlers, effects of seismic exploration, and
increases in operating costs. Maintaining the economic viability of small fishing
businesses in the presence of these new stressors can be a challenge. In outputcontrolled fisheries such as snow crab, improving the catch rate of existing traps is an
effective method of improving the financial viability of small fishing businesses. In
this thesis, I conducted a comprehensive examination of the behaviour of snow crab in
response to artificial light (i.e., Light-Emitting Diode (LED) lights and luminescent
netting), including laboratory and field experiments, to address the primary goal of
improving the catch rate of small conical traps commonly used for catching snow crab
in the North Atlantic Ocean.
First, I conducted a literature review regarding the use of artificial light in
commercial industrialized fisheries. The review provides valuable knowledge and
reference for scientists, managers, and fishermen on animal behaviour in response to
artificial light. It also addresses the trade-off between positive effects such as
increased catch rate and reduced bycatch with negative effects such as the production
of increased plastic, ocean litter, and greenhouse gas emission. Second, I conducted 7
I
experiments to investigate the behaviour of snow crab in response to artificial light,
including 2 laboratory studies and 5 field studies, to address the primary goal of
improving the catch rates of snow crab traps. Results from the laboratory experiments
indicated that snow crab responded differently to different light colours. Field
experiments in 2016 demonstrated that equipping baited traps with small low-powered
LED lights increased the Catch Per Unit Effort (CPUE; number of crab per pot) of the
traps (i.e., 77% and 47% for white and purple LED lights, respectively). Next, I
examined the effect of installing underwater LED lights in different locations and
orientations inside baited traps targeting snow crab off the coast of Newfoundland and
Labrador, Canada. Results from this field experiment in 2017 revealed that the
location and orientation of lights does not appear to be important. Next, I conducted a
comparative fishing study onboard a large offshore fishing vessel targeting snow crab
in the Barents Sea, off the coast of Norway. Results revealed that equipping baited
traps with purple lights increased the CPUE by 11.6%, although the results varied
with the density of crab.
Finally, I examined the potential application of luminescent netting as a source
of artificial light to determine whether it could be used to improve the CPUE of traps.
A benchtop laboratory experiment was conducted to measure the duration of
luminescence using time-lapse photography. I found that luminescent netting can be
activated to emit light and that the resulting intensity and duration of luminescence
emitted over time, depends on the initial duration of UV exposure and the source of
light. A follow-up field experiment in 2018 showed that luminescent traps
significantly increased the catch rate of snow crab compared to traditional traps.
II
Overall, the results of my PhD research demonstrate that artificial light can
improve the catch rates of snow crab traps, with examples from different light sources
(i.e., LED light, luminescent netting) and locations (Barents Sea, Newfoundland and
Labrador). These results suggest that the application of artificial light in commercial
snow crab fisheries could improve the financial viability of fishing enterprises.
III
ACKNOWLEDGEMENTS
I was fortunate to receive many helps and assistances from the excellent support
system during my school time. My study could not be done without invaluable
helping. First of all I would like to offer my sincerest thank you to my academic
supervisor Dr. Paul Winger at the Fisheries and Marine Institute for his incredible
mentorship, excellent guidance, and constant support throughout my degree. Dr. Paul
Winger has supported me from the first days when I started looking for funding and
applied to the PhD program at Memorial University of Newfoundland. I would never
have been able to start or finish this thesis without him. I have learned a lot from him.
It is not only his academic knowledge that he has provided, but he has also modelled
an exemplary style of living. I do believe that what I have been learning from Dr. Paul
Winger will definitely be profitable for the rest of my life. I also extend many thanks
to his family for their kind support and great friendship from the first days when I
arrived in St. John’s. I would like to acknowledge the rest of my academic supervisory
committee including Dr. Corey Morris at the Fisheries and Ocean Canada, Drs. Scott
Grant and Shannon Bayse at the Centre for Sustainable Aquatic Resources for their
valuable guidance, consultation, advice and support during my thesis. I also would
like to express my great gratitude to all of the lecturers in the Environmental Science
program at Memorial University of Newfoundland for their teaching and support. The
knowledge that I learnt from them is extremely useful for my future career.
I am grateful to my “second family” in St. John’s - the Centre for Sustainable
Aquatic Resources (CSAR) for their kind assistance on various projects and their
overall good nature and friendliness. I could not have asked for a better environment
IV
for enabling me to achieve my research goals as a graduate student. Everybody there
has given me kindness and warm friendship. I wish to express my sincere thanks to
Kelly Moret for her great support, encouragement, and priceless help, and to Claudene
Hartery for valuable secretarial support. I heartily thank Gail Kenny and Nancy
Bishop, the administrative staff in the Interdisciplinary Program Office for their
guidance. Many thanks to my fellow graduate students Tomas Araya Schmidt,
Zhaohai Cheng, and Jessica Wood for kind and constructive assistance throughout my
research. I would also like to acknowledge my colleague Truong Nguyen and his
family for the kind welcome, warm friendship, and invaluable support over the last
few years in Canada. To other individuals who assisted me and made contributions
along the way, I deeply appreciate your time, effort and understanding, most of whom
I have chosen to mention at the end of each chapter.
I also wish to acknowledge fisher partners Bernard Chafe - captain of the F/V
The Phoenix, Gerard Chidley - captain of the F/V Atlantic Champion, Bob Parsons captain of the F/V Flat Rock Byes, Karl Olav - captain of M/S Tromsbas, Elmer Jensen
- captain of the F/V Another Girl, Junior Morris - captain of the F/V Paula Charlene,
Keith Pierce - captain of the F/V Trusty, and their crew members for kind assistance
and hospitality while out at sea.
Financial support for my stipend was provided by Vietnam International
Education Development (VIED) and Memorial University. Funding for my research
activities, travel to conferences, and publications costs were provided by the Fisheries
and Marine Institute of Memorial University, the Research Council of Norway
V
through the project SnowMap, No. 243627, and the Graduate Research Accelerator
Development (GRAD) fund. This PhD research would not have been possible without
the significant contribution from those funders. I greatly appreciate their financial
contributions to my studies. I am deeply indebted to Dr. Phu Tran, director of the
Institute of Marine Science and Fishing Technology, Nha Trang University, Vietnam
where I have been working, for kind help and support along my journey.
Finally, special thanks to my family in Vietnam for always being there for me
and encouraging me every step of the way. I offer my special thanks to my wife An Le
for everything that she has been doing for me. She left a beautiful place - Nha Trang
city, gave up a permanent job without complaint, has taken care of our children, and
has regularly encouraged me through my life and work.
VI
TABLE CONTENTS
ABSTRACT .................................................................................................................... i
ACKNOWLEDGEMENTS .......................................................................................... iv
List of Tables ............................................................................................................... xii
List of Figures ............................................................................................................. xiv
Chapter 1. Introduction and Overview ...................................................................... 1
1.1. Snow Crab Distribution and Biology ...................................................................... 1
1.2. Newfoundland and Labrador Snow Crab Fishery and Management ...................... 4
1.3. Barents Sea Snow Crab Fishery and Management ............................................... 10
1.4. Use of Artificial Light in Commercial Fisheries .................................................. 12
1.5. Objectives of Research.......................................................................................... 15
1.6. Chapter Outline ..................................................................................................... 15
1.7. Co-Authorship Statement...................................................................................... 18
1.8. References ............................................................................................................. 21
Chapter 2. Artificial light in commercial industrialized fishing applications: a
review .......................................................................................................................... 37
2.1. Abstract ................................................................................................................. 37
2.2. Introduction ........................................................................................................... 38
2.3. Understanding vision of aquatic marine species and their behaviour relative to
artificial light ................................................................................................................ 40
2.3.1. Vision in aquatic marine species .................................................................... 40
2.3.2. Behaviour of marine organisms in response to artificial light ...................... 45
2.4. Use of artificial lights in commercial industrialized fishing applications ............ 47
2.4.1. Historical use of artificial fishing light .......................................................... 47
VII
2.4.3. Use of artificial lights to reduce bycatch ....................................................... 53
2.4.4. Use of artificial light to reduce fuel consumption .......................................... 56
2.5. Negative Impacts .................................................................................................. 58
2.5.1. Ecological effects ........................................................................................... 58
2.5.2. Overfishing effects .......................................................................................... 59
2.5.3. Bycatch effects ................................................................................................ 60
2.5.4. Plastic and litter effects .................................................................................. 61
2.5.5. Greenhouse gas effects ................................................................................... 64
2.6. Solutions to reduce negative impact ..................................................................... 65
2.6.1. Technical measures ........................................................................................ 65
2.6.2. Regulation and management measures .......................................................... 66
2.6.3. Social license .................................................................................................. 67
2.7. Concluding Remarks ............................................................................................. 68
2.8. Way Forward ........................................................................................................ 69
2.9. Acknowledgements ............................................................................................... 70
2.10. References ........................................................................................................... 70
Chapter 3. Artificial lights improve the catchability of snow crab (Chionoecetes
opilio) traps ............................................................................................................... 103
3.1. Abstract ............................................................................................................... 103
3.2. Introduction ......................................................................................................... 104
3.3. Materials and methods ........................................................................................ 107
3.3.1. LED lights .................................................................................................... 107
3.3.2. Laboratory experiment ................................................................................. 108
3.3.3. Field Experiment No. 1 ................................................................................ 110
VIII
3.3.4. Field Experiment No. 2 ................................................................................ 111
3.3.5. Statistical analysis ........................................................................................ 112
3.4. Results ................................................................................................................. 114
3.4.1. Laboratory Experiment ................................................................................ 114
3.4.2. Field Experiment No. 1 ................................................................................ 116
3.4.3. Field Experiment No. 2 ................................................................................ 117
3.5. Discussion ........................................................................................................... 119
3.6. Way Forward ...................................................................................................... 126
3.7. Acknowledgements ............................................................................................. 126
3.8. References ........................................................................................................... 127
Chapter 4. A trap with low-powered light-emitting diode (LED) lights:
evaluating the effect of location and orientation of lights on the catch rate of snow
crab ............................................................................................................................ 143
4.1. Abstract ............................................................................................................... 143
4.2. Introduction ......................................................................................................... 144
4.3. Methods............................................................................................................... 147
4.3.1. Sea trials ....................................................................................................... 147
4.3.2. Analysis ........................................................................................................ 150
4.4. Results ................................................................................................................. 152
4.5. Discussion ........................................................................................................... 154
4.6. Way Forward ...................................................................................................... 158
4.7. Acknowledgements ............................................................................................. 159
4.7. References ........................................................................................................... 159
IX
Chapter 5. Light-Emitting Diode (LED) lights improve catch rate of snow crab
pots at relatively high population densities ........................................................... 174
5.1. Abstract ............................................................................................................... 174
5.2. Introduction ......................................................................................................... 175
5.3. Methods............................................................................................................... 178
5.3.1. Gear Description .......................................................................................... 178
5.3.2. Sea Trials...................................................................................................... 179
5.3.3. Statistical analysis ........................................................................................ 181
5.4. Results ................................................................................................................. 183
5.4.1. Effects of artificial light on catch rates ........................................................ 183
5.4.2. Selectivity and bycatch ................................................................................. 184
5.5. Discussion ........................................................................................................... 185
5.6. Way forward ....................................................................................................... 189
5.7. Acknowledgements ............................................................................................. 190
5.8. References ........................................................................................................... 190
Chapter 6. Application of luminescent netting to improve the catchability of snow
crab traps .................................................................................................................. 206
6.1. Abstract ............................................................................................................... 206
6.2. Introduction ......................................................................................................... 207
6.3. Methods and Materials ........................................................................................ 209
6.3.1. Laboratory Experiment ................................................................................ 209
6.3.2. Fishing Experiment ...................................................................................... 211
6.3.3. Statistical Analysis ....................................................................................... 213
6.4. Results ................................................................................................................. 215
X
6.4.1. Laboratory Experiment ................................................................................ 215
6.4.2. Fishing Experiment ...................................................................................... 216
6.5. Discussion ........................................................................................................... 217
6.6. Acknowledgement .............................................................................................. 221
6.7. References ........................................................................................................... 221
Chapter 7. Summary and Synthesis ....................................................................... 237
7.1. Fish Vision and the Use of Artificial Light in Commercial Fishing
Applications ............................................................................................................... 238
7.2. Improving Catch Rates of Snow Crab Traps Using LED Lights ........................ 239
7.3. An Alternative to LED Lights – Luminescent Netting ....................................... 242
7.4. Limitations of My Approach .............................................................................. 243
7.5. Recommendations for Further Research ............................................................. 246
7.6. Conclusions ......................................................................................................... 249
7.7. References ........................................................................................................... 250
XI
List of Tables
i
Table 2.1. The visual sensitivity of various aquatic species.. ..................................... 95
Table 2.2. Behaviour of various aquatic species in response to light colour .............. 96
Table 2.3. Behaviour of various aquatic species in response to light intensity........... 98
Table 2.4. Summary of the historical use of artificial light (overwater/surface) used in
fishing. ....................................................................................................................... 100
Table 3.1. Summary of snow crab responses to the LED lights during the laboratory
experiment.................................................................................................................. 138
Table 3.2. Mean CPUE of snow crab for the different trap treatments in Field
Experiment No.1, including their pairwise post hoc comparison using Tukey’s
HSD............................................................................................................................ 139
Table 3.3. Mean CPUE of snow crab for the different trap treatments in each fishing
trip in Field Experiment No.1, including their pairwise post hoc comparison using
Tukey’s HSD ............................................................................................................. 140
Table 3.4. Mean CPUE of snow crab for the different trap treatments in Field
Experiment No.2. ....................................................................................................... 141
Table 3.5. Bayesian Model Average multiple regression describing CPUE for the
Field Experiment No.2. .............................................................................................. 142
Table 4.1. Parameter estimates and fit statistics of the GLMM model, with negative
binomial distribution of catches of legal-sized crab. ................................................. 171
Table 4.2. Parameter estimates and fit statistics of the GLMM model, with negative
binomial distribution of catches of sublegal-sized crab. ............................................ 171
Table 4.3. Mean CPUE of legal and sublegal size crab captured by the different soak
times and their comparisons using Non-parametric Wilcoxon Rank-Sum Test ........ 172
XII
Table 4.4. Mean CW recorded for the different treatments and their pairwise post hoc
comparison using Tukey’s HSD ................................................................................ 173
Table 5.1. Parameter estimates, fit statistics, and variation from the random effect of a
GLMM model for legal-sized snow crab using fleetID as a random factor .............. 202
Table 5.2. Parameter estimates, fit statistics, and variation from the random effect of a
GLMM model for sublegal-sized snow crab using fleetID as a random factor. ........ 203
Table 5.3. Parameter estimates, fit statistics, and variation from the random effect of a
GLMM model comparing the CPUE of snow crab for the different pot treatments by
different catch densities ............................................................................................. 204
Table 5.4. Summary of all bycatch species caught during the experiment ............... 205
Table 6.1. Summary details for the comparative fishing experiment. ...................... 233
Table 6.2. Pairwise post-hoc comparison of the different experimental treatments
using Tukey’s HSD method. ...................................................................................... 233
Table 6.3. Parameters of a log-linear model for different treatments. ...................... 234
Table 6.4. GLMM estimated regression parameters of catch comparison for all data
combined. ................................................................................................................... 235
Table 6.5. GLMM estimated regression parameters of catch comparison of legal-sized
crab for different soak times. ..................................................................................... 236
XIII
List of Figures
i
Figure 1.1. Snow crab distribution in the Pacific and Atlantic Ocean.. ...................... 34
Figure 1.2 Management Areas of the snow crab fishery for the Newfoundland and
Labrador Region. ......................................................................................................... 35
Figure 1.3 Annual landings of snow crab by NAFO Division .................................... 36
Figure 2.1. Eye of snow crab (Chionoecetes opilio). ................................................. 93
Figure 2.2. The diagram illustrates the adaption of cones to light intensity. .............. 93
Figure 2.3. Comparison of visual acuity with body length and species ..................... 94
Figure 2.4. Exponential relationship between the mean catch rate of stick-held dip net
and the light power.. ..................................................................................................... 94
Figure 2.5. History of technological development of artificial light used in
fisheries. ....................................................................................................................... 95
Figure 3.1. Normalized fluorescence of Lindgren-Pitman LED Electralume lights. 133
Figure 3.2. A schematic of experimental tank. ......................................................... 133
Figure 3.3. Map of the at-sea study area ................................................................... 134
Figure 3.4. The time until crab moved out of the experimental cage by different light
treatments ................................................................................................................... 135
Figure 3.5. Boxplots of CPUE of snow crab for the different trap treatments evaluated
in Field Experiment No.1. .......................................................................................... 135
Figure 3.6. Boxplots of CPUE of snow crab for the different trap treatments by
fishing trip, evaluated in Field Experiment No. 1. ..................................................... 135
Figure 3.7. Size frequency distribution of carapace width of legal male crab captured
in the different trap treatments in Field Experiment No. 1. ....................................... 136
Figure 3.8. Mean CW of snow crab captured during each of the six fishing trips
XIV
during Field Experiment No.1. .................................................................................. 136
Figure 3.9. Boxplots of CPUE of snow crab for the different trap treatments evaluated
in Field Experiment No.2. .......................................................................................... 136
Figure 3.10. Average CPUE in relatives to soak time bins for Field Experiment
No.2. ........................................................................................................................... 137
Figure 4.1. Location of the study area, along the northeast coast of the island of
Newfoundland. ........................................................................................................... 166
Figure 4.2. Four light treatments photographed in an underwater tank .................... 167
Figure 4.3. Boxplots of CPUE of snow crab captured by different experimental
treatments ................................................................................................................... 168
Figure 4.4. Boxplots of CPUE of crab classified by legal and sublegal size for the
different light locations and orientations ................................................................... 169
Figure 4.5. Boxplots of CPUE of snow crab classified by different soak time ........ 170
Figure 4.6. Length distribution of snow crab recorded in the different experimental
treatments.. ................................................................................................................. 170
Figure 5.1. Line drawing of the conical snow crab pots used in this experiment. .... 197
Figure 5.2. Map of the study site, located in international waters along the Norwegian
continental shelf. ........................................................................................................ 198
Figure 5.3. Frequency plots of CPUE of legal-sized crab for the different
treatments. .................................................................................................................. 199
Figure 5.4. Comparison of CPUE of legal-sized crab for 15 fleets of pots. ............. 200
Figure 5.5. Carapace width (CW) frequency distribution of male crab captured by
different pot treatments. ............................................................................................. 201
Figure 5.6. A GLMM comparison of the proportion of crab captured at each size class
XV
caught in different treatments. ................................................................................... 201
Figure 6.1. Schematic drawing of the laboratory setup for filming traps in the
dark. ........................................................................................................................... 228
Figure 6.2. Photograph of an experimental luminescent trap in the dark. ................ 228
Figure 6.3. Location of sampling sites in the south coast of Newfoundland.. .......... 229
Figure 6.4. Relationship between light intensity (mean gray value) and time post
charge for the different charge treatments. ................................................................ 230
Figure 6.5. The proportion of legal and sublegal-sized crab captured by the control
and experimental (Exp.) traps at different soaking levels. ......................................... 230
Figure 6.6. CW frequency distribution of male crab captured by the control and
experimental (Expt.) traps. ......................................................................................... 231
Figure 6.7. Pooled length frequency curves (top panel) and observed proportion for
snow crab caught by luminescent trap and control traps. Expt is the experimental
trap.. ........................................................................................................................... 232
XVI
Chapter 1. Introduction and Overview
1.1. Snow Crab Distribution and Biology
The snow crab, also known as Queen crab (Chionoecetes opilio), is a crustacean
like lobster and shrimp, with a flat, almost circular, body and five pairs of spider-like
legs with four pairs of walking legs and one large pair of claws. Their eyes are green
or greenish blue. Snow crab are prized for their sweet, delicate flavour. The snow crab
is a subarctic species, belonging to the family Oregoniidae. The species has been
found in the northern cold water regions in the North Pacific, the Sea of Japan, the Sea
of Okhotsk, the Bering Sea north of the Alaska Peninsula, the west coast of
Greenland, along the east coast of Canada from Nova Scotia to Labrador, and Casco
Bay in Maine, USA (Jadamec et al., 1999; Mullowney et al., 2018; DFO, 2018a).
Snow crab also inhabit the Arctic Ocean, the Beaufort Sea to Cape Perry and the shelf
of the Laptev Sea, and the East Siberian Sea (Jadamec et al., 1999). Snow crab have
also recently invaded and become permanently established in the Arctic Ocean in
portions of the Barents Sea (Alvsvåg et al., 2009; Kaiser et al., 2018). The global
snow crab distribution is shown in Figure 1.1. Snow crab are found in a wide range of
depths between 20 and 2,000 m, on sandy or muddy substrates, with smaller crab
found in shallower water than the larger crab, with most commercial fishing occurring
in depths less than 350 m (Hébert et al., 2001; Alvsvåg et al., 2009; Winger and
Walsh, 2011; Mullowney et al., 2018; DFO, 2018a). As a stenothermal species, their
living temperature is from -1.50 to 110C, but the preferred temperature is below 50C
with salinities in the range of 20–35‰ (Hardy et al., 1994; Yamamoto et al., 2014,
2015; Siikavuopio et al., 2017; Mullowney et al., 2018). Water temperature has a
significant effect on survival, food intake, oxygen consumption, growth, molting,
1
reproduction, movement, and mortality rate (Siikavuopio et al., 2017; Mullowney et
al., 2018).
The life cycle of males is about a maximum of 19 years in duration, while
females is about 13 years (Comeau et al., 1998). Snow crab start to sexually mature at
about four years of age. Females carry the eggs for 1 to 2 years, and can produce up
to 160,000 eggs between the late spring and early summer, depending on ambient
temperatures, food availability, water temperature, and their age (Comeau et al., 1999;
Burmeister, 2002). Larvae then become a pelagic plankton for about 5 months before
settling to the sea floor (Comeau et al., 1998; DFO, 2018a). As crab mature and
increase in size, they migrate from shallow (50m) hard bottom toward deeper (>300m)
soft bottoms of mud, sand and gravel (Comeau et al., 1998; Dawe and Colbourne,
2002). Snow crab are sexually dimorphic with mature males having proportionally
greater carapace width (CW), longer legs, and larger claws than females (Comeau et
al., 1998).
In order to grow, the hard outer shell is periodically shed in a process called
molting that mostly occurs in late winter or spring (Conan and Comeau, 1986; Hébert
et al., 2001; Mullowney et al., 2014; 2018). After molting, crab have a soft shell for a
period of 8 to 10 months (DFO, 2018a). The soft-shelled crab is defined by shell
hardness. The term "white crab" describes both new-soft and clean hard-shelled crab.
The snow crab attains its terminal molt somewhere between instars 9 and 14, at the
size range of about 40–150 mm CW for males, and instars 9 to 11, at the size range of
about 30–95 mm CW for females (Conan and Comeau, 1986). Terminal size is
2
associated with temperature, with cold water promoting terminal molt at smaller sizes
(Sainte-Marie and Hazel, 1992; Dawe et al., 2012). Once reaching their terminal molt,
adult crab can live a maximum of about 6-8 years under optimal conditions, but they
commonly live for 5 to 6 years (Dawe et al., 2012; DFO, 2018a). The maximum size
found in Atlantic Canada is about 95 mm carapace width (CW) for females and 150
mm CW for males (Mullowney et al., 2018; DFO, 2018a), while individuals up to 178
mm CW have been reported in the Russian Far East (Grigoryeva, 2010). As a slow
growth species, males need from 8 to 11 years to reach the size of 95 mm (i.e., recruit
to the fishery), generally earlier in warm areas due to less frequent molting at low
temperatures (Dawe et al., 2012; Mullowney et al., 2018).
Snow crab provide a predatory and scavenging role in many ecosystems. The
diet of snow crab consists of a great variety of prey items depending on every lifestage and habitat (Kolts et al., 2013). In a larval stage, it feeds mostly on
phytoplankton, i.e., algae. While in a juvenile and larger chelae stage they are able to
feed on larger prey items, including gastropods (Gastropoda), bivalves (Bivalvia),
shrimps, clams, brittle stars (Ophiuroidea), polychaete worms (Polychaeta), fish, and
other crustaceans, even soft-shelled snow crab (Squires and Dawe, 2003; Kolts, 2012;
DFO, 2018a). Moreover, males prey more on fish, while females feed more on
shrimps (Squires and Dawe, 2003). Predators of snow crab include cod (Gadus
morhua), haddock (Melanogrammus aeglefinus), halibut (Hippoglossus stenolepsis),
wolffish (Anarhichas sp.), thorny skates (Raja spp.), other snow crab, and seals
(Phocidae) (Squires and Dawe, 2003; DFO, 2018a).
3
1.2. Newfoundland and Labrador Snow Crab Fishery and Management
The Newfoundland and Labrador snow crab fishery had a slow beginning in the
1960s, but grew to become the largest snow crab fishery in the world during the past
two decades, while maintaining Marine Stewardship Council certification since 2013
(MSC, 2013; Dawe and Mullowney, 2016). The Crab Management Areas (CMA)
have no biological relevance, and the resource status is assessed by larger units based
on the Northwest Atlantic Fisheries Organization (NAFO) Divisions, with some
inshore and offshore regions considered separately (Figure 1.2). A small-scale fishery
targeting snow crab began in Trinity Bay in 1968 (i.e., CMA 6A, DFO 2018a). With
new fishing grounds of snow crab being found almost every year in the following
three decades, the fishery developed rapidly thereafter. In the beginning, snow crab
were considered as bycatch in gillnet fisheries targeting groundfish. The fishery
slowly expanded along the northeast coast (NAFO Divisions 3K, 3L) in 1979 and the
south coast of Newfoundland (NAFO Division 2 J) in 1985, and it has moved further
offshore since the mid-1980s (e.g., NAFO Divisions 3O, 3N). This small-scale inshore
fishery remained stable until the early 1990s when significant expansion began.
Following the collapse of many groundfish stocks during the early 1990s, the snow
crab fishery quickly became the most important in terms of social and economic value
(Dawe and Mullowney, 2016; Mullowney et al., 2018). The crab fishery continued to
expand in Newfoundland and Labrador during the 1990s as a result of growing
Japanese market demand and industry diversification (Mullowney et al., 2018).
Landings and the commercial catch per unit effort (CPUE; number of crab per pot)
first peaked in 1981 but the resource then declined during the early 1980s (DFO,
2018a). The resource was fully exploited by 1999 when landings peaked at 69,000
4
mt, largely due to expansion of the fishery to offshore areas, but the resource has
generally declined during the past 20 years, although landings remained at high
volumes compared to the 1980s, with around 50,000 mt in most years. Landings
steadily increased somewhat between 2005 and 2009. However, the overall allocated
quota then dramatically decreased 45% from 53,500 mt in 2009 to only 29,390 mt in
2018 (DFO 2018a, see Figure 1.3).
Corresponding to the rise and fall of this natural resource, the number of fishing
licenses allocated has also changed over time. Very few vessels (<50) were involved
in the early 1980’s, growing to over 3,500 fishing licenses in 1999, but this number
has declined since the mid-2000s to about 2,600 active licenses in 2018 (DFO, 2018a).
The first landings of snow crab took place as bycatch in gillnets targeting
groundfish, but have since switched to the top-entry, Japanese-style conical traps set
in longlines and normally baited with squid (Illex illecebrosus) or a mixture of squid
and herring (Clupea harengus) (Cyr and Sainte-Marie, 1995; Grant and Hiscock,
2009; Winger and Walsh, 2011; DFO, 2018a). Traps consist of four primary
components including a steel frame, net walls, plastic entrance funnel, and a closed
container or free hanging hook (skiver) for bait. Currently, the Newfoundland and
Labrador snow crab fishery uses a trap having an inside bottom ring diameter of about
130cm and the volume is approximately 2 m3 (Cyr and Sainte-Marie, 1995; Winger
and Walsh, 2011). Traps are equipped with a minimum mesh size of 135 mm
stretched mesh netting with a small zipper made of biodegradable twine in the net wall
to prevent ghost fishing in the event traps are lost (Winger et al., 2015). A circular,
5
rigid, funnel-shaped plastic skirt is normally used as an entrance to encourage ingress
and discourage egress once captured. Bait plays an important role in attracting animals
to traps (Thomsen et al., 2010; Winger et al., 2016). Chemical attractants are released
from the bait and transported downstream by the current, producing an odour plume,
whose shape, orientation, and area strongly depends on the amount of bait, the current
speed, direction, and turbulence, losing its effectiveness over time as the bait is
depleted (Sainte-Marie and Turcotte, 2003; Thomsen et al., 2010; Winger and Walsh,
2011; Winger et al., 2016). Like other marine animals, snow crab are attracted to
baited traps by olfaction, and will move toward the bait by walking/swimming
upcurrent to seek the odour source (Vienneau et al., 1993; Winger and Walsh, 2011;
Winger et al., 2016). Use of bait protection containers to prevent scavenging species
(amphipods) from attacking the bait varies among fishing enterprises, depending on
the fishing location, abundance of amphipods encountered and traditional experience.
Several studies have demonstrated that the catch rate of traps is significantly reduced
with unshielded baits, while some others report that exposed baits using a snap
shackle created visual stimulation for conspecifics outside the trap resulting in
attracting more crab toward the trap (Miller, 1990; Cyr and Sainte-Marie, 1995;
Araya-Schmidt, 2017).
As a commercially important species, strict regulations have been adopted and
enforced to ensure conservation objectives and fishery sustainability. The snow crab
resource in Newfoundland and Labrador is currently managed under a three-year
Integrated Fisheries Management Plan (DFO, 2014). Management tools include both
input and output controls:
6
(1) Input controls include fleet capacity, trap limits, individual quotas, trip limits,
fishing areas restrictions, and seasonal limitations:
Several communal fleet sectors exist in the fishery: Inshore fleet,
consisting of <35 ft. vessels fishing in near-shore regions and bays. The
small supplementary fleet consists of predominately by small vessels (i.e.,
35-45 ft.) operating offshore. The fulltime fleet, generally represented by
large vessels (i.e., 45-65 ft.) operating offshore.
Netting on traps must have a minimum stretched mesh size of 135 mm or
minimum mesh bar length of 65 mm to allow escape of females and
sublegal males (DFO, 2018a).
The fishing season typically starts in early April and is finished by the end
of August (DFO, 2018b). However, harvesting does not necessarily last the
whole period due to changes in landed price, weather, and molting
(Pinfold, 2006). An analysis of landings data showed that more than 90%
of the snow crab capture occurs during April-June (Mullowney et al.,
2018).
A soft-shelled protocol was initiated in 2004 within the larger crab fishing
areas to assess the incidence of soft-shelled (recently molted) crab capture.
If a high proportion of soft-shell crab are caught, the fishery will close for
the remainder of the season in that particular grid. The closure thresholds
differ by management area, but in most cases, when 20% of the catch in a
grid is comprised of soft shell crab, that grid is closed (DFO, 2018a).
7
(2) Output controls include minimum landing size, total allowable catches, and
vessel monitoring systems:
The management approach for snow crab is based on maintaining the
harvesting rate at a moderate level when stock status is healthy. The
minimum carapace width (CW) for harvesting snow crab in Newfoundland
and Labrador has been 95 mm since 1973 (Conan and Comeau, 1986). At
this size, most males have had the opportunity to mate at least once
(Comeau et al., 1998). The fishery excludes females (DFO, 2018a).
Females, undersized males, and uncaught legal sized males are assumed to
be sufficient to maintain the reproductive potential of the resource
(Comeau et al., 1998; Dawe and Mullowney, 2016). Under-sized and softshelled males that are retained in the traps must be returned to the sea
(DFO, 2018a).
A total allowable catch (TAC) and quota allocation management system
was initiated by the late 1980s. The TAC to be fished is determined from
scientific and industry input. Advisory Committees submit
recommendations on the TAC based on acceptable exploitation rates that
are adjusted based on biological evidence. TACs are partitioned as
individual quotas (IQs) among fishing enterprises. An IQ does not
guarantee that all crab will be landed. Each fishing enterprise is allocated
an IQ to be harvested within a specific crab management area, toward
achieving a broad spatial distribution of fishing efforts (Mullowney and
Dawe, 2009).
8