Tài liệu Module 1: Introduction to Data Warehousing and OLAP pptx
Bạn đang xem bản rút gọn của tài liệu. Xem và tải ngay bản đầy đủ của tài liệu tại đây (1.08 MB, 48 trang )
Contents
Overview 1
Introducing Data Warehousing 2
Defining OLAP Solutions 11
Understanding Data Warehouse Design 18
Understanding OLAP Models 24
Applying OLAP Cubes 32
Review 40
Module 1: Introduction
to Data Warehousing
and OLAP
BETA MATERIALS FOR MICROSOFT CERTIFIED TRAINER PREPARATION PURPOSES ONLY
Information in this document is subject to change without notice. The names of companies,
products, people, characters, and/or data mentioned herein are fictitious and are in no way intended
to represent any real individual, company, product, or event, unless otherwise noted. Complying
with all applicable copyright laws is the responsibility of the user. No part of this document may
be reproduced or transmitted in any form or by any means, electronic or mechanical, for any
purpose, without the express written permission of Microsoft Corporation. If, however, your only
means of access is electronic, permission to print one copy is hereby granted.
Microsoft may have patents, patent applications, trademarks, copyrights, or other intellectual
property rights covering subject matter in this document. Except as expressly provided in any
written license agreement from Microsoft, the furnishing of this document does not give you any
license to these patents, trademarks, copyrights, or other intellectual property.
2000 Microsoft Corporation. All rights reserved.
Microsoft, BackOffice, MS-DOS, Windows, Windows NT, <plus other appropriate product
names or titles. Replace this example list with list of trademarks provided by copy editor.
Microsoft is listed first, followed by all other Microsoft trademarks in alphabetical order. > are
either registered trademarks or trademarks of Microsoft Corporation in the U.S.A. and/or other
countries.
<This is where mention of specific, contractually obligated to, third party trademarks, which are
added by the Copy Editor>
The names of companies, products, people, characters, and/or data mentioned herein are fictitious
and are in no way intended to represent any real individual, company, product, or event, unless
otherwise noted.
Other product and company names mentioned herein may be the trademarks of their respective
owners.
Module 1: Introduction to Data Warehousing and OLAP i
BETA MATERIALS FOR MICROSOFT CERTIFIED TRAINER PREPARATION PURPOSES ONLY
Instructor Notes
This module introduces students to data warehousing and online analytical
processing (OLAP)—their uses, essential concepts, terminology, and
architecture.
The module describes the value of deriving business information from raw
operational data, and the process of using defined types of business analysis to
drive decision support systems. The module introduces data warehouses and
OLAP systems and describes the differences between relational data marts and
OLAP cubes.
Finally, the module introduces OLAP technology. Students will learn the
fundamentals of dimensions, members, and cubes. The materials also explore
methods for visualizing multidimensional databases.
After completing this module, students will be able to:
!
Describe characteristics, goals, and applications of a data warehouse.
!
Understand the need of and use for OLAP solutions.
!
Describe data warehouse design.
!
Understand the reasons for implementing OLAP models and describe their
components.
!
Visualize a multidimensional database.
Materials and Preparation
This section lists the required materials and preparation tasks that you need to
teach this module.
Required Materials
To teach this module, you need the following materials:
!
Microsoft
®
PowerPoint
®
file 2074A_01.ppt
!
Microsoft Excel
file DEMO_01.xls
!
Local cube file DEMO_01.cub
Preparation Tasks
To prepare for this module, you should:
!
Read all the student materials.
!
Read the instructor notes and margin notes.
!
Practice the lecture presentation and demonstration.
!
Review the Trainer Preparation presentation for this module on the Trainer
Materials compact disc.
!
Review any relevant white papers that are on the Trainer Materials compact
disc.
Presentation:
60 Minutes
Lab:
00 Minutes
ii Module 1: Introduction to Data Warehousing and OLAP
BETA MATERIALS FOR MICROSOFT CERTIFIED TRAINER PREPARATION PURPOSES ONLY
Other Activities
Difficult Questions
Below are difficult questions that students may ask you during the delivery of
this module and answers to the questions. These materials delve into subjects
that are within the scope of the module but are not specifically addressed in the
content of the student notes.
1. Is a data mart synonymous with a star schema?
Not necessarily. The data mart is a subset of a data warehouse with
data specific to a particular subject or business activity. It can be
relational or multidimensional.
A relational data mart may have one or many star schemas that belong
to the data mart and contain data particular to a subject.
Multidimensional data marts use star schemas behind the scenes to
support multidimensional data structures called cubes.
2. Are data marts only composed of summary data?
No. Data marts can contain detailed data in addition to summarized
data. Using summarized data marts is a way to enhance query
performance.
3. Do you need to purchase Microsoft SQL Server
™
2000 in order to use
Microsoft SQL Server 2000 Analysis Services?
Yes. Analysis Services is bundled with SQL Server. However, you can
install Analysis Services without using—or installing—SQL Server.
4. What are reasons to use OLAP technology instead of relational database
technology?
OLAP technology provides fast, intuitive access to numeric data. It
gives users the ability to browse the database themselves, without
needing intermediate parties to develop queries. OLAP technology
provides a central calculation engine to model complex business models
and processes.
5. Is Measures a dimension?
When administering a cube, Measures are treated differently from
dimensions. When browsing a cube and when using MDX, Measures is
simply a dimension with only one level—and no All level.
6. Is a cell that is empty—that is, it has no value—still a cell?
Yes. The intersection of a member from each dimension forms a cell,
whether that cell is populated or not. The cell does not take any
physical storage space, but a cube is a logical construct and does not
reflect the physical storage.
Module 1: Introduction to Data Warehousing and OLAP iii
BETA MATERIALS FOR MICROSOFT CERTIFIED TRAINER PREPARATION PURPOSES ONLY
Displaying the Animated PowerPoint Slides
All the animated build slides are identified with an icon of links on the lower
left corner of the slide.
!
To display the Data Warehouse System Components slide
This slide shows the components of a data warehouse system. In the slide, data
flows from sources systems to users. Integrate this information with material
from the student notes.
1. Advance to the first animation that displays, at the bottom of the slide, the
user data access, the data sources, and a data access line.
Explain that the purpose of a data warehouse is to expose business
information to users. The data that users are interested in is that which
resides in source systems.
2. Advance to the second animation to display a data access line that connects
the user data access to the data sources.
Explain that although users require the data in the source system, directly
accessing a source system can lead to several problems. Because source
systems are optimized for the inserts and updates associated with essential
business processes, user queries often burden these systems and interfere
with these essential processes. In addition, because these systems are
constantly changing, you will find that user data retrieval can produce
differing results and lead to inconsistent reports.
Given the limitations of source system reporting, explain that the best way
to meet the business analysis needs of an organization is by using a data
warehouse. Note that the transfer of data from the source system to users
becomes the primary function of the data warehouse.
3. Advance to the third animation to dissolve the data access line between the
users and data sources and to display the staging area.
Describe the characteristics of a staging area and note how data is extracted
from source systems for staging.
4. Advance to the fourth animation to display the data marts.
Describe a data mart. Mention that data marts can reside in relational
databases or in OLAP cubes.
5. Advance to the fifth animation to display the data warehouse.
Explain that the data warehouse is a virtual union of the subject-specific
data marts and cubes.
6. Advance to the sixth animation to display the user data access lines to the
data warehouse.
Reiterate that the business analysis needs of an organization define the need
for a data warehouse. Given this need, the transfer of data from the source
system to users becomes the primary function of the data warehouse.
iv Module 1: Introduction to Data Warehousing and OLAP
BETA MATERIALS FOR MICROSOFT CERTIFIED TRAINER PREPARATION PURPOSES ONLY
Module Strategy
Use the following strategy to present this module:
!
Introducing Data Warehousing
Present the differences between raw data and information. Describe the
characteristics of online transaction processing (OLTP) source systems and
give some examples of OLTP systems. Present the characteristics of a data
warehouse and describe the components of a data warehouse system.
!
Defining OLAP Solutions
Begin by introducing the basic characteristics of OLAP databases. Give
examples of common OLAP applications. Explain the differences between
relational data marts and OLAP cubes in terms of data storage, data content,
data sources, and data retrieval. Finally, introduce OLAP in
SQL Server 2000 and discuss its two main OLAP components—the
SQL Server database and Analysis Services.
!
Understanding Data Warehouse Design
Introduce the concept of a star schema and describe its characteristics. Next,
present the components of a fact table—foreign keys and measures—and
explain the concept of the fact table grain. Describe the characteristics of
dimension tables and give examples from a data warehouse. Finally, define
a snowflake schema as a variation of a star schema in which hierarchies are
stored in dimension tables.
!
Understanding OLAP Models
Define the key components of the OLAP database—measures, dimensions,
and cubes. Compare OLAP dimensions and relational dimensions. Next,
define the components of a dimension—levels and members—giving
examples of each. Discuss the family terms that describe the relationships
between levels and members in a dimension. Describe the characteristics of
measures. Finally, to summarize the requirements for building OLAP cubes
by using relational data sources, discuss how the relational source relates to
the OLAP cube.
!
Applying OLAP Cubes
Define a cube as the logical storage structure for an OLAP database.
Explain that each cell of a cube holds one value. Describe how users isolate
data with a cube. Introduce the concepts of slicing and dicing data in a cube,
and drilling up and drilling down through the levels in a hierarchy. Discuss
the visualization of multidimensional data, using spreadsheets to illustrate
the concept. Finally, connect to an OLAP cube by using a Microsoft Excel
PivotChart
®
to demonstrate the power of OLAP.
Module 1: Introduction to Data Warehousing and OLAP 1
BETA MATERIALS FOR MICROSOFT CERTIFIED TRAINER PREPARATION PURPOSES ONLY
Overview
!
Introducing Data Warehousing
!
Defining OLAP Solutions
!
Understanding Data Warehouse Design
!
Understanding OLAP Models
!
Applying OLAP Cubes
This module introduces you to data warehousing and online analytical
processing (OLAP)—their uses, essential concepts, terminology, and
architecture.
You will learn about the value of deriving business information from raw
operational data, and the process of using defined types of business analysis to
drive decision support systems.
You are introduced to data warehouses and OLAP systems and will learn the
differences between relational data marts and OLAP cubes.
Finally, you are introduced to OLAP technology. You will learn the
fundamentals of dimensions, members, and cubes. The materials also explore
methods for visualizing multidimensional databases.
After completing this module, you will be able to:
!
Describe characteristics, goals, and applications of a data warehouse.
!
Understand the need of and use for OLAP solutions.
!
Describe data warehouse design.
!
Understand the reasons for implementing OLAP models and describe their
components.
!
Visualize a multidimensional database.
Topic Objective
To provide an overview of
the module topics and
objectives.
Lead-in
In this module, you will learn
about data warehousing,
OLAP systems, and OLAP
cube fundamentals.
2 Module 1: Introduction to Data Warehousing and OLAP
BETA MATERIALS FOR MICROSOFT CERTIFIED TRAINER PREPARATION PURPOSES ONLY
#
##
#
Introducing Data Warehousing
!
Raw Data vs. Business Information
!
OLTP Source Systems
!
Data Warehouse Characteristics
!
Data Warehouse System Components
This section defines the differences between raw data and derived information,
describes online transaction processing (OLTP) systems, and introduces data
warehouse systems. An understanding of data warehouse system components is
important when you begin to design and implement decision support systems.
The following topics are discussed:
!
Raw data versus business information
!
OLTP source systems
!
Data warehouse characteristics
!
Data warehouse system components
Topic Objective
Introduce the concept of
data warehousing.
Lead-in
This section defines the
differences between raw
data and derived
information, describes OLTP
systems, and introduces
data warehouse systems.
Module 1: Introduction to Data Warehousing and OLAP 3
BETA MATERIALS FOR MICROSOFT CERTIFIED TRAINER PREPARATION PURPOSES ONLY
Raw Data vs. Business Information
!
Capturing Raw Data
$
Gathering data recorded in everyday operations
!
Deriving Business Information
$
Deriving meaningful information from raw data
!
Turning Data into Information
$
Implementing a decision support system
Turning raw data into valuable information is a core analysis process that drives
the operations and business decisions of a company.
Capturing Raw Data
A company typically captures large amounts of data daily. This data often
consists of raw facts that reflect the current state of the business.
Examples of raw data include:
!
An international retail music store chain captures sales data for every
product purchase, return, and exchange around the world. A raw fact may
describe the Chicago branch of this music store selling $10,000 worth of
merchandise in June of 2000.
!
A financial institution captures data for each customer’s checking and
savings account. A raw data fact may describe Stefan Knorr withdrawing
$50 from his checking account this morning in Amsterdam.
On the surface, this data provides an indication of what happens in the business.
However, the captured data can perform many more functions. The captured
data can help a company understand how it currently operates and help a
company plan its operations in the future.
Deriving Business Information
The process by which you can derive business information from raw data
involves:
!
Examining the raw data in several different contexts and from several
different points of view.
!
Determining how these facts relate to other data.
!
Understanding how this data reflects overall business goals and objectives.
Topic Objective
To describe the differences
and relationships between
raw data and business
information.
Lead-in
Turning raw data into
valuable information is a
core analysis process that
drives the operations and
business decisions of a
company.
Delivery Tip
Ask students about the
types of systems that they
work with that capture raw
data, derive business
information, and turn data
into information.
4 Module 1: Introduction to Data Warehousing and OLAP
BETA MATERIALS FOR MICROSOFT CERTIFIED TRAINER PREPARATION PURPOSES ONLY
By using this process, consider how the raw data from the previous examples is
converted to valuable business information.
The Chicago Music Store
Raw Data: The Chicago branch of this music store sold $10,000 worth of
merchandise in June 2000. However, the Chicago branch sold $15,000 in June
1999. The Chicago branch sales goal for June 2000 is $20,000.
Derived Information: It appears as if the Chicago branch did not meet its sales
goal for June 2000 and did not perform as well as the previous year. Business
analysis is now required to determine the cause of the decline in sales.
Typical business questions arising from this analysis include:
!
What products are selling in the Chicago store?
!
What products are not selling?
!
What is the effect of product promotions?
The Financial Institution
Raw Data: Stefan Knorr withdrew $50 from his checking account this morning
in Amsterdam. Stefan’s primary residence is located in Los Angeles, California.
In the past month, Stefan has withdrawn money from London, England; Oslo,
Norway; and Stockholm, Sweden.
Derived Information: Stefan apparently travels extensively throughout Europe.
Perhaps he would be interested in a special ATM card that allows unlimited
access to his checking account in 16 different countries for an additional yearly
fee. However, additional analysis is required to verify that he meets other
requirements for the new ATM card.
Typical business questions arising from this analysis include:
!
What is the average daily balance of his account?
!
How many times has this customer been overdrawn in the last 2 weeks? In
the last 2 months? In the last 2 years?
!
For what other promotions does he qualify?
Turning Data into Information
After the value of meaningful business analysis is recognized in an
organization, data and information requests become numerous and frequent.
Satisfying these requests can be a complex task as you navigate through the
large amounts of captured source data and attempt to consolidate, analyze, and
distribute information to other members of the organization.
To meet these requests, a company typically implements a decision support
system dedicated to providing data and information that can be used to perform
meaningful business analysis.
A company’s investment in these decision support systems is usually very large
in terms of expense, time, and effort. The return on this investment is reflected
in how well the decision support system can satisfy the business needs of the
organization.
Module 1: Introduction to Data Warehousing and OLAP 5
BETA MATERIALS FOR MICROSOFT CERTIFIED TRAINER PREPARATION PURPOSES ONLY
OLTP Source Systems
!
OLTP System Characteristics
$
Processes real-time transactions of a business
$
Contains data structures optimized for entries and edits
$
Provides limited decision support capabilities
!
OLTP Examples
$
Order tracking
$
Customer service
$
Point-of-sales
$
Service-based sales
$
Banking functions
OLTP systems are operational systems that capture the transactions of a
business and supply data to the data warehouse or data mart.
A given company may have one or many operational systems that conduct
essential business processes. These operational systems can be on separate
servers, on different networks, and may be internal or external to the company.
OLTP System Characteristics
OLTP operational systems:
!
Process real-time transactions of a business.
OLTP systems conduct essential business processes by tracking real-time
transactions. OLTP systems continually change to represent the current state
of the business. As the OLTP system processes new transactions, data is
updated or inserted into the OLTP system immediately.
!
Contain data structures optimized for entries and edits.
Because the performance of these systems is critical to keeping track of
essential business processes, data structures are optimized for data entry and
edits.
!
Provide limited decision support capabilities.
Decision support goals are not a priority of OLTP systems. Reporting from
operational systems may supply the most current data. However, directly
accessing a source system can have a negative impact on source system
performance and produce inconsistent reports due to the volatility of the
OLTP system.
Topic Objective
To define an OLTP source
system.
Lead-in
Here are the characteristics
of a database designed for
an OLTP environment.
Key Point
Point out that OLTP
systems are optimized for
inserts and updates, not
user queries.
6 Module 1: Introduction to Data Warehousing and OLAP
BETA MATERIALS FOR MICROSOFT CERTIFIED TRAINER PREPARATION PURPOSES ONLY
OLTP System Examples
OLTP operational system examples include:
!
Order-tracking applications, such as catalog sales.
!
Customer-service applications, such as setting up customer accounts.
!
Point-of-sales applications, such as paying for items at a grocery store.
!
Service-based sales applications, such as cellular telephone billing.
!
Banking functions, such as deposits and withdrawals.
Ask students to list
operational system
examples in their own
organizations.
Module 1: Introduction to Data Warehousing and OLAP 7
BETA MATERIALS FOR MICROSOFT CERTIFIED TRAINER PREPARATION PURPOSES ONLY
Data Warehouse Characteristics
!
Provides Data for Business Analysis Processes
!
Integrates Data from Heterogeneous Source Systems
!
Combines Validated Source Data
!
Organizes Data into Non-Volatile, Subject-Specific
Groups
!
Stores Data in Structures that Are Optimized for
Extraction and Querying
A data warehouse system has components that move data from a source system
to users who want to perform data analysis. The primary function of a data
warehouse system is to support an organization’s business analysis processes.
A data warehouse:
!
Provides data for business analysis processes.
A data warehouse is a data store that supports an organization’s business
analysis processes. Often, it is implemented as an enterprise-wide decision
support system, installed to provide a reporting environment that facilitates
data analysis by providing extensive decision support capabilities.
!
Integrates data from heterogeneous source systems.
Operational systems and, sometimes, external systems are the sources for
data warehouses. These heterogeneous source systems can contain
transformed and integrated source data from OLTP systems, previous-
version systems, text files, and spreadsheets.
!
Combines validated source data.
A data warehouse combines heterogeneous source data that has been
authenticated according to previously defined business rules. It is important
that the integrity of data in a data warehouse meet the standards of the
business rules and processes.
Topic Objective
To present the
characteristics of the data
warehouse.
Lead-in
The primary function of a
data warehouse system is to
support an organization’s
business analysis
processes.
8 Module 1: Introduction to Data Warehousing and OLAP
BETA MATERIALS FOR MICROSOFT CERTIFIED TRAINER PREPARATION PURPOSES ONLY
!
Organizes data into non-volatile, subject-specific groups.
A data warehouse stores data as non-volatile, subject-oriented data sets. A
data warehouse is a static environment. Data is updated and inserted into the
data warehouse periodically. The frequency of data updates and inserts
depends on business analysis requirements.
!
Stores data in physical structures that are optimized for data distribution and
querying.
A data warehouse facilitates data retrieval and analysis, and therefore query
performance is important. Thus, the design of a data warehouse is important
for optimal data distribution and querying.
Module 1: Introduction to Data Warehousing and OLAP 9
BETA MATERIALS FOR MICROSOFT CERTIFIED TRAINER PREPARATION PURPOSES ONLY
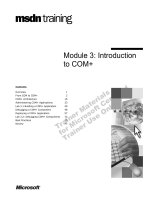
Data Warehouse System Components
Data Warehouse
Data Access
User
Data Access
Data
Sources
Data Input
Staging
Area
Data Marts
The data warehouse system contains several components that transfer data from
a source system to users who want to perform data analysis. It is important to
understand the role of a data warehouse system and where it persists in the data
flow of an organization.
User Data Access
The purpose of a data warehouse in an organization is to expose business
information to users. Users analyze data to derive business information and
thereby make decisions. The data that users are interested in is the data from
operational source systems.
Even though users require the data in these source systems, directly accessing a
source system can lead to several problems. Because source systems are
optimized for the inserts and updates associated with essential business
operations, user data access queries often burden and interfere with essential
business processes. In addition, because these systems are constantly changing,
you will find that user data retrieval can produce differing results and lead to
inconsistent reports.
Given the limitations of source system reporting, the best way to meet the
business analysis needs of an organization is to use a data warehouse. The
transfer of data from the source system to users becomes the primary function
of the data warehouse system.
The transfer of data from source system to user is the critical path of
a data warehouse system.
Topic Objective
To present the components
of a data warehouse
system.
Lead-in
A data warehouse system
contains many components
that move data from its
source system to users who
perform data analysis.
Delivery Tips
Use this slide to introduce
OLAP solutions and data
marts and to transition into
the next section that
describes OLAP solutions.
Use the slide to explain
each of the data warehouse
system components and the
relationships of the
components.
Before explaining the above
slide, review Displaying the
Animated PowerPoint Slides
in the Other Activities
section of the Instructor
Notes.
Important
10 Module 1: Introduction to Data Warehousing and OLAP
BETA MATERIALS FOR MICROSOFT CERTIFIED TRAINER PREPARATION PURPOSES ONLY
Data Sources
Source systems are known as OLTP systems or legacy systems in a mainframe
environment. Source systems are the operational systems that capture the
transactions of a business and supply data to the data warehouse or data mart.
A source system can be relational or non-relational. Source systems do not
generally contain large amounts of historical information, as they are
continually updated to reflect the current state of the business.
Staging Area
The staging area, or data preparation area, is a collection of processes that
cleans, transforms, combines, and prepares source data for use in the data
warehouse or data mart. In a staging area, source system data is transformed
into common formats, checked for consistency and referential integrity, and
prepared to load into the data warehouse database. A staging area:
!
Is on one or several computers.
!
May not be based on relational technologies.
!
Does not support user reporting.
Data Marts
The data mart is a subset of a data warehouse with data specific to a particular
subject or business activity, such as finance or customer analysis. Data marts:
!
Can be included (one or many subject-specific data marts) in a data
warehouse.
!
Can be built in relational or OLAP databases.
!
Can contain detailed or summarized data, which may or may not be shared
across data marts.
The definition of a data mart can vary. In this course, the data mart is a
subset of a data warehouse with data specific to a particular subject or business
activity. The data marts you will create in this course will be OLAP databases.
Data Warehouse
In this course, the data warehouse is defined as a virtual union of data marts
with integrated information that is shared across data marts. In other
circumstances, a data warehouse may be defined as a centralized, integrated
data store providing data to the data marts. Either definition is correct.
The definition of a data warehouse can vary from organization to
organization. In this course, the data warehouse is defined as a virtual union of
data marts with integrated information shared across data marts.
Note
Note
Module 1: Introduction to Data Warehousing and OLAP 11
BETA MATERIALS FOR MICROSOFT CERTIFIED TRAINER PREPARATION PURPOSES ONLY
#
##
#
Defining OLAP Solutions
!
OLAP Databases
!
Common OLAP Applications
!
Relational Data Marts and OLAP Cubes
!
OLAP in SQL Server 2000
In the previous section, you learned about data warehousing and the flow of
data from source systems to users. This section focuses on one area of the data
warehouse—the OLAP database. The section introduces OLAP databases,
describes common applications implemented by using OLAP technology,
differentiates relational data marts and OLAP cubes, and describes the OLAP
database solution available in Microsoft
®
SQL Server
™
2000.
Topic Objective
To define OLAP solutions.
Lead-in
This section introduces
OLAP solutions and defines
how they are used to
provide users with fast,
flexible data access.
12 Module 1: Introduction to Data Warehousing and OLAP
BETA MATERIALS FOR MICROSOFT CERTIFIED TRAINER PREPARATION PURPOSES ONLY
OLAP Databases
!
Optimized Schema for Fast User Queries
!
Robust Calculation Engine for Numeric Analysis
!
Conceptual, Intuitive Data Model
!
Multidimensional View of Data
$
Drill down and drill up
$
Pivot views of data
OLAP technology provides an alternative to relational database technology,
offering fast, flexible data viewing, analysis, and navigation. The following are
characteristics of OLAP technologies:
!
OLAP databases have an optimized schema for fast user queries.
OLAP queries are very fast, and allow for more interactive use from users
than typical relational database management system (RDBMS) reporting
applications. OLAP cubes store various levels of summarized data in data
structures highly optimized for user queries.
!
OLAP databases have a robust calculation engine for numeric analysis. You
use OLAP cubes for numeric analysis, from producing simple sales reports
to performing complex allocation algorithms. Many advanced calculations
performed by OLAP calculation engines cannot be performed by relational
databases because of analytical limitations in the RDBMS database engines.
!
OLAP is a conceptual, intuitive data model.
More than a particular database technology, OLAP is a conceptual, intuitive
data model that users can easily understand without the development of
custom reporting applications.
Topic Objective
To introduce the
fundamental characteristics
of OLAP databases.
Lead-in
OLAP database technology
provides an alternative to
relational database
technology, offering fast,
flexible data viewing,
analysis, and navigation.
Key Point
OLAP technology is
considered something in
between a relational
database management
system (RDBMS) and a
spreadsheet.
Module 1: Introduction to Data Warehousing and OLAP 13
BETA MATERIALS FOR MICROSOFT CERTIFIED TRAINER PREPARATION PURPOSES ONLY
!
OLAP provides a multidimensional view of data.
Cubes provide a multidimensional view of data that extends beyond
standard two-dimensional analysis. OLAP allows flexible data viewing,
analysis, and navigation.
• Users can drill down and drill up through various levels of summarized
data. In OLAP cubes, data is stored in both detailed and summarized
levels. OLAP cubes give users the opportunity to easily drill down—that
is, to double-click top-to-bottom through the summarized levels to more
detailed levels of data—or drill up from lower levels to more
summarized levels of data.
• Users can pivot views of data. Users can easily switch the rows,
columns, and pages in OLAP reports. The term pivoting defines the
intuitive mouse action by users that changes the orientation of their
reports.